


More on Personal Growth

Patryk Nawrocki
4 years ago
7 things a new UX/UI designer should know

If I could tell my younger self a few rules, they would boost my career.
1. Treat design like medicine; don't get attached.
If it doesn't help, you won't be angry, but you'll try to improve it. Designers blame others if they don't like the design, but the rule is the same: we solve users' problems. You're not your design, and neither are they. Be humble with your work because your assumptions will often be wrong and users will behave differently.
2. Consider your design flawed.
Disagree with yourself, then defend your ideas. Most designers forget to dig deeper into a pattern, screen, button, or copywriting. If someone asked, "Have you considered alternatives? How does this design stack up? Here's a functional UX checklist to help you make design decisions.
3. Codeable solutions.
If your design requires more developer time, consider whether it's worth spending more money to code something with a small UX impact. Overthinking problems and designing abstract patterns is easy. Sometimes you see something on dribbble or bechance and try to recreate it, but it's not worth it. Here's my article on it.
4. Communication changes careers

Designers often talk with users, clients, companies, developers, and other designers. How you talk and present yourself can land you a job. Like driving or swimming, practice it. Success requires being outgoing and friendly. If I hadn't said "hello" to a few people, I wouldn't be where I am now.
5. Ignorance of the law is not an excuse.

Copyright, taxation How often have you used an icon without checking its license? If you use someone else's work in your project, the owner can cause you a lot of problems — paying a lot of money isn't worth it. Spend a few hours reading about copyrights, client agreements, and taxes.
6. Always test your design

If nobody has seen or used my design, it's not finished. Ask friends about prototypes. Testing reveals how wrong your assumptions were. Steve Krug, one of the authorities on this topic will tell you more about how to do testing.
7. Run workshops
A UX designer's job involves talking to people and figuring out what they need, which is difficult because they usually don't know. Organizing teamwork sessions is a powerful skill, but you must also be a good listener. Your job is to help a quiet, introverted developer express his solution and control the group. AJ Smart has more on workshops here.

Tim Denning
3 years ago
Read These Books on Personal Finance to Boost Your Net Worth
And retire sooner.
Books can make you filthy rich.
If you apply what you learn. In 2011, I was broke and had broken dreams.
Someone suggested I read finance books. One Up On Wall Street was his first recommendation.
Finance books were my crack.
I've read every money book since then. Some are good, but most stink.
These books will make you rich.
The Almanack of Naval Ravikant by Eric Jorgenson
This isn't a cliche book.
This book was inspired by a How to Get Rich tweet thread.
It’s one of the best tweets I’ve ever read.
Naval thinks differently. He nukes ordinary ideas. I've never heard better money advice.
Eric Jorgenson wrote a book about this tweet thread with Navals permission. A must-read, easy-to-digest book.
Best quote
Seek wealth, not money or status. Wealth is having assets that earn while you sleep. Money is how we transfer time and wealth. Status is your place in the social hierarchy — Naval
Morgan Housel's The Psychology of Money
Many finance books advise investing like a dunce.
They almost all peddle the buy an index fund BS. Different book.
It's about money-making psychology. Because any fool can get rich and drunk on their ego. Few can consistently make money.
Each chapter is short. A single-page chapter breaks all book publishing rules.
Best quote
Spending money to show people how much money you have is the fastest way to have less money — Morgan Housel
J.L. Collins' The Simple Path to Wealth
Most of the best money books were written by bloggers.
JL Collins blogs. This easy-to-read book was written for his daughter.
This book popularized the phrase F You Money. With enough money in your bank account and investment portfolio, you can say F You more.
A bad boss is an example. You can leave instead of enduring his wrath.
You can then sit at home and look for another job while financially secure. JL says its mind-freedom is powerful.
Best phrasing
You own the things you own and they in turn own you — J.L. Collins
Tony Robbins' Unshakeable
I like Tony. This book makes me sweaty.
Tony interviews the world's top financiers. He interviews people who rarely do so.
This book taught me all-weather portfolio. It's a way to invest in different asset classes in good, bad, recession, or depression times.
Look at it:
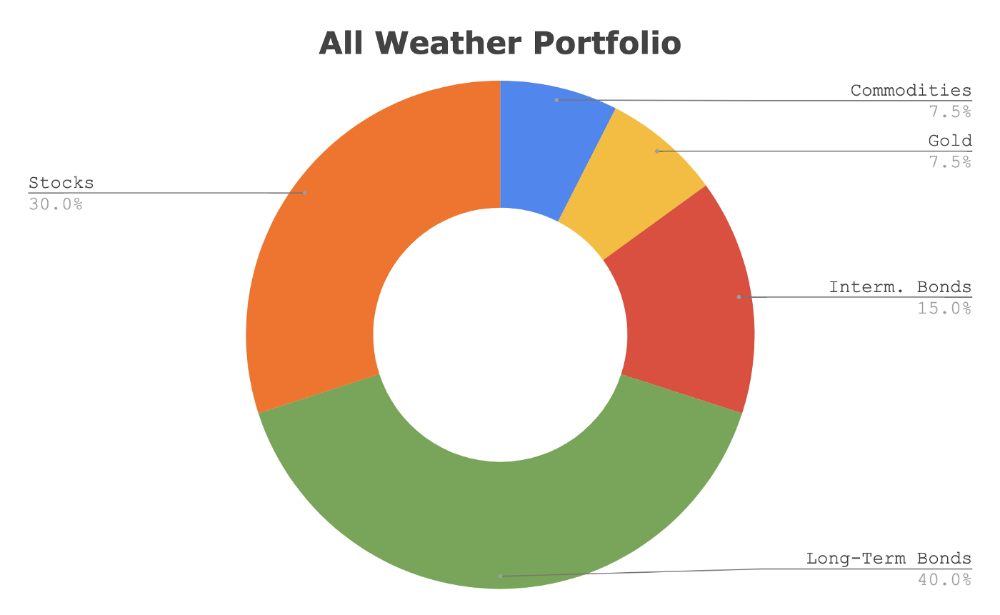
Investing isn’t about buying one big winner — that’s gambling. It’s about investing in a diversified portfolio of assets.
Best phrasing
The best opportunities come in times of maximum pessimism — Tony Robbins
Ben Graham's The Intelligent Investor
This book helped me distinguish between a spectator and an investor.
Spectators are those who shout that crypto, NFTs, or XYZ platform will die.
Tourists. They want attention and to say "I told you so." They make short-term and long-term predictions like fortunetellers. LOL. Idiots.
Benjamin Graham teaches smart investing. You'll buy a long-term asset. To be confident in recessions, use dollar-cost averaging.
Best phrasing
Those who do not remember the past are condemned to repeat it. — Benjamin Graham
The Napoleon Hill book Think and Grow Rich
This classic book introduced positive thinking to modern self-help.
Lazy pessimists can't become rich. No way.
Napoleon said, "Thoughts create reality."
No surprise that he discusses obsession and focus in this book. They are the fastest ways to make more money to invest in time and wealth-protecting assets.
Best phrasing
The starting point of all achievement is DESIRE. Keep this constantly in mind. Weak desire brings weak results, just as a small fire makes a small amount of heat — Napoleon Hill
Ramit Sethi's book I Will Teach You To Be Rich
This book is mostly good. The part about credit cards is trash.
Avoid credit card temptations. I don't care about their airline points.
This book teaches you to master money basics (that many people mess up) then automate it so your monkey brain doesn't ruin your financial future.
The book includes great negotiation tactics to help you make more money in less time.
Best quote
The 85 Percent Solution: Getting started is more important than becoming an expert — Ramit Sethi
David Bach's The Automatic Millionaire
You've probably met a six- or seven-figure earner who's broke. All their money goes to useless things like cars.
Money isn't as essential as what you do with it. David teaches how to automate your earnings for more money.
Compounding works once investing is automated. So you get rich.
His strategy eliminates luck and (almost) guarantees millionaire status.
Best phrasing
Every time you earn one dollar, make sure to pay yourself first — David Bach
Thomas J. Stanley's The Millionaire Next Door
Thomas defies the definition of rich.
He spends much of the book highlighting millionaire traits he's studied.
Rich people are quiet, so you wouldn't know they're wealthy. They don't earn much money or drive a BMW.
Thomas will give you the math to get started.
Best phrasing
I am not impressed with what people own. But I’m impressed with what they achieve. I’m proud to be a physician. Always strive to be the best in your field…. Don’t chase money. If you are the best in your field, money will find you. — Thomas J. Stanley
by Bill Perkins "Die With Zero"
Let’s end with one last book.
Bill's book angered many people. He says we spend too much time saving for retirement and die rich. That bank money is lost time.
Your grandkids could use the money. When children inherit money, they become lazy, entitled a-holes.
Bill wants us to spend our money on life-enhancing experiences. Stop saving money like monopoly monkeys.
Best phrasing
You should be focusing on maximizing your life enjoyment rather than on maximizing your wealth. Those are two very different goals. Money is just a means to an end: Having money helps you to achieve the more important goal of enjoying your life. But trying to maximize money actually gets in the way of achieving the more important goal — Bill Perkins

Scott Stockdale
4 years ago
A Day in the Life of Lex Fridman Can Help You Hit 6-Month Goals
The Lex Fridman podcast host has interviewed Elon Musk.
Lex is a minimalist YouTuber. His videos are sloppy. Suits are his trademark.
In a video, he shares a typical day. I've smashed my 6-month goals using its ideas.
Here's his schedule.
Morning Mantra
Not woo-woo. Lex's mantra reflects his practicality.
Four parts.
Rulebook
"I remember the game's rules," he says.
Among them:
Sleeping 6–8 hours nightly
1–3 times a day, he checks social media.
Every day, despite pain, he exercises. "I exercise uninjured body parts."
Visualize
He imagines his day. "Like Sims..."
He says three things he's grateful for and contemplates death.
"Today may be my last"
Objectives
Then he visualizes his goals. He starts big. Five-year goals.
Short-term goals follow. Lex says they're year-end goals.
Near but out of reach.
Principles
He lists his principles. Assertions. His goals.
He acknowledges his cliche beliefs. Compassion, empathy, and strength are key.
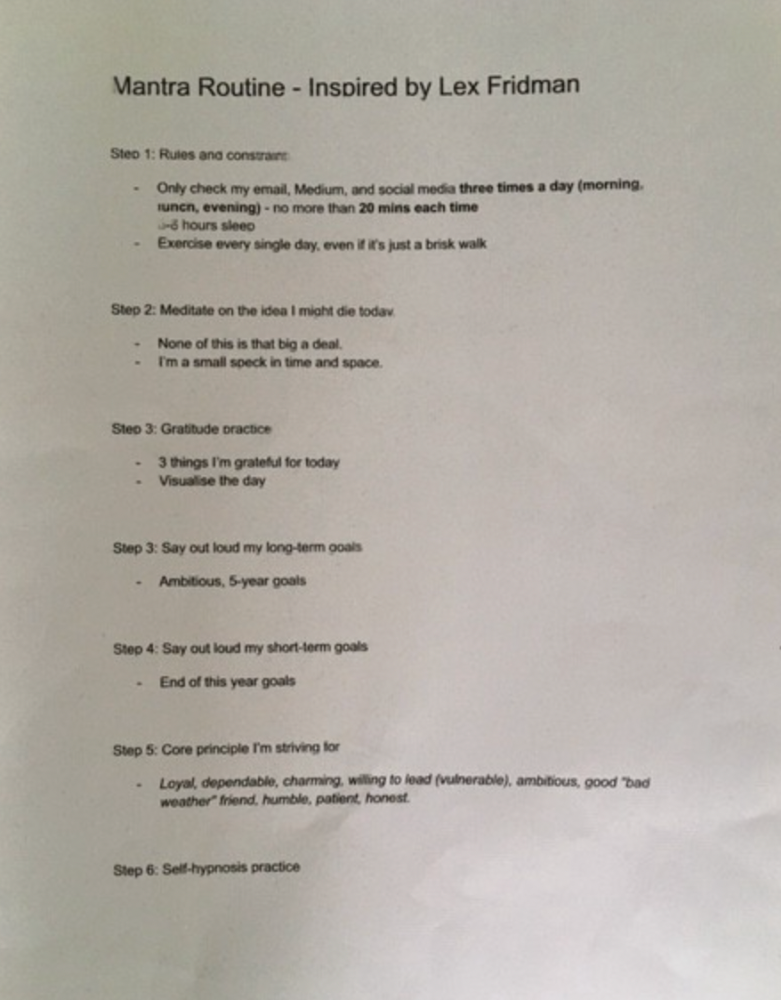
Here's my mantra routine:
Four-Hour Deep Work
Lex begins a four-hour deep work session after his mantra routine. Today's toughest.
AI is Lex's specialty. His video doesn't explain what he does.
Clearly, he works hard.
Before starting, he has water, coffee, and a bathroom break.
"During deep work sessions, I minimize breaks."
He's distraction-free. Phoneless. Silence. Nothing. Any loose ideas are typed into a Google doc for later. He wants to work.
"Just get the job done. Don’t think about it too much and feel good once it’s complete." — Lex Fridman
30-Minute Social Media & Music
After his first deep work session, Lex rewards himself.
10 minutes on social media, 20 on music. Upload content and respond to comments in 10 minutes. 20 minutes for guitar or piano.
"In the real world, I’m currently single, but in the music world, I’m in an open relationship with this beautiful guitar. Open relationship because sometimes I cheat on her with the acoustic." — Lex Fridman
Two-hour exercise
Then exercise for two hours.
Daily runs six miles. Then he chooses how far to go. Run time is an hour.
He does bodyweight exercises. Every minute for 15 minutes, do five pull-ups and ten push-ups. It's David Goggins-inspired. He aims for an hour a day.
He's hungry. Before running, he takes a salt pill for electrolytes.
He'll then take a one-minute cold shower while listening to cheesy songs. Afterward, he might eat.
Four-Hour Deep Work
Lex's second work session.
He works 8 hours a day.
Again, zero distractions.
Eating
The video's meal doesn't look appetizing, but it's healthy.
It's ground beef with vegetables. Cauliflower is his "ground-floor" veggie. "Carrots are my go-to party food."
Lex's keto diet includes 1800–2000 calories.
He drinks a "nutrient-packed" Atheltic Greens shake and takes tablets. It's:
One daily tablet of sodium.
Magnesium glycinate tablets stopped his keto headaches.
Potassium — "For electrolytes"
Fish oil: healthy joints
“So much of nutrition science is barely a science… I like to listen to my own body and do a one-person, one-subject scientific experiment to feel good.” — Lex Fridman
Four-hour shallow session
This work isn't as mentally taxing.
Lex planned to:
Finish last session's deep work (about an hour)
Adobe Premiere podcasting (about two hours).
Email-check (about an hour). Three times a day max. First, check for emergencies.
If he's sick, he may watch Netflix or YouTube documentaries or visit friends.
“The possibilities of chaos are wide open, so I can do whatever the hell I want.” — Lex Fridman
Two-hour evening reading
Nonstop work.
Lex ends the day reading academic papers for an hour. "Today I'm skimming two machine learning and neuroscience papers"
This helps him "think beyond the paper."
He reads for an hour.
“When I have a lot of energy, I just chill on the bed and read… When I’m feeling tired, I jump to the desk…” — Lex Fridman
Takeaways
Lex's day-in-the-life video is inspiring.
He has positive energy and works hard every day.
Schedule:
Mantra Routine includes rules, visualizing, goals, and principles.
Deep Work Session #1: Four hours of focus.
10 minutes social media, 20 minutes guitar or piano. "Music brings me joy"
Six-mile run, then bodyweight workout. Two hours total.
Deep Work #2: Four hours with no distractions. Google Docs stores random thoughts.
Lex supplements his keto diet.
This four-hour session is "open to chaos."
Evening reading: academic papers followed by fiction.
"I value some things in life. Work is one. The other is loving others. With those two things, life is great." — Lex Fridman
You might also like

CyberPunkMetalHead
3 years ago
195 countries want Terra Luna founder Do Kwon
Interpol has issued a red alert on Terraform Labs' CEO, South Korean prosecutors said.

After the May crash of Terra Luna revealed tax evasion issues, South Korean officials filed an arrest warrant for Do Kwon, but he is missing.
Do Kwon is now a fugitive in 195 countries after Seoul prosecutors placed him to Interpol's red list. Do Kwon hasn't commented since then. The red list allows any country's local authorities to apprehend Do Kwon.
Do Dwon and Terraform Labs were believed to have moved to Singapore days before the $40 billion wipeout, but Singapore authorities said he fled the country on September 17. Do Kwon tweeted that he wasn't on the run and cited privacy concerns.
Do Kwon was not on the red list at the time and said he wasn't "running," only to reply to his own tweet saying he hasn't jogged in a while and needed to trim calories.
Whether or not it makes sense to read too much into this, the reality is that Do Kwon is now on Interpol red list, despite the firmly asserts on twitter that he does absolutely nothing to hide.
UPDATE:
South Korean authorities are investigating alleged withdrawals of over $60 million U.S. and seeking to freeze these assets. Korean authorities believe a new wallet exchanged over 3000 BTC through OKX and Kucoin.
Do Kwon and the Luna Foundation Guard (of whom Do Kwon is a key member of) have declined all charges and dubbed this disinformation.
Singapore's Luna Foundation Guard (LFG) manages the Terra Ecosystem.
The Legal Situation
Multiple governments are searching for Do Kwon and five other Terraform Labs employees for financial markets legislation crimes.
South Korean authorities arrested a man suspected of tax fraud and Ponzi scheme.
The U.S. SEC is also examining Terraform Labs on how UST was advertised as a stablecoin. No legal precedent exists, so it's unclear what's illegal.
The future of Terraform Labs, Terra, and Terra 2 is unknown, and despite what Twitter shills say about LUNC, the company remains in limbo awaiting a decision that will determine its fate. This project isn't a wise investment.
CyberPunkMetalHead
3 years ago
I talked to ChatGPT about the adoption of cryptocurrencies.

OpenAI's ChatGPT is an amazing AI-powered chatbot. It can write poetry, fiction, and marketing ideas. I was impressed how well ChatGPT followed the interview, albeit there were a few classics “I’m afraid I can’t do that”.
Full interview below.
Me: I'm your interviewer. We'll discuss crypto. Thanks for being interviewed. What do you think about cryptocurrency?
CGPT: Cryptocurrency is an innovative technology that could transform money and financial activities. It might boost the efficiency and security of financial institutions and let consumers deal directly without banks. Cryptocurrency is still a new and untested technology with many unknowns and hurdles before it can be broadly accepted.
Me: Over 22,000 cryptocurrencies exist, and many have little use. We need how much cryptocurrencies?
CGPT: The appropriate quantity will rely on a multitude of factors, including each cryptocurrency's use cases, adoption rate, and market rivalry. Only a few cryptocurrencies will likely receive widespread adoption and be successful. Many existing cryptocurrencies may not survive since they can't deliver new or valued solutions or compete with more established cryptocurrencies.
Me: Will cryptocurrencies grow? What's next for worldwide adoption?
CGPT: It's hard to forecast the future of cryptocurrencies because the acceptance of new technologies is unpredictable. I believe cryptocurrencies will expand and acquire popularity in the future years. Regulatory ambiguity, security concerns, and scalability issues must be overcome for this to happen. Cryptocurrency companies and organizations must engage together with governments and authorities to address these obstacles and establish a growth-friendly climate. Continued innovation and improvement of the technology, including public education and awareness, will drive acceptance.
Me: Do bear markets affect bitcoin adoption?
CGPT: On the one hand, a bear market might induce uncertainty and hesitation among potential consumers. Bear markets can present opportunities for long-term investors who can acquire cryptocurrencies at cheaper prices and are more likely to hang onto their assets. A bear market can also test the tenacity and power of the underlying technology and community, which can boost long-term confidence and adoption. A bear market might have profound and nuanced effects on bitcoin adoption.
Me: What are some likely outcomes if Bitcoin reaches $100,000 by next year?
CGPT: If Bitcoin saw rapid growth, it would undoubtedly have repercussions for the cryptocurrency market and economy. Possible scenarios include increased public interest and awareness of cryptocurrency, a surge in demand for Bitcoin and other cryptocurrencies, and a growth in the cryptocurrency industry's market value. By shifting their focus and cash to the cryptocurrency market, investors and traders may also affect other asset classes, such as traditional equities and commodities. Governments and financial organizations may focus more on the cryptocurrency sector as they try to grasp Bitcoin's rapid rise.
Me: Will other countries accept crypto as currency?
CGPT: It's hard to say if additional governments will adopt cryptocurrencies as legal tender. Some countries have recognized the promise of bitcoin and are exploring its use, while others are cautious. Adoption of bitcoin as legal cash may vary by country, based on financial infrastructure, rules, and political atmosphere. As cryptocurrency technology evolves and becomes more accepted, more governments may embrace it as legal tender.
Me: Final question: will the recent cryptocurrency hacks affect long term adoption?
CGPT: Hacks might tarnish cryptocurrency's reputation and public faith in its security, the technology underpinning it is continually improving. Many cryptocurrency projects have developed strong security mechanisms to prevent hacks and other dangers, and these safeguards will undoubtedly improve over time. The decentralized nature of cryptocurrency makes it more resistant to attacks. Hacks and other security breaches are a concern, but they may not affect cryptocurrency adoption.

Jared Heyman
3 years ago
The survival and demise of Y Combinator startups
I've written a lot about Y Combinator's success, but as any startup founder or investor knows, many startups fail.
Rebel Fund invests in the top 5-10% of new Y Combinator startups each year, so we focus on identifying and supporting the most promising technology startups in our ecosystem. Given the power law dynamic and asymmetric risk/return profile of venture capital, we worry more about our successes than our failures. Since the latter still counts, this essay will focus on the proportion of YC startups that fail.
Since YC's launch in 2005, the figure below shows the percentage of active, inactive, and public/acquired YC startups by batch.
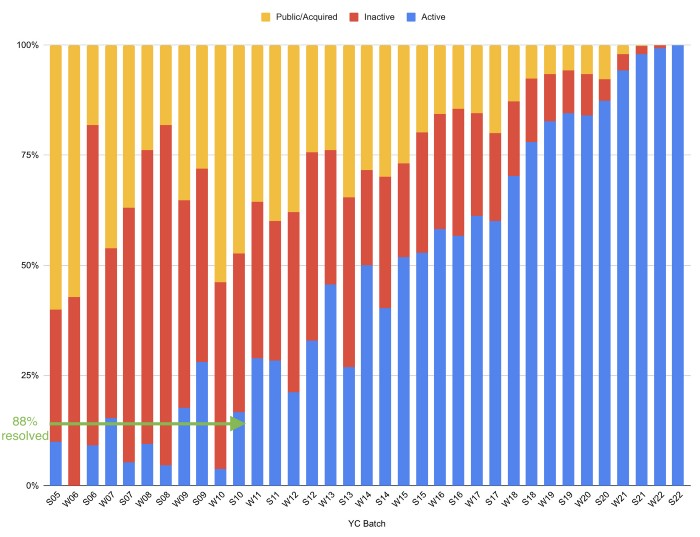
As more startups finish, the blue bars (active) decrease significantly. By 12 years, 88% of startups have closed or exited. Only 7% of startups reach resolution each year.
YC startups by status after 12 years:
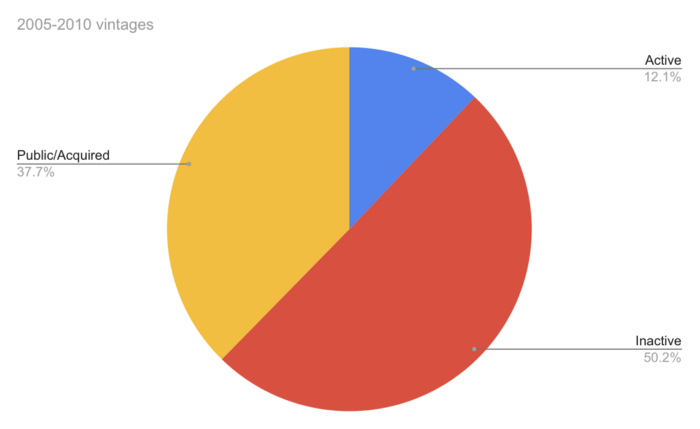
Half the startups have failed, over one-third have exited, and the rest are still operating.
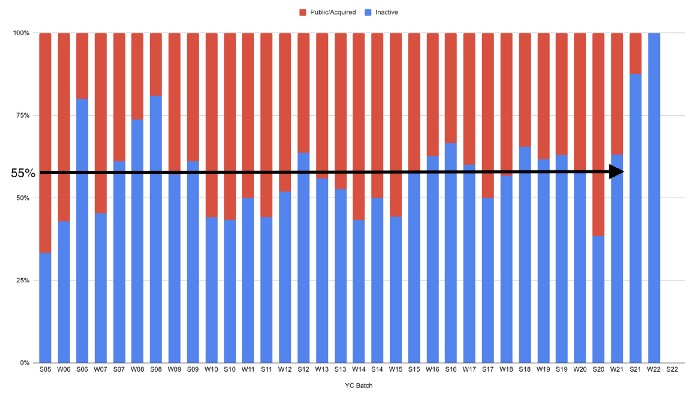
In venture investing, it's said that failed investments show up before successful ones. This is true for YC startups, but only in their early years.
Below, we only present resolved companies from the first chart. Some companies fail soon after establishment, but after a few years, the inactive vs. public/acquired ratio stabilizes around 55:45. After a few years, a YC firm is roughly as likely to quit as fail, which is better than I imagined.
I prepared this post because Rebel investors regularly question me about YC startup failure rates and how long it takes for them to exit or shut down.
Early-stage venture investors can overlook it because 100x investments matter more than 0x investments.
YC founders can ignore it because it shouldn't matter if many of their peers succeed or fail ;)