


How a $300K Bored Ape Yacht Club NFT was accidentally sold for $3K
The Bored Ape Yacht Club is one of the most prestigious NFT collections in the world. A collection of 10,000 NFTs, each depicting an ape with different traits and visual attributes, Jimmy Fallon, Steph Curry and Post Malone are among their star-studded owners. Right now the price of entry is 52 ether, or $210,000.
Which is why it's so painful to see that someone accidentally sold their Bored Ape NFT for $3,066.
Unusual trades are often a sign of funny business, as in the case of the person who spent $530 million to buy an NFT from themselves. In Saturday's case, the cause was a simple, devastating "fat-finger error." That's when people make a trade online for the wrong thing, or for the wrong amount. Here the owner, real name Max or username maxnaut, meant to list his Bored Ape for 75 ether, or around $300,000. Instead he accidentally listed it for 0.75. One hundredth the intended price.
It was bought instantaneously. The buyer paid an extra $34,000 to speed up the transaction, ensuring no one could snap it up before them. The Bored Ape was then promptly listed for $248,000. The transaction appears to have been done by a bot, which can be coded to immediately buy NFTs listed below a certain price on behalf of their owners in order to take advantage of these exact situations.
"How'd it happen? A lapse of concentration I guess," Max told me. "I list a lot of items every day and just wasn't paying attention properly. I instantly saw the error as my finger clicked the mouse but a bot sent a transaction with over 8 eth [$34,000] of gas fees so it was instantly sniped before I could click cancel, and just like that, $250k was gone."
"And here within the beauty of the Blockchain you can see that it is both honest and unforgiving," he added.
Fat finger trades happen sporadically in traditional finance -- like the Japanese trader who almost bought 57% of Toyota's stock in 2014 -- but most financial institutions will stop those transactions if alerted quickly enough. Since cryptocurrency and NFTs are designed to be decentralized, you essentially have to rely on the goodwill of the buyer to reverse the transaction.
Fat finger errors in cryptocurrency trades have made many a headline over the past few years. Back in 2019, the company behind Tether, a cryptocurrency pegged to the US dollar, nearly doubled its own coin supply when it accidentally created $5 billion-worth of new coins. In March, BlockFi meant to send 700 Gemini Dollars to a set of customers, worth roughly $1 each, but mistakenly sent out millions of dollars worth of bitcoin instead. Last month a company erroneously paid a $24 million fee on a $100,000 transaction.
Similar incidents are increasingly being seen in NFTs, now that many collections have accumulated in market value over the past year. Last month someone tried selling a CryptoPunk NFT for $19 million, but accidentally listed it for $19,000 instead. Back in August, someone fat finger listed their Bored Ape for $26,000, an error that someone else immediately capitalized on. The original owner offered $50,000 to the buyer to return the Bored Ape -- but instead the opportunistic buyer sold it for the then-market price of $150,000.
"The industry is so new, bad things are going to happen whether it's your fault or the tech," Max said. "Once you no longer have control of the outcome, forget and move on."
The Bored Ape Yacht Club launched back in April 2021, with 10,000 NFTs being sold for 0.08 ether each -- about $190 at the time. While NFTs are often associated with individual digital art pieces, collections like the Bored Ape Yacht Club, which allow owners to flaunt their NFTs by using them as profile pictures on social media, are becoming increasingly prevalent. The Bored Ape Yacht Club has since become the second biggest NFT collection in the world, second only to CryptoPunks, which launched in 2017 and is considered the "original" NFT collection.
More on Web3 & Crypto

Farhan Ali Khan
2 years ago
Introduction to Zero-Knowledge Proofs: The Art of Proving Without Revealing
Zero-Knowledge Proofs for Beginners
Published here originally.
Introduction
I Spy—did you play as a kid? One person chose a room object, and the other had to guess it by answering yes or no questions. I Spy was entertaining, but did you know it could teach you cryptography?
Zero Knowledge Proofs let you show your pal you know what they picked without exposing how. Math replaces electronics in this secret spy mission. Zero-knowledge proofs (ZKPs) are sophisticated cryptographic tools that allow one party to prove they have particular knowledge without revealing it. This proves identification and ownership, secures financial transactions, and more. This article explains zero-knowledge proofs and provides examples to help you comprehend this powerful technology.
What is a Proof of Zero Knowledge?
Zero-knowledge proofs prove a proposition is true without revealing any other information. This lets the prover show the verifier that they know a fact without revealing it. So, a zero-knowledge proof is like a magician's trick: the prover proves they know something without revealing how or what. Complex mathematical procedures create a proof the verifier can verify.
Want to find an easy way to test it out? Try out with tis awesome example! ZK Crush
Describe it as if I'm 5
Alex and Jack found a cave with a center entrance that only opens when someone knows the secret. Alex knows how to open the cave door and wants to show Jack without telling him.
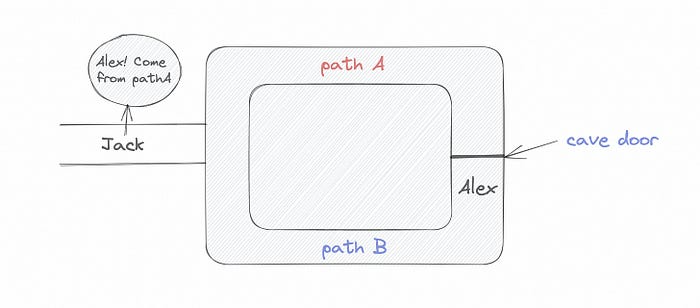
Alex and Jack name both pathways (let’s call them paths A and B).
In the first phase, Alex is already inside the cave and is free to select either path, in this case A or B.
As Alex made his decision, Jack entered the cave and asked him to exit from the B path.
Jack can confirm that Alex really does know the key to open the door because he came out for the B path and used it.
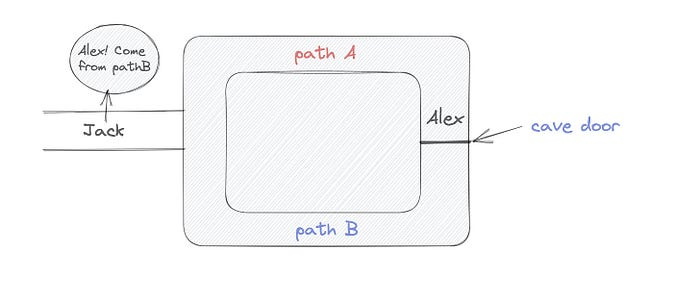
To conclude, Alex and Jack repeat:
Alex walks into the cave.
Alex follows a random route.
Jack walks into the cave.
Alex is asked to follow a random route by Jack.
Alex follows Jack's advice and heads back that way.
What is a Zero Knowledge Proof?
At a high level, the aim is to construct a secure and confidential conversation between the prover and the verifier, where the prover convinces the verifier that they have the requisite information without disclosing it. The prover and verifier exchange messages and calculate in each round of the dialogue.
The prover uses their knowledge to prove they have the information the verifier wants during these rounds. The verifier can verify the prover's truthfulness without learning more by checking the proof's mathematical statement or computation.
Zero knowledge proofs use advanced mathematical procedures and cryptography methods to secure communication. These methods ensure the evidence is authentic while preventing the prover from creating a phony proof or the verifier from extracting unnecessary information.
ZK proofs require examples to grasp. Before the examples, there are some preconditions.
Criteria for Proofs of Zero Knowledge
Completeness: If the proposition being proved is true, then an honest prover will persuade an honest verifier that it is true.
Soundness: If the proposition being proved is untrue, no dishonest prover can persuade a sincere verifier that it is true.
Zero-knowledge: The verifier only realizes that the proposition being proved is true. In other words, the proof only establishes the veracity of the proposition being supported and nothing more.
The zero-knowledge condition is crucial. Zero-knowledge proofs show only the secret's veracity. The verifier shouldn't know the secret's value or other details.
Example after example after example
To illustrate, take a zero-knowledge proof with several examples:
Initial Password Verification Example
You want to confirm you know a password or secret phrase without revealing it.
Use a zero-knowledge proof:
You and the verifier settle on a mathematical conundrum or issue, such as figuring out a big number's components.
The puzzle or problem is then solved using the hidden knowledge that you have learned. You may, for instance, utilize your understanding of the password to determine the components of a particular number.
You provide your answer to the verifier, who can assess its accuracy without knowing anything about your private data.
You go through this process several times with various riddles or issues to persuade the verifier that you actually are aware of the secret knowledge.
You solved the mathematical puzzles or problems, proving to the verifier that you know the hidden information. The proof is zero-knowledge since the verifier only sees puzzle solutions, not the secret information.
In this scenario, the mathematical challenge or problem represents the secret, and solving it proves you know it. The evidence does not expose the secret, and the verifier just learns that you know it.
My simple example meets the zero-knowledge proof conditions:
Completeness: If you actually know the hidden information, you will be able to solve the mathematical puzzles or problems, hence the proof is conclusive.
Soundness: The proof is sound because the verifier can use a publicly known algorithm to confirm that your answer to the mathematical conundrum or difficulty is accurate.
Zero-knowledge: The proof is zero-knowledge because all the verifier learns is that you are aware of the confidential information. Beyond the fact that you are aware of it, the verifier does not learn anything about the secret information itself, such as the password or the factors of the number. As a result, the proof does not provide any new insights into the secret.
Explanation #2: Toss a coin.
One coin is biased to come up heads more often than tails, while the other is fair (i.e., comes up heads and tails with equal probability). You know which coin is which, but you want to show a friend you can tell them apart without telling them.
Use a zero-knowledge proof:
One of the two coins is chosen at random, and you secretly flip it more than once.
You show your pal the following series of coin flips without revealing which coin you actually flipped.
Next, as one of the two coins is flipped in front of you, your friend asks you to tell which one it is.
Then, without revealing which coin is which, you can use your understanding of the secret order of coin flips to determine which coin your friend flipped.
To persuade your friend that you can actually differentiate between the coins, you repeat this process multiple times using various secret coin-flipping sequences.
In this example, the series of coin flips represents the knowledge of biased and fair coins. You can prove you know which coin is which without revealing which is biased or fair by employing a different secret sequence of coin flips for each round.
The evidence is zero-knowledge since your friend does not learn anything about which coin is biased and which is fair other than that you can tell them differently. The proof does not indicate which coin you flipped or how many times you flipped it.
The coin-flipping example meets zero-knowledge proof requirements:
Completeness: If you actually know which coin is biased and which is fair, you should be able to distinguish between them based on the order of coin flips, and your friend should be persuaded that you can.
Soundness: Your friend may confirm that you are correctly recognizing the coins by flipping one of them in front of you and validating your answer, thus the proof is sound in that regard. Because of this, your acquaintance can be sure that you are not just speculating or picking a coin at random.
Zero-knowledge: The argument is that your friend has no idea which coin is biased and which is fair beyond your ability to distinguish between them. Your friend is not made aware of the coin you used to make your decision or the order in which you flipped the coins. Consequently, except from letting you know which coin is biased and which is fair, the proof does not give any additional information about the coins themselves.
Figure out the prime number in Example #3.
You want to prove to a friend that you know their product n=pq without revealing p and q. Zero-knowledge proof?
Use a variant of the RSA algorithm. Method:
You determine a new number s = r2 mod n by computing a random number r.
You email your friend s and a declaration that you are aware of the values of p and q necessary for n to equal pq.
A random number (either 0 or 1) is selected by your friend and sent to you.
You send your friend r as evidence that you are aware of the values of p and q if e=0. You calculate and communicate your friend's s/r if e=1.
Without knowing the values of p and q, your friend can confirm that you know p and q (in the case where e=0) or that s/r is a legitimate square root of s mod n (in the situation where e=1).
This is a zero-knowledge proof since your friend learns nothing about p and q other than their product is n and your ability to verify it without exposing any other information. You can prove that you know p and q by sending r or by computing s/r and sending that instead (if e=1), and your friend can verify that you know p and q or that s/r is a valid square root of s mod n without learning anything else about their values. This meets the conditions of completeness, soundness, and zero-knowledge.
Zero-knowledge proofs satisfy the following:
Completeness: The prover can demonstrate this to the verifier by computing q = n/p and sending both p and q to the verifier. The prover also knows a prime number p and a factorization of n as p*q.
Soundness: Since it is impossible to identify any pair of numbers that correctly factorize n without being aware of its prime factors, the prover is unable to demonstrate knowledge of any p and q that do not do so.
Zero knowledge: The prover only admits that they are aware of a prime number p and its associated factor q, which is already known to the verifier. This is the extent of their knowledge of the prime factors of n. As a result, the prover does not provide any new details regarding n's prime factors.
Types of Proofs of Zero Knowledge
Each zero-knowledge proof has pros and cons. Most zero-knowledge proofs are:
Interactive Zero Knowledge Proofs: The prover and the verifier work together to establish the proof in this sort of zero-knowledge proof. The verifier disputes the prover's assertions after receiving a sequence of messages from the prover. When the evidence has been established, the prover will employ these new problems to generate additional responses.
Non-Interactive Zero Knowledge Proofs: For this kind of zero-knowledge proof, the prover and verifier just need to exchange a single message. Without further interaction between the two parties, the proof is established.
A statistical zero-knowledge proof is one in which the conclusion is reached with a high degree of probability but not with certainty. This indicates that there is a remote possibility that the proof is false, but that this possibility is so remote as to be unimportant.
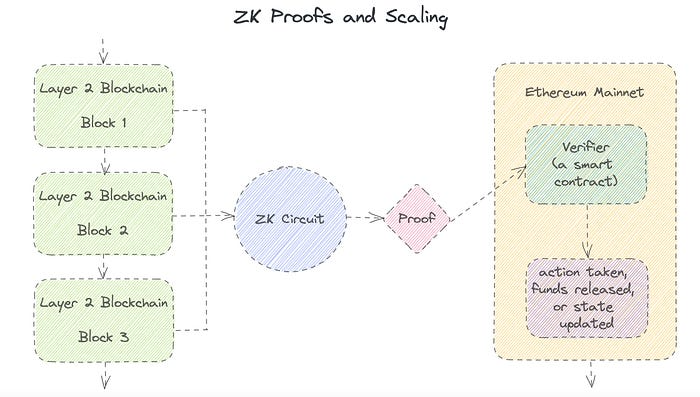
Succinct Non-Interactive Argument of Knowledge (SNARKs): SNARKs are an extremely effective and scalable form of zero-knowledge proof. They are utilized in many different applications, such as machine learning, blockchain technology, and more. Similar to other zero-knowledge proof techniques, SNARKs enable one party—the prover—to demonstrate to another—the verifier—that they are aware of a specific piece of information without disclosing any more information about that information.
The main characteristic of SNARKs is their succinctness, which refers to the fact that the size of the proof is substantially smaller than the amount of the original data being proved. Because to its high efficiency and scalability, SNARKs can be used in a wide range of applications, such as machine learning, blockchain technology, and more.
Uses for Zero Knowledge Proofs
ZKP applications include:
Verifying Identity ZKPs can be used to verify your identity without disclosing any personal information. This has uses in access control, digital signatures, and online authentication.
Proof of Ownership ZKPs can be used to demonstrate ownership of a certain asset without divulging any details about the asset itself. This has uses for protecting intellectual property, managing supply chains, and owning digital assets.
Financial Exchanges Without disclosing any details about the transaction itself, ZKPs can be used to validate financial transactions. Cryptocurrency, internet payments, and other digital financial transactions can all use this.
By enabling parties to make calculations on the data without disclosing the data itself, Data Privacy ZKPs can be used to preserve the privacy of sensitive data. Applications for this can be found in the financial, healthcare, and other sectors that handle sensitive data.
By enabling voters to confirm that their vote was counted without disclosing how they voted, elections ZKPs can be used to ensure the integrity of elections. This is applicable to electronic voting, including internet voting.
Cryptography Modern cryptography's ZKPs are a potent instrument that enable secure communication and authentication. This can be used for encrypted messaging and other purposes in the business sector as well as for military and intelligence operations.
Proofs of Zero Knowledge and Compliance
Kubernetes and regulatory compliance use ZKPs in many ways. Examples:
Security for Kubernetes ZKPs offer a mechanism to authenticate nodes without disclosing any sensitive information, enhancing the security of Kubernetes clusters. ZKPs, for instance, can be used to verify, without disclosing the specifics of the program, that the nodes in a Kubernetes cluster are running permitted software.
Compliance Inspection Without disclosing any sensitive information, ZKPs can be used to demonstrate compliance with rules like the GDPR, HIPAA, and PCI DSS. ZKPs, for instance, can be used to demonstrate that data has been encrypted and stored securely without divulging the specifics of the mechanism employed for either encryption or storage.
Access Management Without disclosing any private data, ZKPs can be used to offer safe access control to Kubernetes resources. ZKPs can be used, for instance, to demonstrate that a user has the necessary permissions to access a particular Kubernetes resource without disclosing the details of those permissions.
Safe Data Exchange Without disclosing any sensitive information, ZKPs can be used to securely transmit data between Kubernetes clusters or between several businesses. ZKPs, for instance, can be used to demonstrate the sharing of a specific piece of data between two parties without disclosing the details of the data itself.
Kubernetes deployments audited Without disclosing the specifics of the deployment or the data being processed, ZKPs can be used to demonstrate that Kubernetes deployments are working as planned. This can be helpful for auditing purposes and for ensuring that Kubernetes deployments are operating as planned.
ZKPs preserve data and maintain regulatory compliance by letting parties prove things without revealing sensitive information. ZKPs will be used more in Kubernetes as it grows.

rekt
4 years ago
LCX is the latest CEX to have suffered a private key exploit.
The attack began around 10:30 PM +UTC on January 8th.
Peckshield spotted it first, then an official announcement came shortly after.
We’ve said it before; if established companies holding millions of dollars of users’ funds can’t manage their own hot wallet security, what purpose do they serve?
The Unique Selling Proposition (USP) of centralised finance grows smaller by the day.
The official incident report states that 7.94M USD were stolen in total, and that deposits and withdrawals to the platform have been paused.
LCX hot wallet: 0x4631018f63d5e31680fb53c11c9e1b11f1503e6f
Hacker’s wallet: 0x165402279f2c081c54b00f0e08812f3fd4560a05
Stolen funds:
- 162.68 ETH (502,671 USD)
- 3,437,783.23 USDC (3,437,783 USD)
- 761,236.94 EURe (864,840 USD)
- 101,249.71 SAND Token (485,995 USD)
- 1,847.65 LINK (48,557 USD)
- 17,251,192.30 LCX Token (2,466,558 USD)
- 669.00 QNT (115,609 USD)
- 4,819.74 ENJ (10,890 USD)
- 4.76 MKR (9,885 USD)
**~$1M worth of $LCX remains in the address, along with 611k EURe which has been frozen by Monerium.
The rest, a total of 1891 ETH (~$6M) was sent to Tornado Cash.**
Why can’t they keep private keys private?
Is it really that difficult for a traditional corporate structure to maintain good practice?
CeFi hacks leave us with little to say - we can only go on what the team chooses to tell us.
Next time, they can write this article themselves.
See below for a template.

CoinTelegraph
4 years ago
2 NFT-based blockchain games that could soar in 2022
NFTs look ready to rule 2022, and the recent pivot toward NFT utility in P2E gaming could make blockchain gaming this year’s sector darling.
After the popularity of decentralized finance (DeFi) came the rise of nonfungible tokens (NFTs), and to the surprise of many, NFTs took the spotlight and now remain front and center with the highest volume in sales occurring at the start of January 2022.
While 2021 became the year of NFTs, GameFi applications did surpass DeFi in terms of user popularity. According to data from DappRadar, Bloomberg gathered:
Nearly 50% of active cryptocurrency wallets connected to decentralized applications in November were for playing games. The percentage of wallets linked to decentralized finance, or DeFi, dapps fell to 45% during the same period, after months of being the leading dapp use case.
Blockchain play-to-earn (P2E) game Axie infinity skyrocketed and kicked off a gaming craze that is expected to continue all throughout 2022. Crypto pundits and gaming advocates have high expectations for P2E blockchain-based games and there’s bound to be a few sleeping giants that will dominate the sector.
Let’s take a look at five blockchain games that could make waves in 2022.
DeFi Kingdoms
The inspiration for DeFi Kingdoms came from simple beginnings — a passion for investing that lured the developers to blockchain technology. DeFi Kingdoms was born as a visualization of liquidity pool investing where in-game ‘gardens’ represent literal and figurative token pairings and liquidity pool mining.
As shown in the game, investors have a portion of their LP share within a plot filled with blooming plants. By attaching the concept of growth to DeFi protocols within a play-and-earn model, DeFi Kingdoms puts a twist on “playing” a game.
Built on the Harmony Network, DeFi Kingdoms became the first project on the network to ever top the DappRadar charts. This could be attributed to an influx of individuals interested in both DeFi and blockchain games or it could be attributed to its recent in-game utility token JEWEL surging.
JEWEL is a utility token that allows users to purchase NFTs in-game buffs to increase a base-level stat. It is also used for liquidity mining to grant users the opportunity to make more JEWEL through staking.
JEWEL is also a governance token that gives holders a vote in the growth and evolution of the project. In the past four months, the token price surged from $1.23 to an all-time high of $22.52. At the time of writing, JEWEL is down by nearly 16%, trading at $19.51.
Surging approximately 1,487% from its humble start of $1.23 four months ago in September, JEWEL token price has increased roughly 165% this last month alone, according to data from CoinGecko.
Guild of Guardians
Guild of Guardians is one of the more anticipated blockchain games in 2022 and it is built on ImmutableX, the first layer-two solution built on Ethereum that focuses on NFTs. Aiming to provide more access, it will operate as a free-to-play mobile role-playing game, modeling the P2E mechanics.
Similar to blockchain games like Axie Infinity, Guild of Guardians in-game assets can be exchanged. The project seems to be of interest to many gamers and investors with its NFT founder sale and token launch generating nearly $10 million in volume.
Launching its in-game token in October of 2021, the Guild of Guardians (GOG) tokens are ERC-20 tokens known as ‘gems’ inside the game. Gems are what power key features in the game such as minting in-game NFTs and interacting with the marketplace, and are available to earn while playing.
For the last month, the Guild of Guardians token has performed rather steadily after spiking to its all-time high of $2.81 after its launch. Despite the token being down over 50% from its all-time high, at the time of writing, some members of the community are looking forward to the possibility of staking and liquidity pools, which are features that tend to help stabilize token prices.
You might also like

Ezra Reguerra
3 years ago
Yuga Labs’ Otherdeeds NFT mint triggers backlash from community
Unhappy community members accuse Yuga Labs of fraud, manipulation, and favoritism over Otherdeeds NFT mint.
Following the Otherdeeds NFT mint, disgruntled community members took to Twitter to criticize Yuga Labs' handling of the event.
Otherdeeds NFTs were a huge hit with the community, selling out almost instantly. Due to high demand, the launch increased Ethereum gas fees from 2.6 ETH to 5 ETH.
But the event displeased many people. Several users speculated that the mint was “planned to fail” so the group could advertise launching its own blockchain, as the team mentioned a chain migration in one tweet.
Others like Mark Beylin tweeted that he had "sold out" on all Ape-related NFT investments after Yuga Labs "revealed their true colors." Beylin also advised others to assume Yuga Labs' owners are “bad actors.”
Some users who failed to complete transactions claim they lost ETH. However, Yuga Labs promised to refund lost gas fees.
CryptoFinally, a Twitter user, claimed Yuga Labs gave BAYC members better land than non-members. Others who wanted to participate paid for shittier land, while BAYCS got the only worthwhile land.
The Otherdeed NFT drop also increased Ethereum's burn rate. Glassnode and Data Always reported nearly 70,000 ETH burned on mint day.

Neeramitra Reddy
3 years ago
The best life advice I've ever heard could very well come from 50 Cent.
He built a $40M hip-hop empire from street drug dealing.
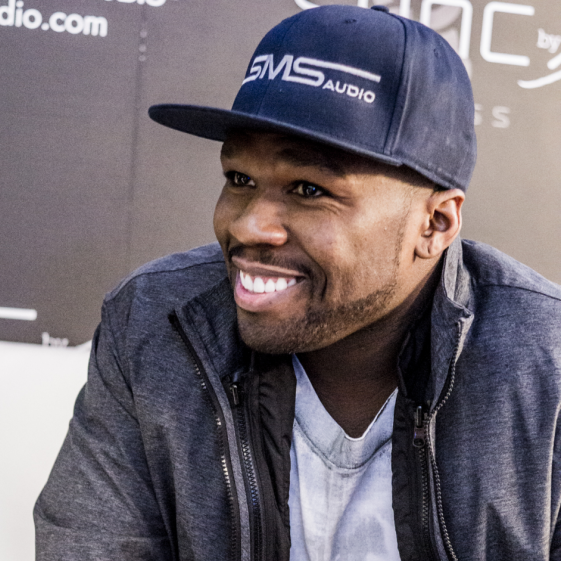
50 Cent was nearly killed by 9mm bullets.
Before 50 Cent, Curtis Jackson sold drugs.
He sold coke to worried addicts after being orphaned at 8.
Pursuing police. Murderous hustlers and gangs. Unwitting informers.
Despite his hard life, his hip-hop career was a success.
An assassination attempt ended his career at the start.
What sane producer would want to deal with a man entrenched in crime?
Most would have drowned in self-pity and drank themselves to death.
But 50 Cent isn't most people. Life on the streets had given him fearlessness.
“Having a brush with death, or being reminded in a dramatic way of the shortness of our lives, can have a positive, therapeutic effect. So it is best to make every moment count, to have a sense of urgency about life.” ― 50 Cent, The 50th Law
50 released a series of mixtapes that caught Eminem's attention and earned him a $50 million deal!
50 Cents turned death into life.
Things happen; that is life.
We want problems solved.
Every human has problems, whether it's Jeff Bezos swimming in his billions, Obama in his comfortable retirement home, or Dan Bilzerian with his hired bikini models.
All problems.
Problems churn through life. solve one, another appears.
It's harsh. Life's unfair. We can face reality or run from it.
The latter will worsen your issues.
“The firmer your grasp on reality, the more power you will have to alter it for your purposes.” — 50 Cent, The 50th Law
In a fantasy-obsessed world, 50 Cent loves reality.
Wish for better problem-solving skills rather than problem-free living.
Don't wish, work.
We All Have the True Power of Alchemy
Humans are arrogant enough to think the universe cares about them.
That things happen as if the universe notices our nanosecond existences.
Things simply happen. Period.
By changing our perspective, we can turn good things bad.
The alchemists' search for the philosopher's stone may have symbolized the ability to turn our lead-like perceptions into gold.
Negativity bias tints our perceptions.
Normal sparring broke your elbow? Rest and rethink your training. Fired? You can improve your skills and get a better job.
Consider Curtis if he had fallen into despair.
The legend we call 50 Cent wouldn’t have existed.
The Best Lesson in Life Ever?
Neither avoid nor fear your reality.
That simple sentence contains every self-help tip and life lesson on Earth.
When reality is all there is, why fear it? avoidance?
Or worse, fleeing?
To accept reality, we must eliminate the words should be, could be, wish it were, and hope it will be.
It is. Period.
Only by accepting reality's chaos can you shape your life.
“Behind me is infinite power. Before me is endless possibility, around me is boundless opportunity. My strength is mental, physical and spiritual.” — 50 Cent

1eth1da
3 years ago
6 Rules to build a successful NFT Community in 2022

Too much NFT, Discord, and shitposting.
How do you choose?
How do you recruit more members to join your NFT project?
In 2021, a successful NFT project required:
Monkey/ape artwork
Twitter and Discord bot-filled
Roadmap overpromise
Goal was quick cash.
2022 and the years after will change that.
These are 6 Rules for a Strong NFT Community in 2022:
THINK LONG TERM
This relates to roadmap planning. Hype and dumb luck may drive NFT projects (ahem, goblins) but rarely will your project soar.
Instead, consider sustainability.
Plan your roadmap based on your team's abilities.
Do what you're already doing, but with NFTs, make it bigger and better.
You shouldn't copy a project's roadmap just because it was profitable.
This will lead to over-promising, team burnout, and an RUG NFT project.
OFFER VALUE
Building a great community starts with giving.
Why are musicians popular?
Because they offer entertainment for everyone, a random person becomes a fan, and more fans become a cult.
That's how you should approach your community.
TEAM UP
A great team helps.
An NFT project could have 3 or 2 people.
Credibility trumps team size.
Make sure your team can answer community questions, resolve issues, and constantly attend to them.
Don't overwork and burn out.
Your community will be able to recognize that you are trying too hard and give up on the project.
BUILD A GREAT PRODUCT
Bored Ape Yacht Club altered the NFT space.
Cryptopunks transformed NFTs.
Many others did, including Okay Bears.
What made them that way?
Because they answered a key question.
What is my NFT supposed to be?
Before planning art, this question must be answered.
NFTs can't be just jpegs.
What does it represent?
Is it a Metaverse-ready project?
What blockchain are you going to be using and why?
Set some ground rules for yourself. This helps your project's direction.
These questions will help you and your team set a direction for blockchain, NFT, and Web3 technology.
EDUCATE ON WEB3
The more the team learns about Web3 technology, the more they can offer their community.
Think tokens, metaverse, cross-chain interoperability and more.
BUILD A GREAT COMMUNITY
Several projects mistreat their communities.
They treat their community like "customers" and try to sell them NFT.
Providing Whitelists and giveaways aren't your only community-building options.
Think bigger.
Consider them family and friends, not wallets.
Consider them fans.
These are some tips to start your NFT project.