


How a $300K Bored Ape Yacht Club NFT was accidentally sold for $3K
The Bored Ape Yacht Club is one of the most prestigious NFT collections in the world. A collection of 10,000 NFTs, each depicting an ape with different traits and visual attributes, Jimmy Fallon, Steph Curry and Post Malone are among their star-studded owners. Right now the price of entry is 52 ether, or $210,000.
Which is why it's so painful to see that someone accidentally sold their Bored Ape NFT for $3,066.
Unusual trades are often a sign of funny business, as in the case of the person who spent $530 million to buy an NFT from themselves. In Saturday's case, the cause was a simple, devastating "fat-finger error." That's when people make a trade online for the wrong thing, or for the wrong amount. Here the owner, real name Max or username maxnaut, meant to list his Bored Ape for 75 ether, or around $300,000. Instead he accidentally listed it for 0.75. One hundredth the intended price.
It was bought instantaneously. The buyer paid an extra $34,000 to speed up the transaction, ensuring no one could snap it up before them. The Bored Ape was then promptly listed for $248,000. The transaction appears to have been done by a bot, which can be coded to immediately buy NFTs listed below a certain price on behalf of their owners in order to take advantage of these exact situations.
"How'd it happen? A lapse of concentration I guess," Max told me. "I list a lot of items every day and just wasn't paying attention properly. I instantly saw the error as my finger clicked the mouse but a bot sent a transaction with over 8 eth [$34,000] of gas fees so it was instantly sniped before I could click cancel, and just like that, $250k was gone."
"And here within the beauty of the Blockchain you can see that it is both honest and unforgiving," he added.
Fat finger trades happen sporadically in traditional finance -- like the Japanese trader who almost bought 57% of Toyota's stock in 2014 -- but most financial institutions will stop those transactions if alerted quickly enough. Since cryptocurrency and NFTs are designed to be decentralized, you essentially have to rely on the goodwill of the buyer to reverse the transaction.
Fat finger errors in cryptocurrency trades have made many a headline over the past few years. Back in 2019, the company behind Tether, a cryptocurrency pegged to the US dollar, nearly doubled its own coin supply when it accidentally created $5 billion-worth of new coins. In March, BlockFi meant to send 700 Gemini Dollars to a set of customers, worth roughly $1 each, but mistakenly sent out millions of dollars worth of bitcoin instead. Last month a company erroneously paid a $24 million fee on a $100,000 transaction.
Similar incidents are increasingly being seen in NFTs, now that many collections have accumulated in market value over the past year. Last month someone tried selling a CryptoPunk NFT for $19 million, but accidentally listed it for $19,000 instead. Back in August, someone fat finger listed their Bored Ape for $26,000, an error that someone else immediately capitalized on. The original owner offered $50,000 to the buyer to return the Bored Ape -- but instead the opportunistic buyer sold it for the then-market price of $150,000.
"The industry is so new, bad things are going to happen whether it's your fault or the tech," Max said. "Once you no longer have control of the outcome, forget and move on."
The Bored Ape Yacht Club launched back in April 2021, with 10,000 NFTs being sold for 0.08 ether each -- about $190 at the time. While NFTs are often associated with individual digital art pieces, collections like the Bored Ape Yacht Club, which allow owners to flaunt their NFTs by using them as profile pictures on social media, are becoming increasingly prevalent. The Bored Ape Yacht Club has since become the second biggest NFT collection in the world, second only to CryptoPunks, which launched in 2017 and is considered the "original" NFT collection.
More on Web3 & Crypto

Ryan Weeks
3 years ago
Terra fiasco raises TRON's stablecoin backstop
After Terra's algorithmic stablecoin collapsed in May, TRON announced a plan to increase the capital backing its own stablecoin.
USDD, a near-carbon copy of Terra's UST, arrived on the TRON blockchain on May 5. TRON founder Justin Sun says USDD will be overcollateralized after initially being pegged algorithmically to the US dollar.
A reserve of cryptocurrencies and stablecoins will be kept at 130 percent of total USDD issuance, he said. TRON described the collateral ratio as "guaranteed" and said it would begin publishing real-time updates on June 5.
Currently, the reserve contains 14,040 bitcoin (around $418 million), 140 million USDT, 1.9 billion TRX, and 8.29 billion TRX in a burning contract.
Sun: "We want to hybridize USDD." We have an algorithmic stablecoin and TRON DAO Reserve.
algorithmic failure
USDD was designed to incentivize arbitrageurs to keep its price pegged to the US dollar by trading TRX, TRON's token, and USDD. Like Terra, TRON signaled its intent to establish a bitcoin and cryptocurrency reserve to support USDD in extreme market conditions.
Still, Terra's UST failed despite these safeguards. The stablecoin veered sharply away from its dollar peg in mid-May, bringing down Terra's LUNA and wiping out $40 billion in value in days. In a frantic attempt to restore the peg, billions of dollars in bitcoin were sold and unprecedented volumes of LUNA were issued.
Sun believes USDD, which has a total circulating supply of $667 million, can be backed up.
"Our reserve backing is diversified." Bitcoin and stablecoins are included. USDC will be a small part of Circle's reserve, he said.
TRON's news release lists the reserve's assets as bitcoin, TRX, USDC, USDT, TUSD, and USDJ.
All Bitcoin addresses will be signed so everyone knows they belong to us, Sun said.
Not giving in
Sun told that the crypto industry needs "decentralized" stablecoins that regulators can't touch.
Sun said the Luna Foundation Guard, a Singapore-based non-profit that raised billions in cryptocurrency to buttress UST, mismanaged the situation by trying to sell to panicked investors.
He said, "We must be ahead of the market." We want to stabilize the market and reduce volatility.
Currently, TRON finances most of its reserve directly, but Sun says the company hopes to add external capital soon.
Before its demise, UST holders could park the stablecoin in Terra's lending platform Anchor Protocol to earn 20% interest, which many deemed unsustainable. TRON's JustLend is similar. Sun hopes to raise annual interest rates from 17.67% to "around 30%."
This post is a summary. Read full article here

Franz Schrepf
3 years ago
What I Wish I'd Known About Web3 Before Building
Cryptoland rollercoaster

I've lost money in crypto.
Unimportant.
The real issue: I didn’t understand how.
I'm surrounded with winners. To learn more, I created my own NFTs, currency, and DAO.
Web3 is a hilltop castle. Everything is valuable, decentralized, and on-chain.
The castle is Disneyland: beautiful in images, but chaotic with lengthy lines and kids spending too much money on dressed-up animals.
When the throng and businesses are gone, Disneyland still has enchantment.

The Real Story of Web3
NFTs
Scarcity. Scarce NFTs. That's their worth.
Skull. Rare-looking!
Nonsense.
Bored Ape Yacht Club vs. my NFTs?
Marketing.
BAYC is amazing, but not for the reasons people believe. Apecoin and Otherside's art, celebrity following, and innovation? Stunning.
No other endeavor captured the zeitgeist better. Yet how long did you think it took to actually mint the NFTs?
1 hour? Maybe a week for the website?
Minting NFTs is incredibly easy. Kid-friendly. Developers are rare. Think about that next time somebody posts “DevS dO SMt!?”
NFTs will remain popular. These projects are like our Van Goghs and Monets. Still, be wary. It still uses exclusivity and wash selling like the OG art market.
Not all NFTs are art-related.
Soulbound and anonymous NFTs could offer up new use cases. Property rights, privacy-focused ID, open-source project verification. Everything.
NFTs build online trust through ownership.
We just need to evolve from the apes first.
NFTs' superpower is marketing until then.
Crypto currency
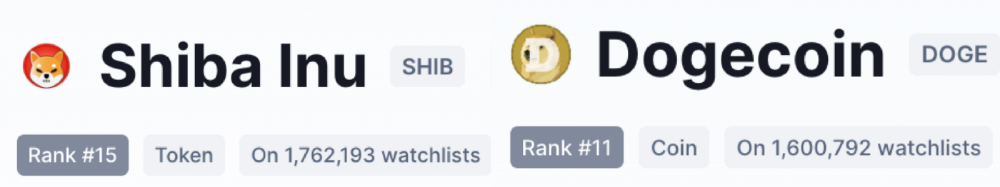
What the hell is a token?
99% of people are clueless.
So I invested in both coins and tokens. Same same. Only that they are not.
Coins have their own blockchain and developer/validator community. It's hard.
Creating a token on top of a blockchain? Five minutes.
Most consumers don’t understand the difference, creating an arbitrage opportunity: pretend you’re a serious project without having developers on your payroll.
Few market sites help. Take a look. See any tokens?
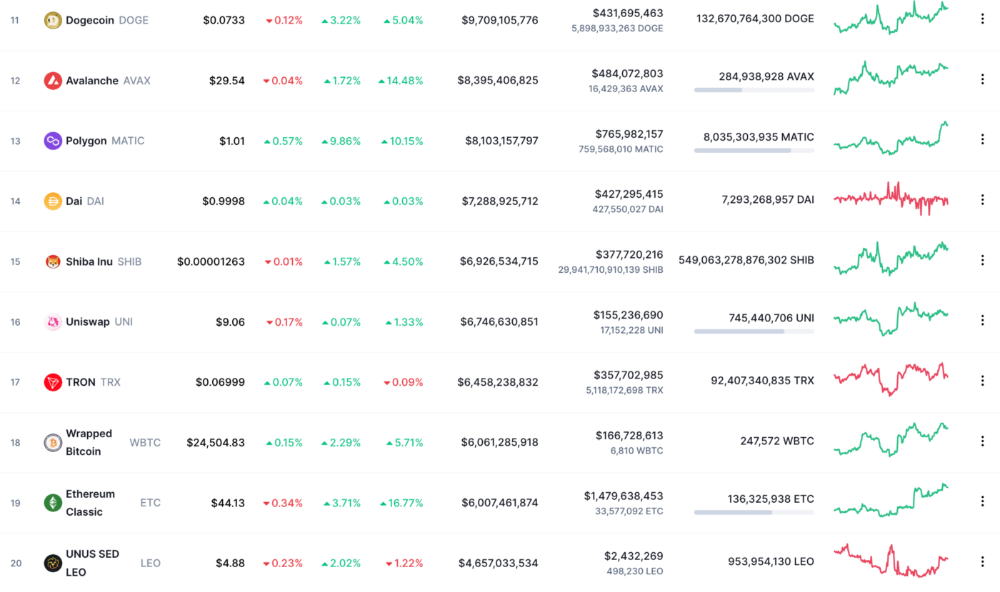
There's a hint one click deeper.
Some tokens are legitimate. Some coins are bad investments.
Tokens are utilized for DAO governance and DApp payments. Still, know who's behind a token. They might be 12 years old.
Coins take time and money. The recent LUNA meltdown indicates that currency investing requires research.
DAOs
Decentralized Autonomous Organizations (DAOs) don't work as you assume.
Yes, members can vote.
A productive organization requires more.
I've observed two types of DAOs.
Total decentralization total dysfunction
Centralized just partially. Community-driven.
A core team executes the DAO's strategy and roadmap in successful DAOs. The community owns part of the organization, votes on decisions, and holds the team accountable.
DAOs are public companies.
Amazing.
A shareholder meeting's logistics are staggering. DAOs may hold anonymous, secure voting quickly. No need for intermediaries like banks to chase up every shareholder.
Successful DAOs aren't totally decentralized. Large-scale voting and collaboration have never been easier.
And that’s all that matters.
Scale, speed.
My Web3 learnings
Disneyland is enchanting. Web3 too.
In a few cycles, NFTs may be used to build trust, not clout. Not speculating with coins. DAOs run organizations, not themselves.
Finally, some final thoughts:
NFTs will be a very helpful tool for building trust online. NFTs are successful now because of excellent marketing.
Tokens are not the same as coins. Look into any project before making a purchase. Make sure it isn't run by three 9-year-olds piled on top of one another in a trench coat, at the very least.
Not entirely decentralized, DAOs. We shall see a future where community ownership becomes the rule rather than the exception once we acknowledge this fact.
Crypto Disneyland is a rollercoaster with loops that make you sick.
Always buckle up.
Have fun!

Scott Hickmann
4 years ago
YouTube
This is a YouTube video:
You might also like

Aparna Jain
3 years ago
Negative Effects of Working for a FAANG Company
Consider yourself lucky if your last FAANG interview was rejected.

FAANG—Facebook, Apple, Amazon, Netflix, Google
(I know its manga now, but watch me not care)
These big companies offer many benefits.
large salaries and benefits
Prestige
high expectations for both you and your coworkers.
However, these jobs may have major drawbacks that only become apparent when you're thrown to the wolves, so it's up to you whether you see them as drawbacks or opportunities.
I know most college graduates start working at big tech companies because of their perceived coolness.
I've worked in these companies for years and can tell you what to expect if you get a job here.
Little fish in a vast ocean
The most obvious. Most billion/trillion-dollar companies employ thousands.
You may work on a small, unnoticed product part.
Directors and higher will sometimes make you redo projects they didn't communicate well without respecting your time, talent, or will to work on trivial stuff that doesn't move company needles.
Peers will only say, "Someone has to take out the trash," even though you know company resources are being wasted.
The power imbalance is frustrating.
What you can do about it
Know your WHY. Consider long-term priorities. Though riskier, I stayed in customer-facing teams because I loved building user-facing products.
This increased my impact. However, if you enjoy helping coworkers build products, you may be better suited for an internal team.
I told the Directors and Vice Presidents that their actions could waste Engineering time, even though it was unpopular. Some were receptive, some not.
I kept having tough conversations because they were good for me and the company.
However, some of my coworkers praised my candor but said they'd rather follow the boss.
An outdated piece of technology can take years to update.
Apple introduced Swift for iOS development in 2014. Most large tech companies adopted the new language after five years.
This is frustrating if you want to learn new skills and increase your market value.
Knowing that my lack of Swift practice could hurt me if I changed jobs made writing verbose Objective C painful.
What you can do about it
Work on the new technology in side projects; one engineer rewrote the Lyft app in Swift over the course of a weekend and promoted its adoption throughout the entire organization.
To integrate new technologies and determine how to combine legacy and modern code, suggest minor changes to the existing codebase.
Most managers spend their entire day in consecutive meetings.
After their last meeting, the last thing they want is another meeting to discuss your career goals.
Sometimes a manager has 15-20 reports, making it hard to communicate your impact.
Misunderstandings and stress can result.
Especially when the manager should focus on selfish parts of the team. Success won't concern them.
What you can do about it
Tell your manager that you are a self-starter and that you will pro-actively update them on your progress, especially if they aren't present at the meetings you regularly attend.
Keep being proactive and look for mentorship elsewhere if you believe your boss doesn't have enough time to work on your career goals.
Alternately, look for a team where the manager has more authority to assist you in making career decisions.
After a certain point, company loyalty can become quite harmful.
Because big tech companies create brand loyalty, too many colleagues stayed in unhealthy environments.
When you work for a well-known company and strangers compliment you, it's fun to tell your friends.
Work defines you. This can make you stay too long even though your career isn't progressing and you're unhappy.
Google may become your surname.
Workplaces are not families.
If you're unhappy, don't stay just because they gave you the paycheck to buy your first home and make you feel like you owe your life to them.
Many employees stayed too long. Though depressed and suicidal.
What you can do about it
Your life is not worth a company.
Do you want your job title and workplace to be listed on your gravestone? If not, leave if conditions deteriorate.
Recognize that change can be challenging. It's difficult to leave a job you've held for a number of years.
Ask those who have experienced this change how they handled it.
You still have a bright future if you were rejected from FAANG interviews.
Rejections only lead to amazing opportunities. If you're young and childless, work for a startup.
Companies may pay more than FAANGs. Do your research.
Ask recruiters and hiring managers tough questions about how the company and teams prioritize respectful working hours and boundaries for workers.
I know many 15-year-olds who have a lifelong dream of working at Google, and it saddens me that they're chasing a name on their resume instead of excellence.
This article is not meant to discourage you from working at these companies, but to share my experience about what HR/managers will never mention in interviews.
Read both sides before signing the big offer letter.

Sammy Abdullah
3 years ago
Payouts to founders at IPO
How much do startup founders make after an IPO? We looked at 2018's major tech IPOs. Paydays aren't what founders took home at the IPO (shares are normally locked up for 6 months), but what they were worth at the IPO price on the day the firm went public. It's not cash, but it's nice. Here's the data.
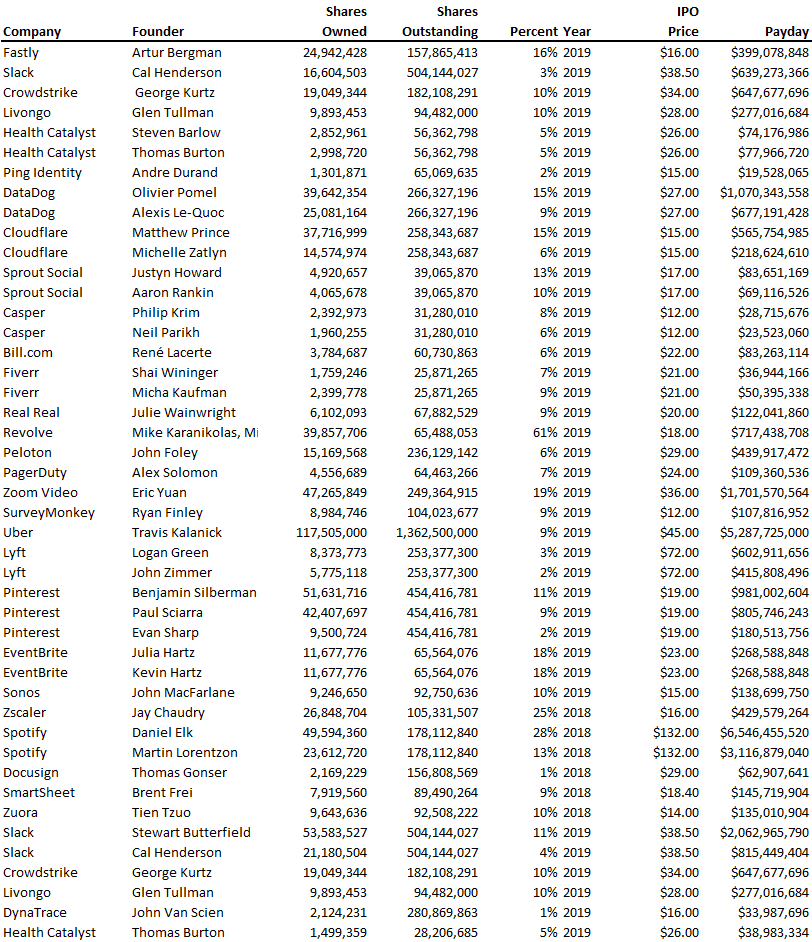
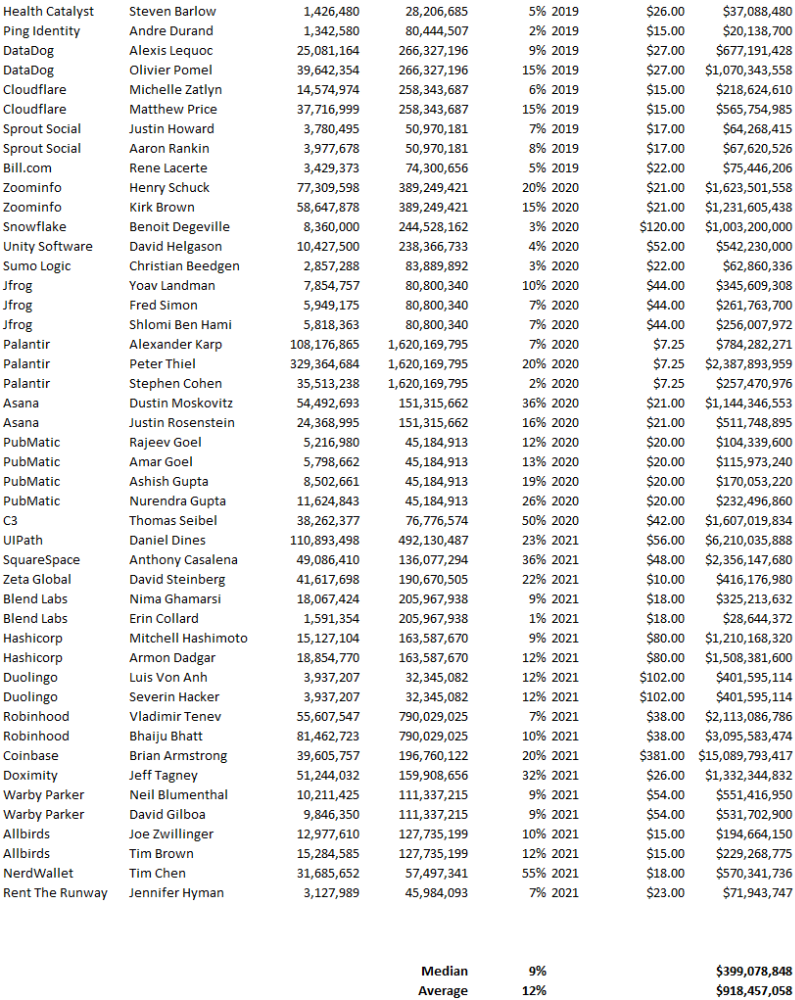
Several points are noteworthy.
Huge payoffs. Median and average pay were $399m and $918m. Average and median homeownership were 9% and 12%.
Coinbase, Uber, UI Path. Uber, Zoom, Spotify, UI Path, and Coinbase founders raised billions. Zoom's founder owned 19% and Spotify's 28% and 13%. Brian Armstrong controlled 20% of Coinbase at IPO and was worth $15bn. Preserving as much equity as possible by staying cash-efficient or raising at high valuations also helps.
The smallest was Ping. Ping's compensation was the smallest. Andre Duand owned 2% but was worth $20m at IPO. That's less than some billion-dollar paydays, but still good.
IPOs can be lucrative, as you can see. Preserving equity could be the difference between a $20mm and $15bln payday (Coinbase).

Alex Mathers
3 years ago
400 articles later, nobody bothered to read them.

Writing for readers:
14 years of daily writing.
I post practically everything on social media. I authored hundreds of articles, thousands of tweets, and numerous volumes to almost no one.
Tens of thousands of readers regularly praise me.
I despised writing. I'm stuck now.
I've learned what readers like and what doesn't.
Here are some essential guidelines for writing with impact:
Readers won't understand your work if you can't.
Though obvious, this slipped me up. Share your truths.
Stories engage human brains.
Showing the journey of a person from worm to butterfly inspires the human spirit.
Overthinking hinders powerful writing.
The best ideas come from inner understanding in between thoughts.
Avoid writing to find it. Write.
Writing a masterpiece isn't motivating.
Write for five minutes to simplify. Step-by-step, entertaining, easy steps.
Good writing requires a willingness to make mistakes.
So write loads of garbage that you can edit into a good piece.
Courageous writing.
A courageous story will move readers. Personal experience is best.
Go where few dare.
Templates, outlines, and boundaries help.
Limitations enhance writing.
Excellent writing is straightforward and readable, removing all the unnecessary fat.
Use five words instead of nine.
Use ordinary words instead of uncommon ones.
Readers desire relatability.
Too much perfection will turn it off.
Write to solve an issue if you can't think of anything to write.
Instead, read to inspire. Best authors read.
Every tweet, thread, and novel must have a central idea.
What's its point?
This can make writing confusing.
️ Don't direct your reader.
Readers quit reading. Demonstrate, describe, and relate.
Even if no one responds, have fun. If you hate writing it, the reader will too.