


More on Entrepreneurship/Creators

DC Palter
3 years ago
How Will You Generate $100 Million in Revenue? The Startup Business Plan
A top-down company plan facilitates decision-making and impresses investors.

A startup business plan starts with the product, the target customers, how to reach them, and how to grow the business.
Bottom-up is terrific unless venture investors fund it.
If it can prove how it can exceed $100M in sales, investors will invest. If not, the business may be wonderful, but it's not venture capital-investable.
As a rule, venture investors only fund firms that expect to reach $100M within 5 years.
Investors get nothing until an acquisition or IPO. To make up for 90% of failed investments and still generate 20% annual returns, portfolio successes must exit with a 25x return. A $20M-valued company must be acquired for $500M or more.
This requires $100M in sales (or being on a nearly vertical trajectory to get there). The company has 5 years to attain that milestone and create the requisite ROI.
This motivates venture investors (venture funds and angel investors) to hunt for $100M firms within 5 years. When you pitch investors, you outline how you'll achieve that aim.
I'm wary of pitches after seeing a million hockey sticks predicting $5M to $100M in year 5 that never materialized. Doubtful.
Startups fail because they don't have enough clients, not because they don't produce a great product. That jump from $5M to $100M never happens. The company reaches $5M or $10M, growing at 10% or 20% per year. That's great, but not enough for a $500 million deal.
Once it becomes clear the company won’t reach orbit, investors write it off as a loss. When a corporation runs out of money, it's shut down or sold in a fire sale. The company can survive if expenses are trimmed to match revenues, but investors lose everything.
When I hear a pitch, I'm not looking for bright income projections but a viable plan to achieve them. Answer these questions in your pitch.
Is the market size sufficient to generate $100 million in revenue?
Will the initial beachhead market serve as a springboard to the larger market or as quicksand that hinders progress?
What marketing plan will bring in $100 million in revenue? Is the market diffuse and will cost millions of dollars in advertising, or is it one, focused market that can be tackled with a team of salespeople?
Will the business be able to bridge the gap from a small but fervent set of early adopters to a larger user base and avoid lock-in with their current solution?
Will the team be able to manage a $100 million company with hundreds of people, or will hypergrowth force the organization to collapse into chaos?
Once the company starts stealing market share from the industry giants, how will it deter copycats?
The requirement to reach $100M may be onerous, but it provides a context for difficult decisions: What should the product be? Where should we concentrate? who should we hire? Every strategic choice must consider how to reach $100M in 5 years.
Focusing on $100M streamlines investor pitches. Instead of explaining everything, focus on how you'll attain $100M.
As an investor, I know I'll lose my money if the startup doesn't reach this milestone, so the revenue prediction is the first thing I look at in a pitch deck.
Reaching the $100M goal needs to be the first thing the entrepreneur thinks about when putting together the business plan, the central story of the pitch, and the criteria for every important decision the company makes.

Aaron Dinin, PhD
3 years ago
There Are Two Types of Entrepreneurs in the World Make sure you are aware of your type!
Know why it's important.

The entrepreneur I was meeting with said, "I should be doing crypto, or maybe AI? Aren't those the hot spots? I should look there for a startup idea.”
I shook my head. Yes, they're exciting, but that doesn't mean they're best for you and your business.
“There are different types of entrepreneurs?” he asked.
I said "obviously." Two types, actually. Knowing what type of entrepreneur you are helps you build the right startup.
The two types of businesspeople
The best way for me to describe the two types of entrepreneurs is to start by telling you exactly the kinds of entrepreneurial opportunities I never get excited about: future opportunities.
In the early 1990s, my older brother showed me the World Wide Web and urged me to use it. Unimpressed, I returned to my Super Nintendo.
My roommate tried to get me to join Facebook as a senior in college. I remember thinking, This is dumb. Who'll use it?
In 2011, my best friend tried to convince me to buy bitcoin and I laughed.
Heck, a couple of years ago I had to buy a new car, and I never even considered buying something that didn’t require fossilized dinosaur bones.
I'm no visionary. I don't anticipate the future. I focus on the present.
This tendency makes me a problem-solving entrepreneur. I identify entrepreneurial opportunities by spotting flaws and/or inefficiencies in the world and devising solutions.
There are other ways to find business opportunities. Visionary entrepreneurs also exist. I don't mean visionary in the hyperbolic sense that implies world-changing impact. I mean visionary as an entrepreneur who identifies future technological shifts that will change how people work and live and create new markets.
Problem-solving and visionary entrepreneurs are equally good. But the two approaches to building companies are very different. Knowing the type of entrepreneur you are will help you build a startup that fits your worldview.
What is the distinction?
Let's use some simple hypotheticals to compare problem-solving and visionary entrepreneurship.
Imagine a city office building without nearby restaurants. Those office workers love to eat. Sometimes they'd rather eat out than pack a lunch. As an entrepreneur, you can solve the lack of nearby restaurants. You'd open a restaurant near that office, say a pizza parlor, and get customers because you solved the lack of nearby restaurants. Problem-solving entrepreneurship.
Imagine a new office building in a developing area with no residents or workers. In this scenario, a large office building is coming. The workers will need to eat then. As a visionary entrepreneur, you're excited about the new market and decide to open a pizzeria near the construction to meet demand.
Both possibilities involve the same product. You opened a pizzeria. How you launched that pizza restaurant and what will affect its success are different.
Why is the distinction important?
Let's say you opened a pizzeria near an office. You'll probably get customers. Because people are nearby and demand isn't being met, someone from a nearby building will stop in within the first few days of your pizzeria's grand opening. This makes solving the problem relatively risk-free. You'll get customers unless you're a fool.
The market you're targeting existed before you entered it, so you're not guaranteed success. This means people in that market solved the lack of nearby restaurants. Those office workers are used to bringing their own lunches. Why should your restaurant change their habits? Even when they eat out, they're used to traveling far. They've likely developed pizza preferences.
To be successful with your problem-solving startup, you must convince consumers to change their behavior, which is difficult.
Unlike opening a pizza restaurant near a construction site. Once the building opens, workers won't have many preferences or standardized food-getting practices. Your pizza restaurant can become the incumbent quickly. You'll be the first restaurant in the area, so you'll gain a devoted following that makes your food a routine.
Great, right? It's easier than changing people's behavior. The benefit comes with a risk. Opening a pizza restaurant near a construction site increases future risk. What if builders run out of money? No one moves in? What if the building's occupants are the National Association of Pizza Haters? Then you've opened a pizza restaurant next to pizza haters.
Which kind of businessperson are you?
This isn't to say one type of entrepreneur is better than another. Each type of entrepreneurship requires different skills.
As my simple examples show, a problem-solving entrepreneur must operate in markets with established behaviors and habits. To be successful, you must be able to teach a market a new way of doing things.
Conversely, the challenge of being a visionary entrepreneur is that you have to be good at predicting the future and getting in front of that future before other people.
Both are difficult in different ways. So, smart entrepreneurs don't just chase opportunities. Smart entrepreneurs pursue opportunities that match their skill sets.

Sammy Abdullah
3 years ago
SaaS payback period data
It's ok and even desired to be unprofitable if you're gaining revenue at a reasonable cost and have 100%+ net dollar retention, meaning you never lose customers and expand them. To estimate the acceptable cost of new SaaS revenue, we compare new revenue to operating loss and payback period. If you pay back the customer acquisition cost in 1.5 years and never lose them (100%+ NDR), you're doing well.
To evaluate payback period, we compared new revenue to net operating loss for the last 73 SaaS companies to IPO since October 2017. (55 out of 73). Here's the data. 1/(new revenue/operating loss) equals payback period. New revenue/operating loss equals cost of new revenue.
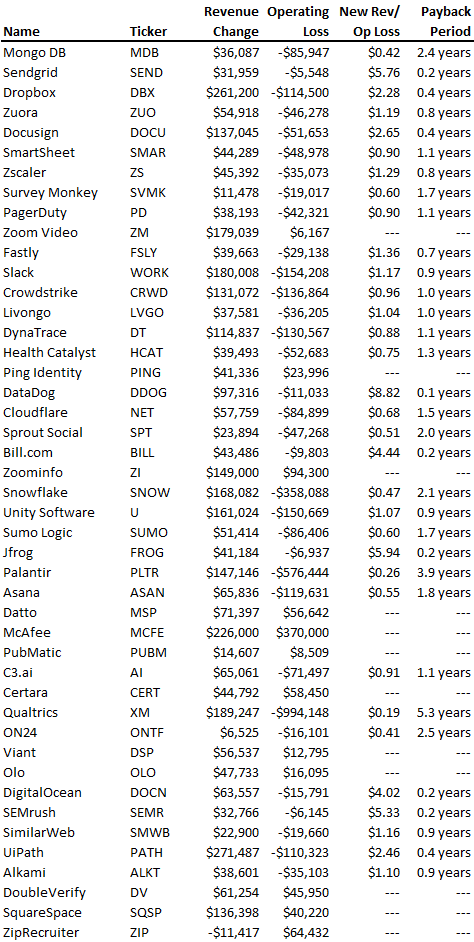
Payback averages a year. 55 SaaS companies that weren't profitable at IPO got a 1-year payback. Outstanding. If you pay for a customer in a year and never lose them (100%+ NDR), you're establishing a valuable business. The average was 1.3 years, which is within the 1.5-year range.
New revenue costs $0.96 on average. These SaaS companies lost $0.96 every $1 of new revenue last year. Again, impressive. Average new revenue per operating loss was $1.59.
Loss-in-operations definition. Operating loss revenue COGS S&M R&D G&A (technical point: be sure to use the absolute value of operating loss). It's wrong to only consider S&M costs and ignore other business costs. Operating loss and new revenue are measured over one year to eliminate seasonality.
Operating losses are desirable if you never lose a customer and have a quick payback period, especially when SaaS enterprises are valued on ARR. The payback period should be under 1.5 years, the cost of new income < $1, and net dollar retention 100%.
You might also like

Guillaume Dumortier
2 years ago
Mastering the Art of Rhetoric: A Guide to Rhetorical Devices in Successful Headlines and Titles
Unleash the power of persuasion and captivate your audience with compelling headlines.
As the old adage goes, "You never get a second chance to make a first impression."
In the world of content creation and social ads, headlines and titles play a critical role in making that first impression.
A well-crafted headline can make the difference between an article being read or ignored, a video being clicked on or bypassed, or a product being purchased or passed over.
To make an impact with your headlines, mastering the art of rhetoric is essential. In this post, we'll explore various rhetorical devices and techniques that can help you create headlines that captivate your audience and drive engagement.
tl;dr : Headline Magician will help you craft the ultimate headline titles powered by rhetoric devices
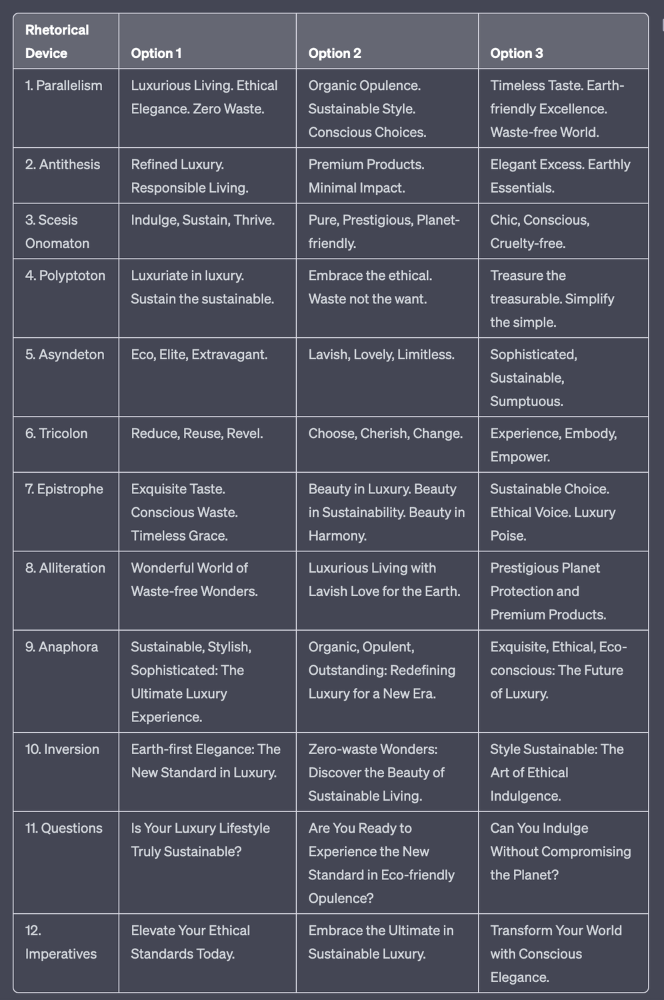
Example with a high-end luxury organic zero-waste skincare brand
✍️ The Power of Alliteration
Alliteration is the repetition of the same consonant sound at the beginning of words in close proximity. This rhetorical device lends itself well to headlines, as it creates a memorable, rhythmic quality that can catch a reader's attention.
By using alliteration, you can make your headlines more engaging and easier to remember.
Examples:
"Crafting Compelling Content: A Comprehensive Course"
"Mastering the Art of Memorable Marketing"
🔁 The Appeal of Anaphora
Anaphora is the repetition of a word or phrase at the beginning of successive clauses. This rhetorical device emphasizes a particular idea or theme, making it more memorable and persuasive.
In headlines, anaphora can be used to create a sense of unity and coherence, which can draw readers in and pique their interest.
Examples:
"Create, Curate, Captivate: Your Guide to Social Media Success"
"Innovation, Inspiration, and Insight: The Future of AI"
🔄 The Intrigue of Inversion
Inversion is a rhetorical device where the normal order of words is reversed, often to create an emphasis or achieve a specific effect.
In headlines, inversion can generate curiosity and surprise, compelling readers to explore further.
Examples:
"Beneath the Surface: A Deep Dive into Ocean Conservation"
"Beyond the Stars: The Quest for Extraterrestrial Life"
⚖️ The Persuasive Power of Parallelism
Parallelism is a rhetorical device that involves using similar grammatical structures or patterns to create a sense of balance and symmetry.
In headlines, parallelism can make your message more memorable and impactful, as it creates a pleasing rhythm and flow that can resonate with readers.
Examples:
"Eat Well, Live Well, Be Well: The Ultimate Guide to Wellness"
"Learn, Lead, and Launch: A Blueprint for Entrepreneurial Success"
⏭️ The Emphasis of Ellipsis
Ellipsis is the omission of words, typically indicated by three periods (...), which suggests that there is more to the story.
In headlines, ellipses can create a sense of mystery and intrigue, enticing readers to click and discover what lies behind the headline.
Examples:
"The Secret to Success... Revealed"
"Unlocking the Power of Your Mind... A Step-by-Step Guide"
🎭 The Drama of Hyperbole
Hyperbole is a rhetorical device that involves exaggeration for emphasis or effect.
In headlines, hyperbole can grab the reader's attention by making bold, provocative claims that stand out from the competition. Be cautious with hyperbole, however, as overuse or excessive exaggeration can damage your credibility.
Examples:
"The Ultimate Guide to Mastering Any Skill in Record Time"
"Discover the Revolutionary Technique That Will Transform Your Life"
❓The Curiosity of Questions
Posing questions in your headlines can be an effective way to pique the reader's curiosity and encourage engagement.
Questions compel the reader to seek answers, making them more likely to click on your content. Additionally, questions can create a sense of connection between the content creator and the audience, fostering a sense of dialogue and discussion.
Examples:
"Are You Making These Common Mistakes in Your Marketing Strategy?"
"What's the Secret to Unlocking Your Creative Potential?"
💥 The Impact of Imperatives
Imperatives are commands or instructions that urge the reader to take action. By using imperatives in your headlines, you can create a sense of urgency and importance, making your content more compelling and actionable.
Examples:
"Master Your Time Management Skills Today"
"Transform Your Business with These Innovative Strategies"
💢 The Emotion of Exclamations
Exclamations are powerful rhetorical devices that can evoke strong emotions and convey a sense of excitement or urgency.
Including exclamations in your headlines can make them more attention-grabbing and shareable, increasing the chances of your content being read and circulated.
Examples:
"Unlock Your True Potential: Find Your Passion and Thrive!"
"Experience the Adventure of a Lifetime: Travel the World on a Budget!"
🎀 The Effectiveness of Euphemisms
Euphemisms are polite or indirect expressions used in place of harsher, more direct language.
In headlines, euphemisms can make your message more appealing and relatable, helping to soften potentially controversial or sensitive topics.
Examples:
"Navigating the Challenges of Modern Parenting"
"Redefining Success in a Fast-Paced World"
⚡Antithesis: The Power of Opposites
Antithesis involves placing two opposite words side-by-side, emphasizing their contrasts. This device can create a sense of tension and intrigue in headlines.
Examples:
"Once a day. Every day"
"Soft on skin. Kill germs"
"Mega power. Mini size."
To utilize antithesis, identify two opposing concepts related to your content and present them in a balanced manner.
🎨 Scesis Onomaton: The Art of Verbless Copy
Scesis onomaton is a rhetorical device that involves writing verbless copy, which quickens the pace and adds emphasis.
Example:
"7 days. 7 dollars. Full access."
To use scesis onomaton, remove verbs and focus on the essential elements of your headline.
🌟 Polyptoton: The Charm of Shared Roots
Polyptoton is the repeated use of words that share the same root, bewitching words into memorable phrases.
Examples:
"Real bread isn't made in factories. It's baked in bakeries"
"Lose your knack for losing things."
To employ polyptoton, identify words with shared roots that are relevant to your content.
✨ Asyndeton: The Elegance of Omission
Asyndeton involves the intentional omission of conjunctions, adding crispness, conviction, and elegance to your headlines.
Examples:
"You, Me, Sushi?"
"All the latte art, none of the environmental impact."
To use asyndeton, eliminate conjunctions and focus on the core message of your headline.
🔮 Tricolon: The Magic of Threes
Tricolon is a rhetorical device that uses the power of three, creating memorable and impactful headlines.
Examples:
"Show it, say it, send it"
"Eat Well, Live Well, Be Well."
To use tricolon, craft a headline with three key elements that emphasize your content's main message.
🔔 Epistrophe: The Chime of Repetition
Epistrophe involves the repetition of words or phrases at the end of successive clauses, adding a chime to your headlines.
Examples:
"Catch it. Bin it. Kill it."
"Joint friendly. Climate friendly. Family friendly."
To employ epistrophe, repeat a key phrase or word at the end of each clause.

DANIEL CLERY
3 years ago
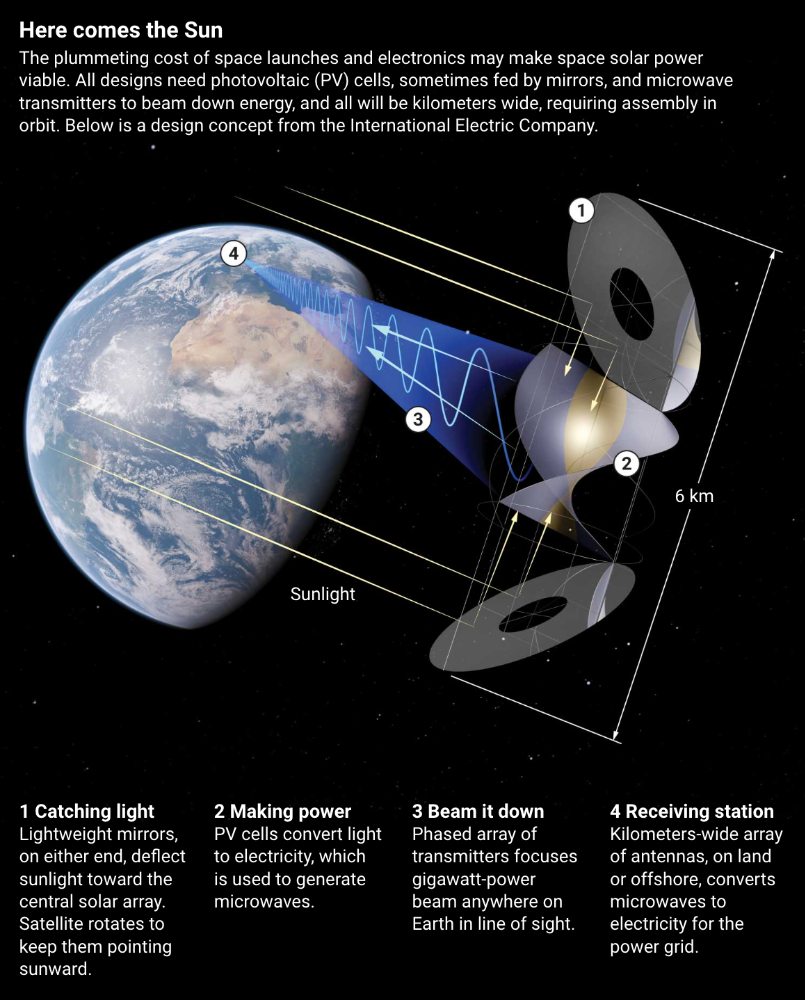
Can space-based solar power solve Earth's energy problems?
Better technology and lower launch costs revive science-fiction tech.
Airbus engineers showed off sustainable energy's future in Munich last month. They captured sunlight with solar panels, turned it into microwaves, and beamed it into an airplane hangar, where it lighted a city model. The test delivered 2 kW across 36 meters, but it posed a serious question: Should we send enormous satellites to capture solar energy in space? In orbit, free of clouds and nighttime, they could create power 24/7 and send it to Earth.
Airbus engineer Jean-Dominique Coste calls it an engineering problem. “But it’s never been done at [large] scale.”
Proponents of space solar power say the demand for green energy, cheaper space access, and improved technology might change that. Once someone invests commercially, it will grow. Former NASA researcher John Mankins says it might be a trillion-dollar industry.
Myriad uncertainties remain, including whether beaming gigawatts of power to Earth can be done efficiently and without burning birds or people. Concept papers are being replaced with ground and space testing. The European Space Agency (ESA), which supported the Munich demo, will propose ground tests to member nations next month. The U.K. government offered £6 million to evaluate innovations this year. Chinese, Japanese, South Korean, and U.S. agencies are working. NASA policy analyst Nikolai Joseph, author of an upcoming assessment, thinks the conversation's tone has altered. What formerly appeared unattainable may now be a matter of "bringing it all together"
NASA studied space solar power during the mid-1970s fuel crunch. A projected space demonstration trip using 1970s technology would have cost $1 trillion. According to Mankins, the idea is taboo in the agency.
Space and solar power technology have evolved. Photovoltaic (PV) solar cell efficiency has increased 25% over the past decade, Jones claims. Telecoms use microwave transmitters and receivers. Robots designed to repair and refuel spacecraft might create solar panels.
Falling launch costs have boosted the idea. A solar power satellite large enough to replace a nuclear or coal plant would require hundreds of launches. ESA scientist Sanjay Vijendran: "It would require a massive construction complex in orbit."
SpaceX has made the idea more plausible. A SpaceX Falcon 9 rocket costs $2600 per kilogram, less than 5% of what the Space Shuttle did, and the company promised $10 per kilogram for its giant Starship, slated to launch this year. Jones: "It changes the equation." "Economics rules"
Mass production reduces space hardware costs. Satellites are one-offs made with pricey space-rated parts. Mars rover Perseverance cost $2 million per kilogram. SpaceX's Starlink satellites cost less than $1000 per kilogram. This strategy may work for massive space buildings consisting of many identical low-cost components, Mankins has long contended. Low-cost launches and "hypermodularity" make space solar power economical, he claims.
Better engineering can improve economics. Coste says Airbus's Munich trial was 5% efficient, comparing solar input to electricity production. When the Sun shines, ground-based solar arrays perform better. Studies show space solar might compete with existing energy sources on price if it reaches 20% efficiency.
Lighter parts reduce costs. "Sandwich panels" with PV cells on one side, electronics in the middle, and a microwave transmitter on the other could help. Thousands of them build a solar satellite without heavy wiring to move power. In 2020, a team from the U.S. Naval Research Laboratory (NRL) flew on the Air Force's X-37B space plane.
NRL project head Paul Jaffe said the satellite is still providing data. The panel converts solar power into microwaves at 8% efficiency, but not to Earth. The Air Force expects to test a beaming sandwich panel next year. MIT will launch its prototype panel with SpaceX in December.
As a satellite orbits, the PV side of sandwich panels sometimes faces away from the Sun since the microwave side must always face Earth. To maintain 24-hour power, a satellite needs mirrors to keep that side illuminated and focus light on the PV. In a 2012 NASA study by Mankins, a bowl-shaped device with thousands of thin-film mirrors focuses light onto the PV array.
International Electric Company's Ian Cash has a new strategy. His proposed satellite uses enormous, fixed mirrors to redirect light onto a PV and microwave array while the structure spins (see graphic, above). 1 billion minuscule perpendicular antennas act as a "phased array" to electronically guide the beam toward Earth, regardless of the satellite's orientation. This design, argues Cash, is "the most competitive economically"
If a space-based power plant ever flies, its power must be delivered securely and efficiently. Jaffe's team at NRL just beamed 1.6 kW over 1 km, and teams in Japan, China, and South Korea have comparable attempts. Transmitters and receivers lose half their input power. Vijendran says space solar beaming needs 75% efficiency, "preferably 90%."
Beaming gigawatts through the atmosphere demands testing. Most designs aim to produce a beam kilometers wide so every ship, plane, human, or bird that strays into it only receives a tiny—hopefully harmless—portion of the 2-gigawatt transmission. Receiving antennas are cheap to build but require a lot of land, adds Jones. You could grow crops under them or place them offshore.
Europe's public agencies currently prioritize space solar power. Jones: "There's a devotion you don't see in the U.S." ESA commissioned two solar cost/benefit studies last year. Vijendran claims it might match ground-based renewables' cost. Even at a higher price, equivalent to nuclear, its 24/7 availability would make it competitive.
ESA will urge member states in November to fund a technical assessment. If the news is good, the agency will plan for 2025. With €15 billion to €20 billion, ESA may launch a megawatt-scale demonstration facility by 2030 and a gigawatt-scale facility by 2040. "Moonshot"

Frederick M. Hess
2 years ago
The Lessons of the Last Two Decades for Education Reform
My colleague Ilana Ovental and I examined pandemic media coverage of education at the end of last year. That analysis examined coverage changes. We tracked K-12 topic attention over the previous two decades using Lexis Nexis. See the results here.
I was struck by how cleanly the past two decades can be divided up into three (or three and a half) eras of school reform—a framing that can help us comprehend where we are and how we got here. In a time when epidemic, political unrest, frenetic news cycles, and culture war can make six months seem like a lifetime, it's worth pausing for context.
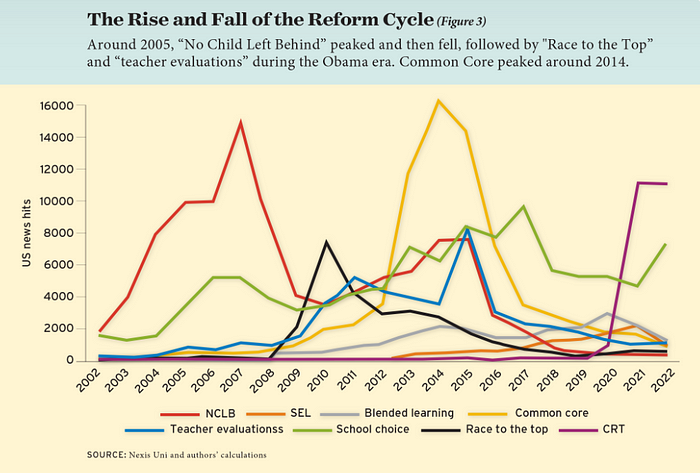
If you look at the peaks in the above graph, the 21st century looks to be divided into periods. The decade-long rise and fall of No Child Left Behind began during the Bush administration. In a few years, NCLB became the dominant K-12 framework. Advocates and financiers discussed achievement gaps and measured success with AYP.
NCLB collapsed under the weight of rigorous testing, high-stakes accountability, and a race to the bottom by the Obama years. Obama's Race to the Top garnered attention, but its most controversial component, the Common Core State Standards, rose quickly.
Academic standards replaced assessment and accountability. New math, fiction, and standards were hotly debated. Reformers and funders chanted worldwide benchmarking and systems interoperability.
We went from federally driven testing and accountability to government encouraged/subsidized/mandated (pick your verb) reading and math standardization. Last year, Checker Finn and I wrote The End of School Reform? The 2010s populist wave thwarted these objectives. The Tea Party, Occupy Wall Street, Black Lives Matter, and Trump/MAGA all attacked established institutions.
Consequently, once the Common Core fell, no alternative program emerged. Instead, school choice—the policy most aligned with populist suspicion of institutional power—reached a half-peak. This was less a case of choice erupting to prominence than of continuous growth in a vacuum. Even with Betsy DeVos' determined, controversial efforts, school choice received only half the media attention that NCLB and Common Core did at their heights.
Recently, culture clash-fueled attention to race-based curriculum and pedagogy has exploded (all playing out under the banner of critical race theory). This third, culture war-driven wave may not last as long as the other waves.
Even though I don't understand it, the move from slow-building policy debate to fast cultural confrontation over two decades is notable. I don't know if it's cyclical or permanent, or if it's about schooling, media, public discourse, or all three.
One final thought: After doing this work for decades, I've noticed how smoothly advocacy groups, associations, and other activists adapt to the zeitgeist. In 2007, mission statements focused on accomplishment disparities. Five years later, they promoted standardization. Language has changed again.
Part of this is unavoidable and healthy. Chasing currents can also make companies look unprincipled, promote scepticism, and keep them spinning the wheel. Bearing in mind that these tides ebb and flow may give educators, leaders, and activists more confidence to hold onto their values and pause when they feel compelled to follow the crowd.