
NFT was used to serve a restraining order on an anonymous hacker.
The international law firm Holland & Knight used an NFT built and airdropped by its asset recovery team to serve a defendant in a hacking case.
The law firms Holland & Knight and Bluestone used a nonfungible token to serve a defendant in a hacking case with a temporary restraining order, marking the first documented legal process assisted by an NFT.
The so-called "service token" or "service NFT" was served to an unknown defendant in a hacking case involving LCX, a cryptocurrency exchange based in Liechtenstein that was hacked for over $8 million in January. The attack compromised the platform's hot wallets, resulting in the loss of Ether (ETH), USD Coin (USDC), and other cryptocurrencies, according to Cointelegraph at the time.
On June 7, LCX claimed that around 60% of the stolen cash had been frozen, with investigations ongoing in Liechtenstein, Ireland, Spain, and the United States. Based on a court judgment from the New York Supreme Court, Centre Consortium, a company created by USDC issuer Circle and crypto exchange Coinbase, has frozen around $1.3 million in USDC.
The monies were laundered through Tornado Cash, according to LCX, but were later tracked using "algorithmic forensic analysis." The organization was also able to identify wallets linked to the hacker as a result of the investigation.
In light of these findings, the law firms representing LCX, Holland & Knight and Bluestone, served the unnamed defendant with a temporary restraining order issued on-chain using an NFT. According to LCX, this system "was allowed by the New York Supreme Court and is an example of how innovation can bring legitimacy and transparency to a market that some say is ungovernable."
More on Web3 & Crypto

Nitin Sharma
3 years ago
Web3 Terminology You Should Know
The easiest online explanation.

Web3 is growing. Crypto companies are growing.
Instagram, Adidas, and Stripe adopted cryptocurrency.
Bitcoin and other cryptocurrencies made web3 famous.
Most don't know where to start. Cryptocurrency, DeFi, etc. are investments.
Since we don't understand web3, I'll help you today.
Let’s go.
1. Web3
It is the third generation of the web, and it is built on the decentralization idea which means no one can control it.
There are static webpages that we can only read on the first generation of the web (i.e. Web 1.0).
Web 2.0 websites are interactive. Twitter, Medium, and YouTube.
Each generation controlled the website owner. Simply put, the owner can block us. However, data breaches and selling user data to other companies are issues.
They can influence the audience's mind since they have control.
Assume Twitter's CEO endorses Donald Trump. Result? Twitter would have promoted Donald Trump with tweets and graphics, enhancing his chances of winning.
We need a decentralized, uncontrollable system.
And then there’s Web3.0 to consider. As Bitcoin and Ethereum values climb, so has its popularity. Web3.0 is uncontrolled web evolution. It's good and bad.
Dapps, DeFi, and DAOs are here. It'll all be explained afterwards.
2. Cryptocurrencies:
No need to elaborate.
Bitcoin, Ethereum, Cardano, and Dogecoin are cryptocurrencies. It's digital money used for payments and other uses.
Programs must interact with cryptocurrencies.
3. Blockchain:
Blockchain facilitates bitcoin transactions, investments, and earnings.
This technology governs Web3. It underpins the web3 environment.
Let us delve much deeper.
Blockchain is simple. However, the name expresses the meaning.
Blockchain is a chain of blocks.
Let's use an image if you don't understand.
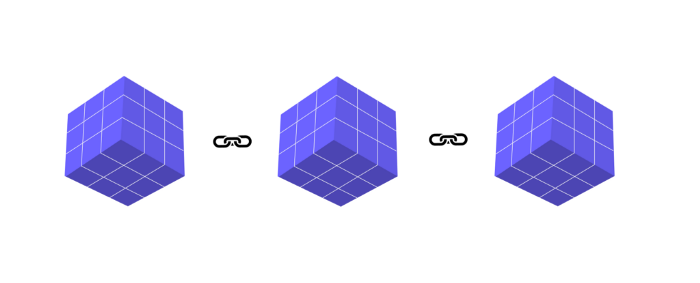
The graphic above explains blockchain. Think Blockchain. The block stores related data.
Here's more.
4. Smart contracts
Programmers and developers must write programs. Smart contracts are these blockchain apps.
That’s reasonable.
Decentralized web3.0 requires immutable smart contracts or programs.
5. NFTs
Blockchain art is NFT. Non-Fungible Tokens.
Explaining Non-Fungible Token may help.
Two sorts of tokens:
These tokens are fungible, meaning they can be changed. Think of Bitcoin or cash. The token won't change if you sell one Bitcoin and acquire another.
Non-Fungible Token: Since these tokens cannot be exchanged, they are exclusive. For instance, music, painting, and so forth.
Right now, Companies and even individuals are currently developing worthless NFTs.
The concept of NFTs is much improved when properly handled.
6. Dapp
Decentralized apps are Dapps. Instagram, Twitter, and Medium apps in the same way that there is a lot of decentralized blockchain app.
Curve, Yearn Finance, OpenSea, Axie Infinity, etc. are dapps.
7. DAOs
DAOs are member-owned and governed.
Consider it a company with a core group of contributors.
8. DeFi
We all utilize centrally regulated financial services. We fund these banks.
If you have $10,000 in your bank account, the bank can invest it and retain the majority of the profits.
We only get a penny back. Some banks offer poor returns. To secure a loan, we must trust the bank, divulge our information, and fill out lots of paperwork.
DeFi was built for such issues.
Decentralized banks are uncontrolled. Staking, liquidity, yield farming, and more can earn you money.
Web3 beginners should start with these resources.

OnChain Wizard
3 years ago
How to make a >800 million dollars in crypto attacking the once 3rd largest stablecoin, Soros style
Everyone is talking about the $UST attack right now, including Janet Yellen. But no one is talking about how much money the attacker made (or how brilliant it was). Lets dig in.
Our story starts in late March, when the Luna Foundation Guard (or LFG) starts buying BTC to help back $UST. LFG started accumulating BTC on 3/22, and by March 26th had a $1bn+ BTC position. This is leg #1 that made this trade (or attack) brilliant.
The second leg comes in the form of the 4pool Frax announcement for $UST on April 1st. This added the second leg needed to help execute the strategy in a capital efficient way (liquidity will be lower and then the attack is on).
We don't know when the attacker borrowed 100k BTC to start the position, other than that it was sold into Kwon's buying (still speculation). LFG bought 15k BTC between March 27th and April 11th, so lets just take the average price between these dates ($42k).
So you have a ~$4.2bn short position built. Over the same time, the attacker builds a $1bn OTC position in $UST. The stage is now set to create a run on the bank and get paid on your BTC short. In anticipation of the 4pool, LFG initially removes $150mm from 3pool liquidity.
The liquidity was pulled on 5/8 and then the attacker uses $350mm of UST to drain curve liquidity (and LFG pulls another $100mm of liquidity).
But this only starts the de-pegging (down to 0.972 at the lows). LFG begins selling $BTC to defend the peg, causing downward pressure on BTC while the run on $UST was just getting started.
With the Curve liquidity drained, the attacker used the remainder of their $1b OTC $UST position ($650mm or so) to start offloading on Binance. As withdrawals from Anchor turned from concern into panic, this caused a real de-peg as people fled for the exits
So LFG is selling $BTC to restore the peg while the attacker is selling $UST on Binance. Eventually the chain gets congested and the CEXs suspend withdrawals of $UST, fueling the bank run panic. $UST de-pegs to 60c at the bottom, while $BTC bleeds out.
The crypto community panics as they wonder how much $BTC will be sold to keep the peg. There are liquidations across the board and LUNA pukes because of its redemption mechanism (the attacker very well could have shorted LUNA as well). BTC fell 25% from $42k on 4/11 to $31.3k
So how much did our attacker make? There aren't details on where they covered obviously, but if they are able to cover (or buy back) the entire position at ~$32k, that means they made $952mm on the short.
On the $350mm of $UST curve dumps I don't think they took much of a loss, lets assume 3% or just $11m. And lets assume that all the Binance dumps were done at 80c, thats another $125mm cost of doing business. For a grand total profit of $815mm (bf borrow cost).
BTC was the perfect playground for the trade, as the liquidity was there to pull it off. While having LFG involved in BTC, and foreseeing they would sell to keep the peg (and prevent LUNA from dying) was the kicker.
Lastly, the liquidity being low on 3pool in advance of 4pool allowed the attacker to drain it with only $350mm, causing the broader panic in both BTC and $UST. Any shorts on LUNA would've added a lot of P&L here as well, with it falling -65% since 5/7.
And for the reply guys, yes I know a lot of this involves some speculation & assumptions. But a lot of money was made here either way, and I thought it would be cool to dive into how they did it.

Yusuf Ibrahim
4 years ago
How to sell 10,000 NFTs on OpenSea for FREE (Puppeteer/NodeJS)
So you've finished your NFT collection and are ready to sell it. Except you can't figure out how to mint them! Not sure about smart contracts or want to avoid rising gas prices. You've tried and failed with apps like Mini mouse macro, and you're not familiar with Selenium/Python. Worry no more, NodeJS and Puppeteer have arrived!
Learn how to automatically post and sell all 1000 of my AI-generated word NFTs (Nakahana) on OpenSea for FREE!
My NFT project — Nakahana |
NOTE: Only NFTs on the Polygon blockchain can be sold for free; Ethereum requires an initiation charge. NFTs can still be bought with (wrapped) ETH.
If you want to go right into the code, here's the GitHub link: https://github.com/Yusu-f/nftuploader
Let's start with the knowledge and tools you'll need.
What you should know
You must be able to write and run simple NodeJS programs. You must also know how to utilize a Metamask wallet.
Tools needed
- NodeJS. You'll need NodeJs to run the script and NPM to install the dependencies.
- Puppeteer – Use Puppeteer to automate your browser and go to sleep while your computer works.
- Metamask – Create a crypto wallet and sign transactions using Metamask (free). You may learn how to utilize Metamask here.
- Chrome – Puppeteer supports Chrome.
Let's get started now!
Starting Out
Clone Github Repo to your local machine. Make sure that NodeJS, Chrome, and Metamask are all installed and working. Navigate to the project folder and execute npm install. This installs all requirements.
Replace the “extension path” variable with the Metamask chrome extension path. Read this tutorial to find the path.
Substitute an array containing your NFT names and metadata for the “arr” variable and the “collection_name” variable with your collection’s name.
Run the script.
After that, run node nftuploader.js.
Open a new chrome instance (not chromium) and Metamask in it. Import your Opensea wallet using your Secret Recovery Phrase or create a new one and link it. The script will be unable to continue after this but don’t worry, it’s all part of the plan.
Next steps
Open your terminal again and copy the route that starts with “ws”, e.g. “ws:/localhost:53634/devtools/browser/c07cb303-c84d-430d-af06-dd599cf2a94f”. Replace the path in the connect function of the nftuploader.js script.
const browser = await puppeteer.connect({ browserWSEndpoint: "ws://localhost:58533/devtools/browser/d09307b4-7a75-40f6-8dff-07a71bfff9b3", defaultViewport: null });
Rerun node nftuploader.js. A second tab should open in THE SAME chrome instance, navigating to your Opensea collection. Your NFTs should now start uploading one after the other! If any errors occur, the NFTs and errors are logged in an errors.log file.
Error Handling
The errors.log file should show the name of the NFTs and the error type. The script has been changed to allow you to simply check if an NFT has already been posted. Simply set the “searchBeforeUpload” setting to true.
We're done!
If you liked it, you can buy one of my NFTs! If you have any concerns or would need a feature added, please let me know.
Thank you to everyone who has read and liked. I never expected it to be so popular.
You might also like

Tim Denning
3 years ago
Elon Musk’s Rich Life Is a Nightmare
I'm sure you haven't read about Elon's other side.
Elon divorced badly.
Nobody's surprised.
Imagine you're a parent. Someone isn't home year-round. What's next?
That’s what happened to YOLO Elon.
He can do anything. He can intervene in wars, shoot his mouth off, bang anyone he wants, avoid tax, make cool tech, buy anything his ego desires, and live anywhere exotic.
Few know his billionaire backstory. I'll tell you so you don't worship his lifestyle. It’s a cult.
Only his career succeeds. His life is a nightmare otherwise.
Psychopaths' schedule
Elon has said he works 120-hour weeks.
As he told the reporter about his job, he choked up, which was unusual for him.
His crazy workload and lack of sleep forced him to scold innocent Wall Street analysts. Later, he apologized.
In the same interview, he admits he hadn't taken more than a week off since 2001, when he was bedridden with malaria. Elon stays home after a near-death experience.
He's rarely outside.
Elon says he sometimes works 3 or 4 days straight.
He admits his crazy work schedule has cost him time with his kids and friends.
Elon's a slave
Elon's birthday description made him emotional.
Elon worked his entire birthday.
"No friends, nothing," he said, stuttering.
His brother's wedding in Catalonia was 48 hours after his birthday. That meant flying there from Tesla's factory prison.
He arrived two hours before the big moment, barely enough time to eat and change, let alone see his brother.
Elon had to leave after the bouquet was tossed to a crowd of billionaire lovers. He missed his brother's first dance with his wife.
Shocking.
He went straight to Tesla's prison.
The looming health crisis
Elon was asked if overworking affected his health.
Not great. Friends are worried.
Now you know why Elon tweets dumb things. Working so hard has probably caused him mental health issues.
Mental illness removed my reality filter. You do stupid things because you're tired.
Astronauts pelted Elon
Elon's overwork isn't the first time his life has made him emotional.
When asked about Neil Armstrong and Gene Cernan criticizing his SpaceX missions, he got emotional. Elon's heroes.
They're why he started the company, and they mocked his work. In another interview, we see how Elon’s business obsession has knifed him in the heart.
Once you have a company, you must feed, nurse, and care for it, even if it destroys you.
"Yep," Elon says, tearing up.
In the same interview, he's asked how Tesla survived the 2008 recession. Elon stopped the interview because he was crying. When Tesla and SpaceX filed for bankruptcy in 2008, he nearly had a nervous breakdown. He called them his "children."
All the time, he's risking everything.
Jack Raines explains best:
Too much money makes you a slave to your net worth.
Elon's emotions are admirable. It's one of the few times he seems human, not like an alien Cyborg.
Stop idealizing Elon's lifestyle
Building a side business that becomes a billion-dollar unicorn startup is a nightmare.
"Billionaire" means financially wealthy but otherwise broke. A rich life includes more than business and money.
This post is a summary. Read full article here
Gill Pratt
4 years ago
War's Human Cost
War's Human Cost
I didn't start crying until I was outside a McDonald's in an Olempin, Poland rest area on highway S17.
Children pick toys at a refugee center, Olempin, Poland, March 4, 2022.
Refugee children, mostly alone with their mothers, but occasionally with a gray-haired grandfather or non-Ukrainian father, were coaxed into picking a toy from boxes provided by a kind-hearted company and volunteers.
I went to Warsaw to continue my research on my family's history during the Holocaust. In light of the ongoing Ukrainian conflict, I asked former colleagues in the US Department of Defense and Intelligence Community if it was safe to travel there. They said yes, as Poland was a NATO member.
I stayed in a hotel in the Warsaw Ghetto, where 90% of my mother's family was murdered in the Holocaust. Across the street was the first Warsaw Judenrat. It was two blocks away from the apartment building my mother's family had owned and lived in, now dilapidated and empty.
Building of my great-grandfather, December 2021.
A mass grave of thousands of rocks for those killed in the Warsaw Ghetto, I didn't cry when I touched its cold walls.
Warsaw Jewish Cemetery, 200,000–300,000 graves.
Mass grave, Warsaw Jewish Cemetery.
My mother's family had two homes, one in Warszawa and the rural one was a forest and sawmill complex in Western Ukraine. For the past half-year, a local Ukrainian historian had been helping me discover faint traces of her family’s life there — in fact, he had found some people still alive who remembered the sawmill and that it belonged to my mother’s grandfather. The historian was good at his job, and we had become close.
My historian friend, December 2021, talking to a Ukrainian.
With war raging, my second trip to Warsaw took on a different mission. To see his daughter and one-year-old grandson, I drove east instead of to Ukraine. They had crossed the border shortly after the war began, leaving men behind, and were now staying with a friend on Poland's eastern border.
I entered after walking up to the house and settling with the dog. The grandson greeted me with a huge smile and the Ukrainian word for “daddy,” “Tato!” But it was clear he was awaiting his real father's arrival, and any man he met would be so tentatively named.
After a few moments, the boy realized I was only a stranger. He had musical talent, like his mother and grandfather, both piano teachers, as he danced to YouTube videos of American children's songs dubbed in Ukrainian, picking the ones he liked and crying when he didn't.
Songs chosen by my historian friend's grandson, March 4, 2022
He had enough music and began crying regardless of the song. His mother picked him up and started nursing him, saying she was worried about him. She had no idea where she would live or how she would survive outside Ukraine. She showed me her father's family history of losses in the Holocaust, which matched my own research.
After an hour of drinking tea and trying to speak of hope, I left for the 3.5-hour drive west to Warsaw.
It was unlike my drive east. It was reminiscent of the household goods-filled carts pulled by horses and people fleeing war 80 years ago.
Jewish refugees relocating, USHMM Holocaust Encyclopaedia, 1939.
The carefully chosen trinkets by children to distract them from awareness of what is really happening and the anxiety of what lies ahead, made me cry despite all my research on the Holocaust. There is no way for them to communicate with their mothers, who are worried, absent, and without their fathers.
It's easy to see war as a contest of nations' armies, weapons, and land. The most costly aspect of war is its psychological toll. My father screamed in his sleep from nightmares of his own adolescent trauma in Warsaw 80 years ago.
Survivor father studying engineering, 1961.
In the airport, I waited to return home while Ukrainian public address systems announced refugee assistance. Like at McDonald's, many mothers were alone with their children, waiting for a flight to distant relatives.
That's when I had my worst trip experience.
A woman near me, clearly a refugee, answered her phone, cried out, and began wailing.
The human cost of war descended like a hammer, and I realized that while I was going home, she never would

Scott Hickmann
3 years ago Draft
This is a draft

My wallpape