


More on Entrepreneurship/Creators

Greg Lim
3 years ago
How I made $160,000 from non-fiction books
I've sold over 40,000 non-fiction books on Amazon and made over $160,000 in six years while writing on the side.
I have a full-time job and three young sons; I can't spend 40 hours a week writing. This article describes my journey.
I write mainly tech books:
Thanks to my readers, many wrote positive evaluations. Several are bestsellers.
A few have been adopted by universities as textbooks:
My books' passive income allows me more time with my family.
Knowing I could quit my job and write full time gave me more confidence. And I find purpose in my work (i am in christian ministry).
I'm always eager to write. When work is a dread or something bad happens, writing gives me energy. Writing isn't scary. In fact, I can’t stop myself from writing!
Writing has also established my tech authority. Universities use my books, as I've said. Traditional publishers have asked me to write books.
These mindsets helped me become a successful nonfiction author:
1. You don’t have to be an Authority
Yes, I have computer science experience. But I'm no expert on my topics. Before authoring "Beginning Node.js, Express & MongoDB," my most profitable book, I had no experience with those topics. Node was a new server-side technology for me. Would that stop me from writing a book? It can. I liked learning a new technology. So I read the top three Node books, took the top online courses, and put them into my own book (which makes me know more than 90 percent of people already).
I didn't have to worry about using too much jargon because I was learning as I wrote. An expert forgets a beginner's hardship.
"The fellow learner can aid more than the master since he knows less," says C.S. Lewis. The problem he must explain is recent. The expert has forgotten.”
2. Solve a micro-problem (Niching down)
I didn't set out to write a definitive handbook. I found a market with several challenges and wrote one book. Ex:
- Instead of web development, what about web development using Angular?
- Instead of Blockchain, what about Blockchain using Solidity and React?
- Instead of cooking recipes, how about a recipe for a specific kind of diet?
- Instead of Learning math, what about Learning Singapore Math?
3. Piggy Backing Trends
The above topics may still be a competitive market. E.g. Angular, React. To stand out, include the latest technologies or trends in your book. Learn iOS 15 instead of iOS programming. Instead of personal finance, what about personal finance with NFTs.
Even though you're a newbie author, your topic is well-known.
4. Publish short books
My books are known for being direct. Many people like this:
Your reader will appreciate you cutting out the fluff and getting to the good stuff. A reader can finish and review your book.
Second, short books are easier to write. Instead of creating a 500-page book for $50 (which few will buy), write a 100-page book that answers a subset of the problem and sell it for less. (You make less, but that's another subject). At least it got published instead of languishing. Less time spent creating a book means less time wasted if it fails. Write a small-bets book portfolio like Daniel Vassallo!
Third, it's $2.99-$9.99 on Amazon (gets 70 percent royalties for ebooks). Anything less receives 35% royalties. $9.99 books have 20,000–30,000 words. If you write more and charge more over $9.99, you get 35% royalties. Why not make it a $9.99 book?
(This is the ebook version.) Paperbacks cost more. Higher royalties allow for higher prices.
5. Validate book idea
Amazon will tell you if your book concept, title, and related phrases are popular. See? Check its best-sellers list.
150,000 is preferable. It sells 2–3 copies daily. Consider your rivals. Profitable niches have high demand and low competition.
Don't be afraid of competitive niches. First, it shows high demand. Secondly, what are the ways you can undercut the completion? Better book? Or cheaper option? There was lots of competition in my NodeJS book's area. None received 4.5 stars or more. I wrote a NodeJS book. Today, it's a best-selling Node book.
What’s Next
So long. Part II follows. Meanwhile, I will continue to write more books!
Follow my journey on Twitter.
This post is a summary. Read full article here

Eve Arnold
3 years ago
Your Ideal Position As a Part-Time Creator
Inspired by someone I never met
Inspiration is good and bad.
Paul Jarvis inspires me. He's a web person and writer who created his own category by being himself.
Paul said no thank you when everyone else was developing, building, and assuming greater responsibilities. This isn't success. He rewrote the rules. Working for himself, expanding at his own speed, and doing what he loves were his definitions of success.
Play with a problem that you have
The biggest problem can be not recognizing a problem.
Acceptance without question is deception. When you don't push limits, you forget how. You start thinking everything must be as it is.
For example: working. Paul worked a 9-5 agency work with little autonomy. He questioned whether the 9-5 was a way to live, not the way.
Another option existed. So he chipped away at how to live in this new environment.
Don't simply jump
Internet writers tell people considering quitting 9-5 to just quit. To throw in the towel. To do what you like.
The advice is harmful, despite the good intentions. People think quitting is hard. Like courage is the issue. Like handing your boss a resignation letter.
Nope. The tough part comes after. It’s easy to jump. Landing is difficult.
The landing
Paul didn't quit. Intelligent individuals don't. Smart folks focus on landing. They imagine life after 9-5.
Paul had been a web developer for a long time, had solid clients, and was respected. Hence if he pushed the limits and discovered another route, he had the potential to execute.
Working on the side
Society loves polarization. It’s left or right. Either way. Or chaos. It's 9-5 or entrepreneurship.
But like Paul, you can stretch polarization's limits. In-between exists.
You can work a 9-5 and side jobs (as I do). A mix of your favorites. The 9-5's stability and creativity. Fire and routine.
Remember you can't have everything but anything. You can create and work part-time.
My hybrid lifestyle
Not selling books doesn't destroy my world. My globe keeps spinning if my new business fails or if people don't like my Tweets. Unhappy algorithm? Cool. I'm not bothered (okay maybe a little).
The mix gives me the best of both worlds. To create, hone my skill, and grasp big-business basics. I like routine, but I also appreciate spending 4 hours on Saturdays writing.
Some days I adore leaving work at 5 pm and disconnecting. Other days, I adore having a place to write if inspiration strikes during a run or a discussion.
I’m a part-time creator
I’m a part-time creator. No, I'm not trying to quit. I don't work 5 pm - 2 am on the side. No, I'm not at $10,000 MRR.
I work part-time but enjoy my 9-5. My 9-5 has goodies. My side job as well.
It combines both to meet my lifestyle. I'm satisfied.
Join the Part-time Creators Club for free here. I’ll send you tips to enhance your creative game.
Evgenii Nelepko
3 years ago
My 3 biggest errors as a co-founder and CEO
Reflections on the closed company Hola! Dating app
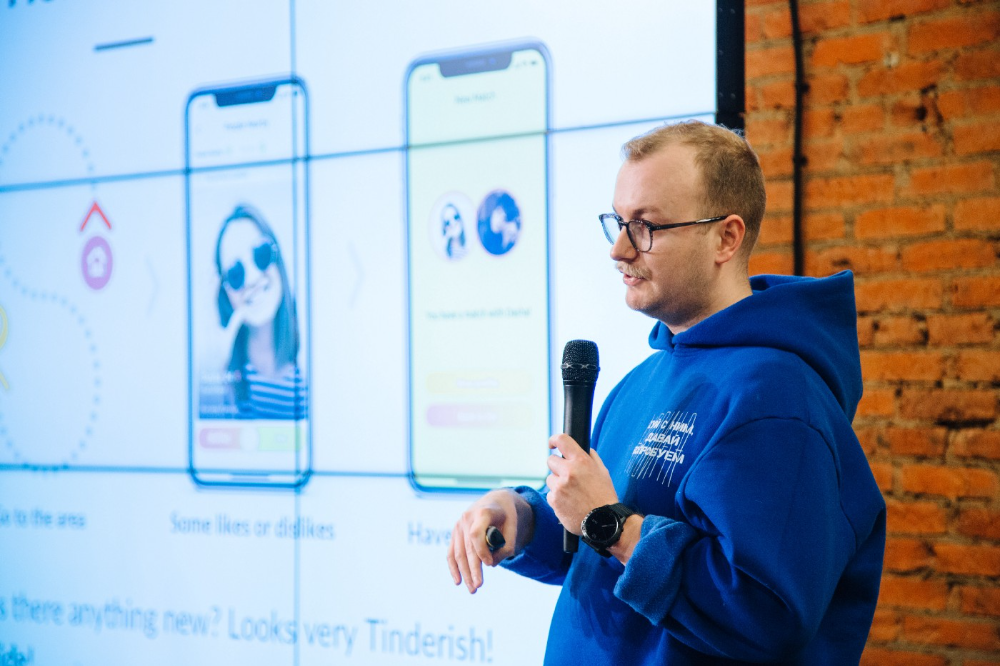
I'll discuss my fuckups as an entrepreneur and CEO. All of them refer to the dating app Hola!, which I co-founded and starred in.
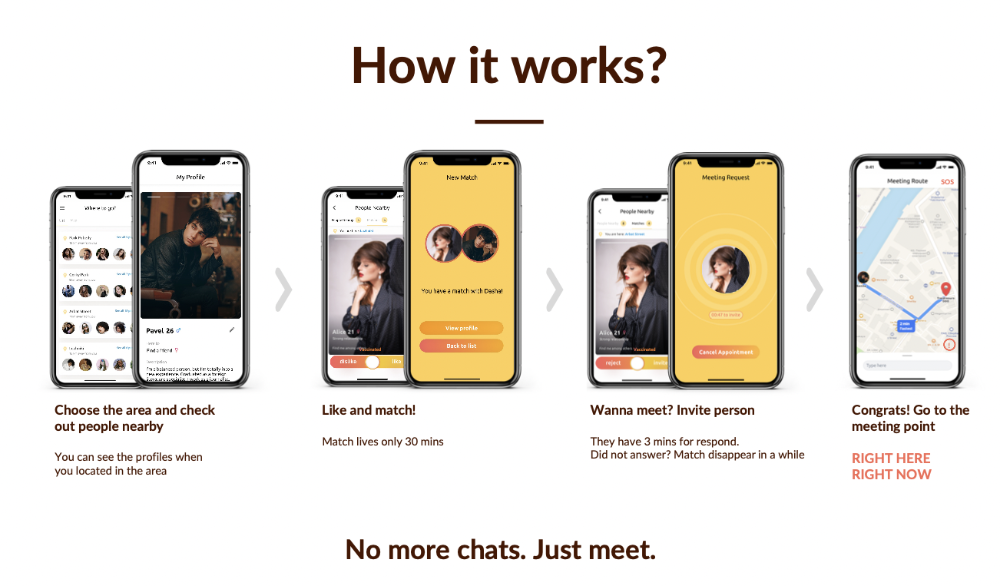
Spring 2021 was when we started. Two techies and two non-techies created a dating app. Pokemon Go and Tinder were combined.
Online dating is a business, and it takes two weeks from a like to a date. We questioned online dating app users if they met anyone offline last year.
75% replied yes, 50% sometimes, 25% usually.
Offline dating is popular, yet people have concerns.
Men are reluctant to make mistakes in front of others.
Women are curious about the background of everyone who approaches them.
We designed unique mechanics that let people date after a match. No endless chitchat. Women would be safe while men felt like cowboys.
I wish to emphasize three faults that lead to founders' estrangement.
This detachment ultimately led to us shutting down the company.
The wrong technology stack
Situation
Instead of generating a faster MVP and designing an app in a universal stack for iOS and Android, I argued we should pilot the app separately for iOS and Android. Technical founders' expertise made this possible.
Self-reflection
Mistaken strategy. We lost time and resources developing two apps at once. We chose iOS since it's more profitable. Apple took us out after the release, citing Guideline 4.3 Spam. After 4 months, we had nothing. We had a long way to go to get the app on Android and the Store.
I suggested creating a uniform platform for the company's growth. This makes parallel product development easier. The strategist's lack of experience and knowledge made it a piece of crap.
What would I have changed if I could?
We should have designed an Android universal stack. I expected Apple to have issues with a dating app.
Our approach should have been to launch something and subsequently improve it, but prejudice won.
The lesson
Discuss the IT stack with your CTO. It saves time and money. Choose the easiest MVP method.
2. A tardy search for investments
Situation
Though the universe and other founders encouraged me to locate investors first, I started pitching when we almost had an app.
When angels arrived, it was time to close. The app was banned, war broke out, I left the country, and the other co-founders stayed. We had no savings.
Self-reflection
I loved interviewing users. I'm proud of having done 1,000 interviews. I wanted to understand people's pain points and improve the product.
Interview results no longer affected the product. I was terrified to start pitching. I filled out accelerator applications and redid my presentation. You must go through that so you won't be terrified later.
What would I have changed if I could?
Get an external or internal mentor to help me with my first pitch as soon as possible. I'd be supported if criticized. He'd cheer with me if there was enthusiasm.
In 99% of cases, I'm comfortable jumping into the unknown, but there are exceptions. The mentor's encouragement would have prompted me to act sooner.
The lesson
Begin fundraising immediately. Months may pass. Show investors your pre-MVP project. Draw inferences from feedback.
3. Role ambiguity
Situation
My technical co-founders were also part-time lead developers, which produced communication issues. As co-founders, we communicated well and recognized the problems. Stakes, vesting, target markets, and approach were agreed upon.
We were behind schedule. Technical debt and strategic gap grew.
Bi-daily and weekly reviews didn't help. Each time, there were explanations. Inside, I was freaking out.
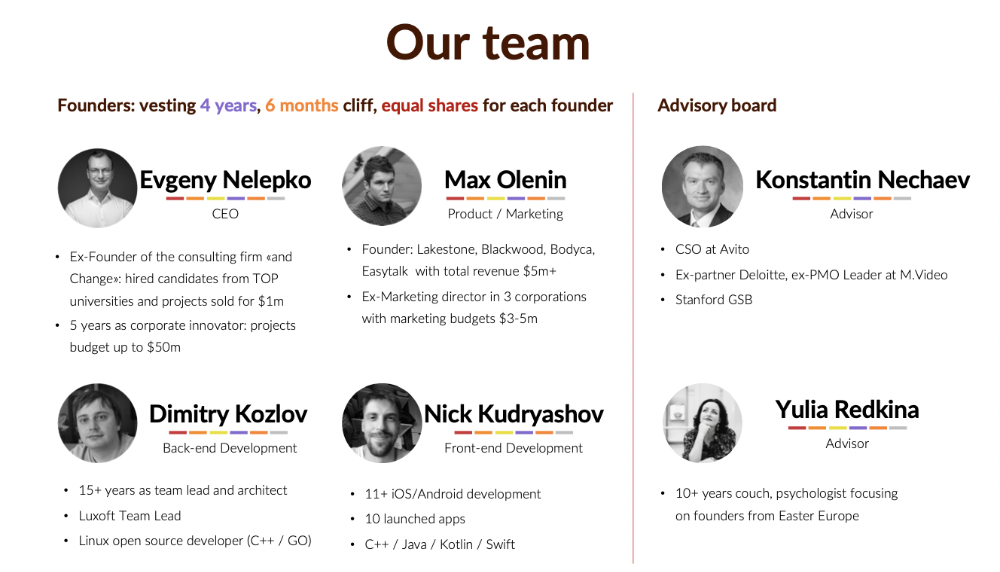
Self-reflection
I am a fairly easy person to talk to. I always try to stick to agreements; otherwise, my head gets stuffed with unnecessary information, interpretations, and emotions.
Sit down -> talk -> decide -> do -> evaluate the results. Repeat it.
If I don't get detailed comments, I start ruining everyone's mood. If there's a systematic violation of agreements without a good justification, I won't join the project or I'll end the collaboration.
What would I have done otherwise?
This is where it’s scariest to draw conclusions. Probably the most logical thing would have been not to start the project as we started it. But that was already a completely different project. So I would not have done anything differently and would have failed again.
But I drew conclusions for the future.
The lesson
First-time founders should find an adviser or team coach for a strategic session. It helps split the roles and responsibilities.
You might also like

nft now
3 years ago
Instagram NFTs Are Here… How does this affect artists?
Instagram (IG) is officially joining NFT. With the debut of new in-app NFT functionalities, influential producers can interact with blockchain tech on the social media platform.
Meta unveiled intentions for an Instagram NFT marketplace in March, but these latest capabilities focus more on content sharing than commerce. And why shouldn’t they? IG's entry into the NFT market is overdue, given that Twitter and Discord are NFT hotspots.
The NFT marketplace/Web3 social media race has continued to expand, with the expected Coinbase NFT Beta now live and blazing a trail through the NFT ecosystem.
IG's focus is on visual art. It's unlike any NFT marketplace or platform. IG NFTs and artists: what's the deal? Let’s take a look.
What are Instagram’s NFT features anyways?
As said, not everyone has Instagram's new features. 16 artists, NFT makers, and collectors can now post NFTs on IG by integrating third-party digital wallets (like Rainbow or MetaMask) in-app. IG doesn't charge to publish or share digital collectibles.
NFTs displayed on the app have a "shimmer" aesthetic effect. NFT posts also have a "digital collectable" badge that lists metadata such as the creator and/or owner, the platform it was created on, a brief description, and a blockchain identification.
Meta's social media NFTs have launched on Instagram, but the company is also preparing to roll out digital collectibles on Facebook, with more on the way for IG. Currently, only Ethereum and Polygon are supported, but Flow and Solana will be added soon.
How will artists use these new features?
Artists are publishing NFTs they developed or own on IG by linking third-party digital wallets. These features have no NFT trading aspects built-in, but are aimed to let authors share NFTs with IG audiences.
Creators, like IG-native aerial/street photographer Natalie Amrossi (@misshattan), are discovering novel uses for IG NFTs.
Amrossi chose to not only upload his own NFTs but also encourage other artists in the field. "That's the beauty of connecting your wallet and sharing NFTs. It's not just what you make, but also what you accumulate."
Amrossi has been producing and posting Instagram art for years. With IG's NFT features, she can understand Instagram's importance in supporting artists.
Web2 offered Amrossi the tools to become an artist and make a life. "Before 'influencer' existed, I was just making art. Instagram helped me reach so many individuals and brands, giving me a living.
Even artists without millions of viewers are encouraged to share NFTs on IG. Wilson, a relatively new name in the NFT space, seems to have already gone above and beyond the scope of these new IG features. By releasing "Losing My Mind" via IG NFT posts, she has evaded the lack of IG NFT commerce by using her network to market her multi-piece collection.
"'Losing My Mind' is a long-running photo series. Wilson was preparing to release it as NFTs before IG approached him, so it was a perfect match.
Wilson says the series is about Black feminine figures and media depiction. Respectable effort, given POC artists have been underrepresented in NFT so far.
“Over the past year, I've had mental health concerns that made my emotions so severe it was impossible to function in daily life, therefore that prompted this photo series. Every Wednesday and Friday for three weeks, I'll release a new Meta photo for sale.
Wilson hopes these new IG capabilities will help develop a connection between the NFT community and other internet subcultures that thrive on Instagram.
“NFTs can look scary as an outsider, but seeing them on your daily IG feed makes it less foreign,” adds Wilson. I think Instagram might become a hub for NFT aficionados, making them more accessible to artists and collectors.
What does it all mean for the NFT space?
Meta's NFT and metaverse activities will continue to impact Instagram's NFT ecosystem. Many think it will be for the better, as IG NFT frauds are another problem hurting the NFT industry.
IG's new NFT features seem similar to Twitter's PFP NFT verifications, but Instagram's tools should help cut down on scams as users can now verify the creation and ownership of whole NFT collections included in IG posts.
Given the number of visual artists and NFT creators on IG, it might become another hub for NFT fans, as Wilson noted. If this happens, it raises questions about Instagram success. Will artists be incentivized to distribute NFTs? Or will those with a large fanbase dominate?
Elise Swopes (@swopes) believes these new features should benefit smaller artists. Swopes was one of the first profiles placed to Instagram's original suggested user list in 2012.
Swopes says she wants IG to be a magnet for discovery and understands the value of NFT artists and producers.
"I'd love to see IG become a focus of discovery for everyone, not just the Beeples and Apes and PFPs. That's terrific for them, but [IG NFT features] are more about using new technology to promote emerging artists, Swopes added.
“Especially music artists. It's everywhere. Dancers, writers, painters, sculptors, musicians. My element isn't just for digital artists; it can be anything. I'm delighted to witness people's creativity."
Swopes, Wilson, and Amrossi all believe IG's new features can help smaller artists. It remains to be seen how these new features will effect the NFT ecosystem once unlocked for the rest of the IG NFT community, but we will likely see more social media NFT integrations in the months and years ahead.
Read the full article here

1eth1da
3 years ago
6 Rules to build a successful NFT Community in 2022

Too much NFT, Discord, and shitposting.
How do you choose?
How do you recruit more members to join your NFT project?
In 2021, a successful NFT project required:
Monkey/ape artwork
Twitter and Discord bot-filled
Roadmap overpromise
Goal was quick cash.
2022 and the years after will change that.
These are 6 Rules for a Strong NFT Community in 2022:
THINK LONG TERM
This relates to roadmap planning. Hype and dumb luck may drive NFT projects (ahem, goblins) but rarely will your project soar.
Instead, consider sustainability.
Plan your roadmap based on your team's abilities.
Do what you're already doing, but with NFTs, make it bigger and better.
You shouldn't copy a project's roadmap just because it was profitable.
This will lead to over-promising, team burnout, and an RUG NFT project.
OFFER VALUE
Building a great community starts with giving.
Why are musicians popular?
Because they offer entertainment for everyone, a random person becomes a fan, and more fans become a cult.
That's how you should approach your community.
TEAM UP
A great team helps.
An NFT project could have 3 or 2 people.
Credibility trumps team size.
Make sure your team can answer community questions, resolve issues, and constantly attend to them.
Don't overwork and burn out.
Your community will be able to recognize that you are trying too hard and give up on the project.
BUILD A GREAT PRODUCT
Bored Ape Yacht Club altered the NFT space.
Cryptopunks transformed NFTs.
Many others did, including Okay Bears.
What made them that way?
Because they answered a key question.
What is my NFT supposed to be?
Before planning art, this question must be answered.
NFTs can't be just jpegs.
What does it represent?
Is it a Metaverse-ready project?
What blockchain are you going to be using and why?
Set some ground rules for yourself. This helps your project's direction.
These questions will help you and your team set a direction for blockchain, NFT, and Web3 technology.
EDUCATE ON WEB3
The more the team learns about Web3 technology, the more they can offer their community.
Think tokens, metaverse, cross-chain interoperability and more.
BUILD A GREAT COMMUNITY
Several projects mistreat their communities.
They treat their community like "customers" and try to sell them NFT.
Providing Whitelists and giveaways aren't your only community-building options.
Think bigger.
Consider them family and friends, not wallets.
Consider them fans.
These are some tips to start your NFT project.

Sylvain Saurel
3 years ago
A student trader from the United States made $110 million in one month and rose to prominence on Wall Street.
Genius or lucky?
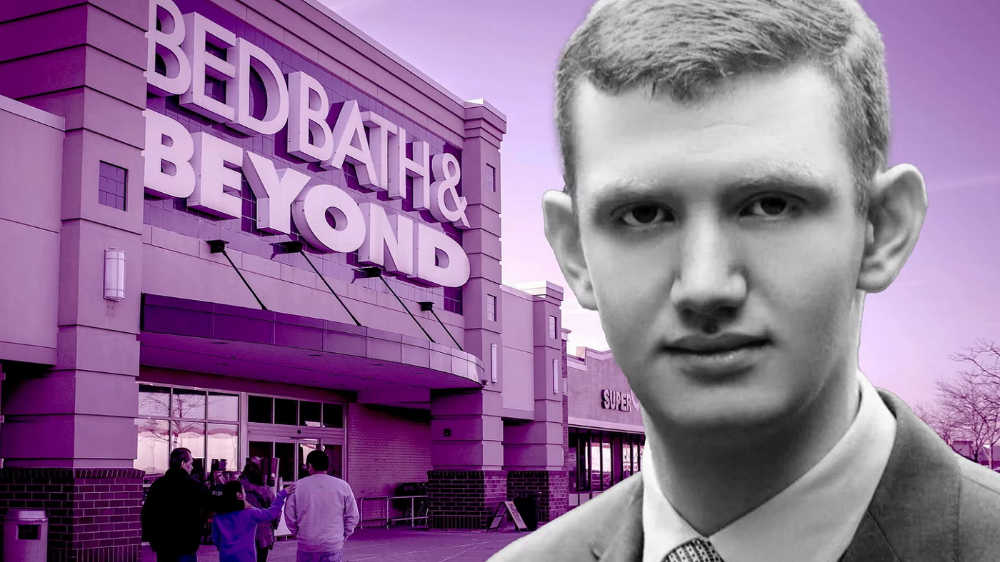
From the title, you might think I'm selling advertising for a financial influencer, a dubious trading site, or a training organization to attract clients. I'm suspicious. Better safe than sorry.
But not here.
Jake Freeman, 20, made $110 million in a month, according to the Financial Times. At 18, he ran for president. He made his name in markets, not politics. Two years later, he's Wall Street's prince. Interview requests flood the prodigy.
Jake Freeman bought 5 million Bed Bath & Beyond Group shares for $5.5 in July 2022 and sold them for $27 a month later. He thought the stock might double. Since speculation died down, he sold well. The stock fell 40.5% to 11 dollars on Friday, 19 August 2022. On August 22, 2022, it fell 16% to $9.
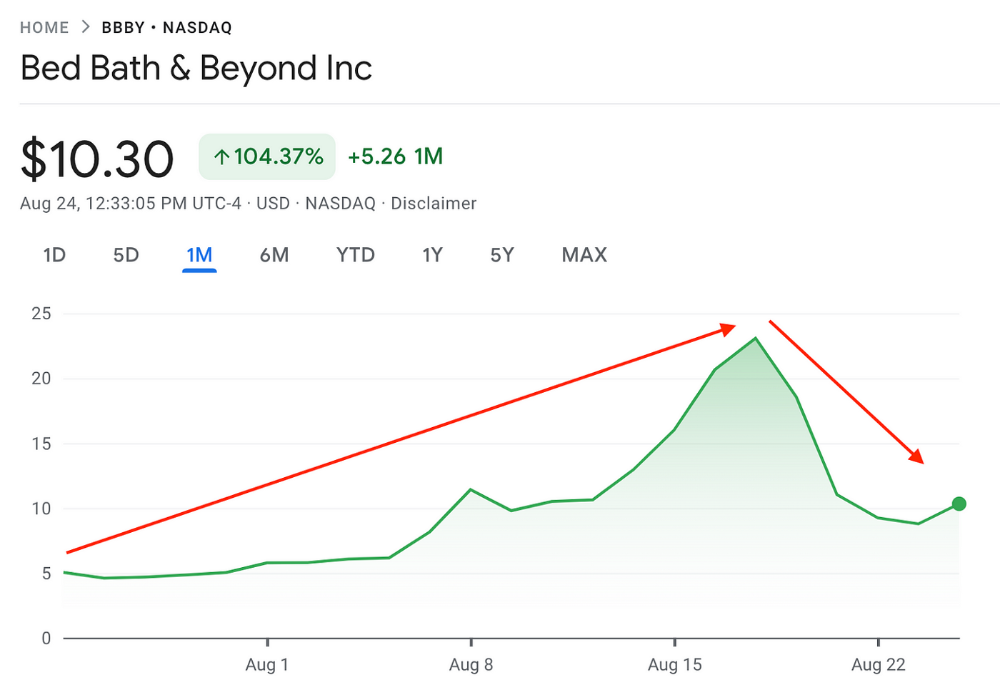
Smallholders have been buying the stock for weeks and will lose heavily if it falls further. Bed Bath & Beyond is the second most popular stock after Foot Locker, ahead of GameStop and Apple.
Jake Freeman earned $110 million thanks to a significant stock market flurry.
Online broker customers aren't the only ones with jitters. By June 2022, Ken Griffin's Citadel and Stephen Mandel's Lone Pine Capital held nearly a third of the company's capital. Did big managers sell before the stock plummeted?
Recent stock movements (derivatives) and rumors could prompt a SEC investigation.
Jake Freeman wrote to the board of directors after his investment to call for a turnaround, given the company's persistent problems and short sellers. The bathroom and kitchen products distribution group's stock soared in July 2022 due to renewed buying by private speculators, who made it one of their meme stocks with AMC and GameStop.
Second-quarter 2022 results and financial health worsened. He didn't celebrate his miraculous operation in a nightclub. He told a British newspaper, "I'm shocked." His parents dined in New York. He returned to Los Angeles to study math and economics.
Jake Freeman founded Freeman Capital Management with his savings and $25 million from family, friends, and acquaintances. They are the ones who are entitled to the $110 million he raised in one month. Will his investors pocket and withdraw all or part of their profits or will they trust the young prodigy for new stunts on Wall Street?
His operation should attract new clients. Well-known hedge funds may hire him.
Jake Freeman didn't listen to gurus or former traders. At 17, he interned at a quantitative finance and derivatives hedge fund, Volaris. At 13, he began investing with his pharmaceutical executive uncle. All countries have increased their Google searches for the young trader in the last week.
Naturally, his success has inspired resentment.
His success stirs jealousy, and he's attacked on social media. On Reddit, people who lost money on Bed Bath & Beyond, Jake Freeman's fortune, are mourning.
Several conspiracy theories circulate about him, including that he doesn't exist or is working for a Taiwanese amusement park.
If all 20 million American students had the same trading skills, they would have generated $1.46 trillion. Jake Freeman is unique. Apprentice traders' careers are often short, disillusioning, and tragic.
Two years ago, 20-year-old Robinhood client Alexander Kearns committed suicide after losing $750,000 trading options. Great traders start young. Michael Platt of BlueCrest invested in British stocks at age 12 under his grandmother's supervision and made a £30,000 fortune. Paul Tudor Jones started trading before he turned 18 with his uncle. Warren Buffett, at age 10, was discussing investments with Goldman Sachs' head. Oracle of Omaha tells all.