


A quick guide to formatting your text on INTΞGRITY
[06/20/2022 update] We have now implemented a powerful text editor, but you can still use markdown.
Markdown:
Headers
SYNTAX:
# This is a heading 1
## This is a heading 2
### This is a heading 3
#### This is a heading 4
RESULT:
This is a heading 1
This is a heading 2
This is a heading 3
This is a heading 4
Emphasis
SYNTAX:
**This text will be bold**
~~Strikethrough~~
*You **can** combine them*
RESULT:
This text will be italic
This text will be bold
You can combine them
Images
SYNTAX:

RESULT:
Videos
SYNTAX:
https://www.youtube.com/watch?v=7KXGZAEWzn0
RESULT:
Links
SYNTAX:
[Int3grity website](https://www.int3grity.com)
RESULT:
Tweets
SYNTAX:
https://twitter.com/samhickmann/status/1503800505864130561
RESULT:
Blockquotes
SYNTAX:
> Human beings face ever more complex and urgent problems, and their effectiveness in dealing with these problems is a matter that is critical to the stability and continued progress of society. \- Doug Engelbart, 1961
RESULT:
Human beings face ever more complex and urgent problems, and their effectiveness in dealing with these problems is a matter that is critical to the stability and continued progress of society. - Doug Engelbart, 1961
Inline code
SYNTAX:
Text inside `backticks` on a line will be formatted like code.
RESULT:
Text inside backticks on a line will be formatted like code.
Code blocks
SYNTAX:
'''js
function fancyAlert(arg) {
  if(arg) {
    $.facebox({div:'#foo'})
  }
}
'''
RESULT:
function fancyAlert(arg) {
if(arg) {
$.facebox({div:'#foo'})
}
}
Maths
We support LaTex to typeset math. We recommend reading the full documentation on the official website
SYNTAX:
$$[x^n+y^n=z^n]$$
RESULT:
[x^n+y^n=z^n]
Tables
SYNTAX:
| header a | header b |
| ---- | ---- |
| row 1 col 1 | row 1 col 2 |
RESULT:
| header a | header b | header c |
|---|---|---|
| row 1 col 1 | row 1 col 2 | row 1 col 3 |
(Edited)
More on Web3 & Crypto

Matt Ward
3 years ago
Is Web3 nonsense?
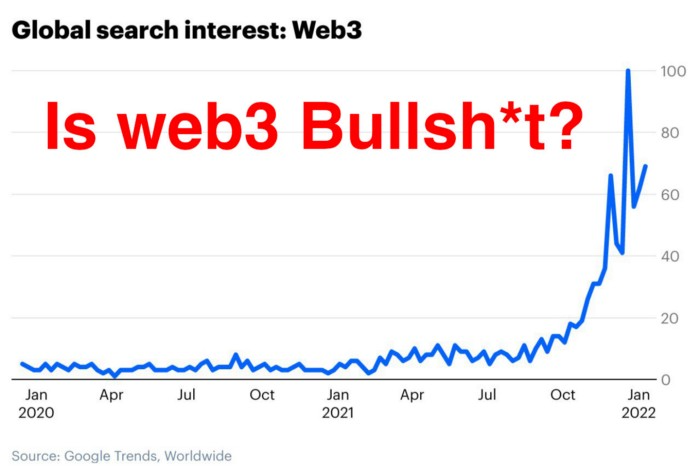
Crypto and blockchain have rebranded as web3. They probably thought it sounded better and didn't want the baggage of scam ICOs, STOs, and skirted securities laws.
It was like Facebook becoming Meta. Crypto's biggest players wanted to change public (and regulator) perception away from pump-and-dump schemes.
After the 2018 ICO gold rush, it's understandable. Every project that raised millions (or billions) never shipped a meaningful product.
Like many crazes, charlatans took the money and ran.
Despite its grifter past, web3 is THE hot topic today as more founders, venture firms, and larger institutions look to build the future decentralized internet.
Supposedly.
How often have you heard: This will change the world, fix the internet, and give people power?
Why are most of web3's biggest proponents (and beneficiaries) the same rich, powerful players who built and invested in the modern internet? It's like they want to remake and own the internet.
Something seems off about that.
Why are insiders getting preferential presale terms before the public, allowing early investors and proponents to flip dirt cheap tokens and advisors shares almost immediately after the public sale?
It's a good gig with guaranteed markups, no risk or progress.
If it sounds like insider trading, it is, at least practically. This is clear when people talk about blockchain/web3 launches and tokens.
Fast money, quick flips, and guaranteed markups/returns are common.
Incentives-wise, it's hard to blame them. Who can blame someone for following the rules to win? Is it their fault or regulators' for not leveling the playing field?
It's similar to oil companies polluting for profit, Instagram depressing you into buying a new dress, or pharma pushing an unnecessary pill.
All of that is fair game, at least until we change the playbook, because people (and corporations) change for pain or love. Who doesn't love money?
belief based on money gain
Sinclair:
“It is difficult to get a man to understand something when his salary depends upon his not understanding it.”
Bitcoin, blockchain, and web3 analogies?
Most blockchain and web3 proponents are true believers, not cynical capitalists. They believe blockchain's inherent transparency and permissionless trust allow humanity to evolve beyond our reptilian ways and build a better decentralized and democratic world.
They highlight issues with the modern internet and monopoly players like Google, Facebook, and Apple. Decentralization fixes everything
If we could give power back to the people and get governments/corporations/individuals out of the way, we'd fix everything.
Blockchain solves supply chain and child labor issues in China.
To meet Paris climate goals, reduce emissions. Create a carbon token.
Fixing online hatred and polarization Web3 Twitter and Facebook replacement.
Web3 must just be the answer for everything… your “perfect” silver bullet.
Nothing fits everyone. Blockchain has pros and cons like everything else.
Blockchain's viral, ponzi-like nature has an MLM (mid level marketing) feel. If you bought Taylor Swift's NFT, your investment is tied to her popularity.
Probably makes you promote Swift more. Play music loudly.
Here's another example:
Imagine if Jehovah’s Witnesses (or evangelical preachers…) got paid for every single person they converted to their cause.
It becomes a self-fulfilling prophecy as their faith and wealth grow.
Which breeds extremism? Ultra-Orthodox Jews are an example. maximalists
Bitcoin and blockchain are causes, religions. It's a money-making movement and ideal.
We're good at convincing ourselves of things we want to believe, hence filter bubbles.
I ignore anything that doesn't fit my worldview and seek out like-minded people, which algorithms amplify.
Then what?
Is web3 merely a new scam?
No, never!
Blockchain has many crucial uses.
Sending money home/abroad without bank fees;
Like fleeing a war-torn country and converting savings to Bitcoin;
Like preventing Twitter from silencing dissidents.
Permissionless, trustless databases could benefit society and humanity. There are, however, many limitations.
Lost password?
What if you're cheated?
What if Trump/Putin/your favorite dictator incites a coup d'état?
What-ifs abound. Decentralization's openness brings good and bad.
No gatekeepers or firefighters to rescue you.
ISIS's fundraising is also frictionless.
Community-owned apps with bad interfaces and service.
Trade-offs rule.
So what compromises does web3 make?
What are your trade-offs? Decentralization has many strengths and flaws. Like Bitcoin's wasteful proof-of-work or Ethereum's political/wealth-based proof-of-stake.
To ensure the survival and veracity of the network/blockchain and to safeguard its nodes, extreme measures have been designed/put in place to prevent hostile takeovers aimed at altering the blockchain, i.e., adding money to your own wallet (account), etc.
These protective measures require significant resources and pose challenges. Reduced speed and throughput, high gas fees (cost to submit/write a transaction to the blockchain), and delayed development times, not to mention forked blockchain chains oops, web3 projects.
Protecting dissidents or rogue regimes makes sense. You need safety, privacy, and calm.
First-world life?
What if you assumed EVERYONE you saw was out to rob/attack you? You'd never travel, trust anyone, accomplish much, or live fully. The economy would collapse.
It's like an ant colony where half the ants do nothing but wait to be attacked.
Waste of time and money.
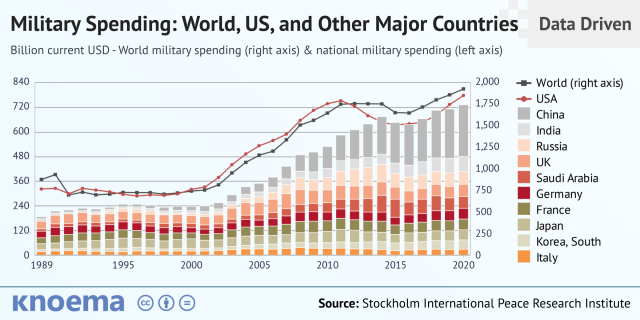
11% of the US budget goes to the military. Imagine what we could do with the $766B+ we spend on what-ifs annually.
Is so much hypothetical security needed?
Blockchain and web3 are similar.
Does your app need permissionless decentralization? Does your scooter-sharing company really need a proof-of-stake system and 1000s of nodes to avoid Russian hackers? Why?
Worst-case scenario? It's not life or death, unless you overstate the what-ifs. Web3 proponents find improbable scenarios to justify decentralization and tokenization.
Do I need a token to prove ownership of my painting? Unless I'm a master thief, I probably bought it.
despite losing the receipt.
I do, however, love Web 3.
Enough Web3 bashing for now. Understand? Decentralization isn't perfect, but it has huge potential when applied to the right problems.
I see many of the right problems as disrupting big tech's ruthless monopolies. I wrote several years ago about how tokenized blockchains could be used to break big tech's stranglehold on platforms, marketplaces, and social media.
Tokenomics schemes can be used for good and are powerful. Here’s how.
Before the ICO boom, I made a series of predictions about blockchain/crypto's future. It's still true.
Here's where I was then and where I see web3 going:
My 11 Big & Bold Predictions for Blockchain
In the near future, people may wear crypto cash rings or bracelets.
While some governments repress cryptocurrency, others will start to embrace it.
Blockchain will fundamentally alter voting and governance, resulting in a more open election process.
Money freedom will lead to a more geographically open world where people will be more able to leave when there is unrest.
Blockchain will make record keeping significantly easier, eliminating the need for a significant portion of government workers whose sole responsibility is paperwork.
Overrated are smart contracts.
6. Tokens will replace company stocks.
7. Blockchain increases real estate's liquidity, value, and volatility.
8. Healthcare may be most affected.
9. Crypto could end privacy and lead to Minority Report.
10. New companies with network effects will displace incumbents.
11. Soon, people will wear rings or bracelets with crypto cash.
Some have already happened, while others are still possible.
Time will tell if they happen.
And finally:
What will web3 be?
Who will be in charge?
Closing remarks
Hope you enjoyed this web3 dive. There's much more to say, but that's for another day.
We're writing history as we go.
Tech regulation, mergers, Bitcoin surge How will history remember us?
What about web3 and blockchain?
Is this a revolution or a tulip craze?
Remember, actions speak louder than words (share them in the comments).
Your turn.

Shan Vernekar
3 years ago
How the Ethereum blockchain's transactions are carried out
Overview
Ethereum blockchain is a network of nodes that validate transactions. Any network node can be queried for blockchain data for free. To write data as a transition requires processing and writing to each network node's storage. Fee is paid in ether and is also called as gas.
We'll examine how user-initiated transactions flow across the network and into the blockchain.
Flow of transactions
A user wishes to move some ether from one external account to another. He utilizes a cryptocurrency wallet for this (like Metamask), which is a browser extension.
The user enters the desired transfer amount and the external account's address. He has the option to choose the transaction cost he is ready to pay.
Wallet makes use of this data, signs it with the user's private key, and writes it to an Ethereum node. Services such as Infura offer APIs that enable writing data to nodes. One of these services is used by Metamask. An example transaction is shown below. Notice the “to” address and value fields.
var rawTxn = {
    nonce: web3.toHex(txnCount),
    gasPrice: web3.toHex(100000000000),
    gasLimit: web3.toHex(140000),
    to: '0x633296baebc20f33ac2e1c1b105d7cd1f6a0718b',
    value: web3.toHex(0),
    data: '0xcc9ab24952616d6100000000000000000000000000000000000000000000000000000000'
};
The transaction is written to the target Ethereum node's local TRANSACTION POOL. It informed surrounding nodes of the new transaction, and those nodes reciprocated. Eventually, this transaction is received by and written to each node's local TRANSACTION pool.
The miner who finds the following block first adds pending transactions (with a higher gas cost) from the nearby TRANSACTION POOL to the block.
The transactions written to the new block are verified by other network nodes.
A block is added to the main blockchain after there is consensus and it is determined to be genuine. The local blockchain is updated with the new node by additional nodes as well.
Block mining begins again next.
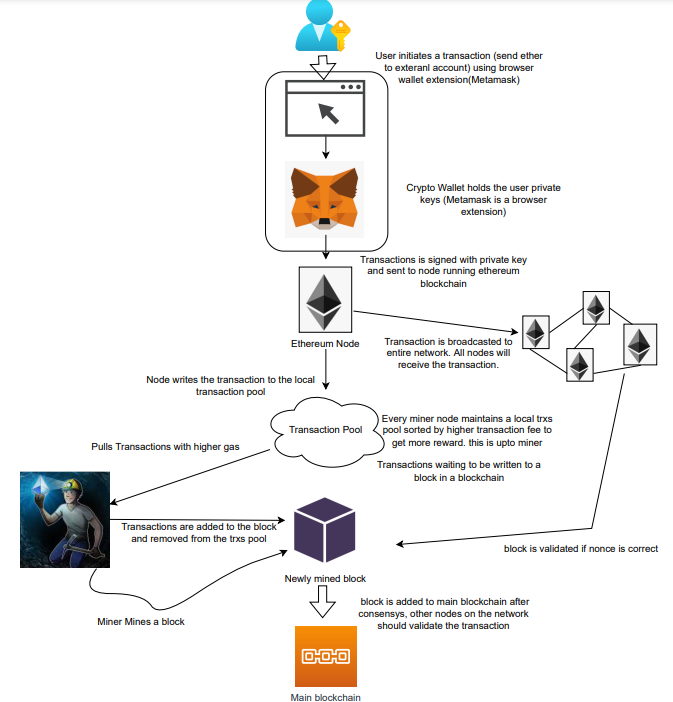
The image above shows how transactions go via the network and what's needed to submit them to the main block chain.
References
ethereum.org/transactions How Ethereum transactions function, their data structure, and how to send them via app. ethereum.org
Elnaz Sarraf
3 years ago
Why Bitcoin's Crash Could Be Good for Investors
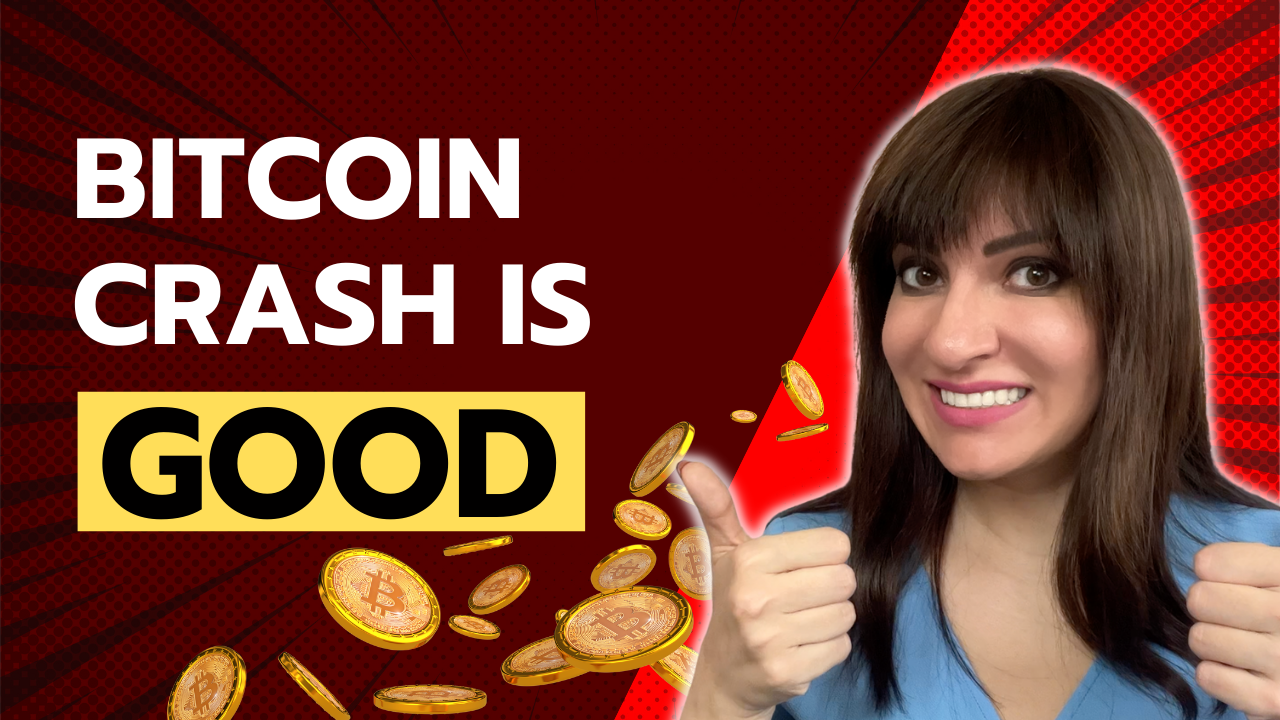
The crypto market crashed in June 2022. Bitcoin and other cryptocurrencies hit their lowest prices in over a year, causing market panic. Some believe this crash will benefit future investors.
Before I discuss how this crash might help investors, let's examine why it happened. Inflation in the U.S. reached a 30-year high in 2022 after Russia invaded Ukraine. In response, the U.S. Federal Reserve raised interest rates by 0.5%, the most in almost 20 years. This hurts cryptocurrencies like Bitcoin. Higher interest rates make people less likely to invest in volatile assets like crypto, so many investors sold quickly.
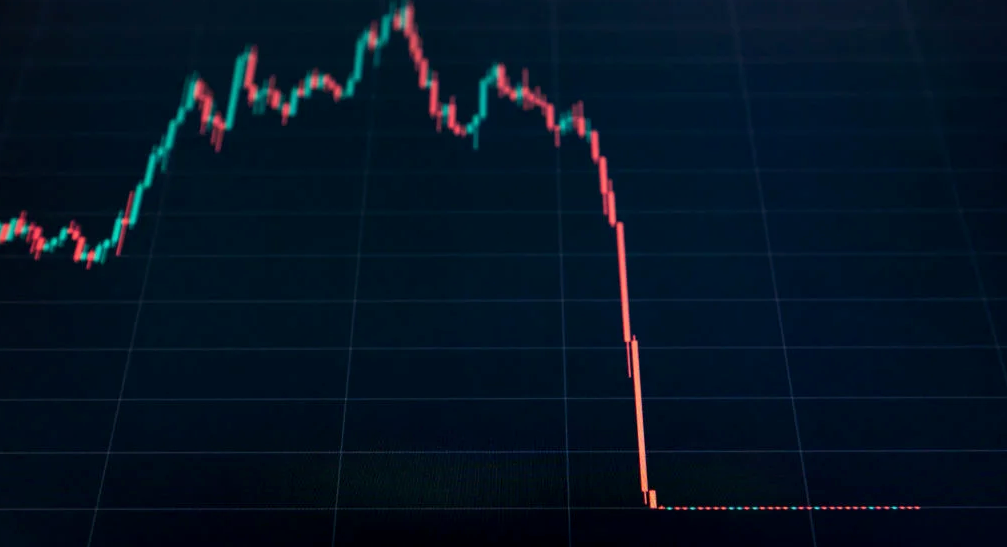
The crypto market collapsed. Bitcoin, Ethereum, and Binance dropped 40%. Other cryptos crashed so hard they were delisted from almost every exchange. Bitcoin peaked in April 2022 at $41,000, but after the May interest rate hike, it crashed to $28,000. Bitcoin investors were worried. Even in bad times, this crash is unprecedented.
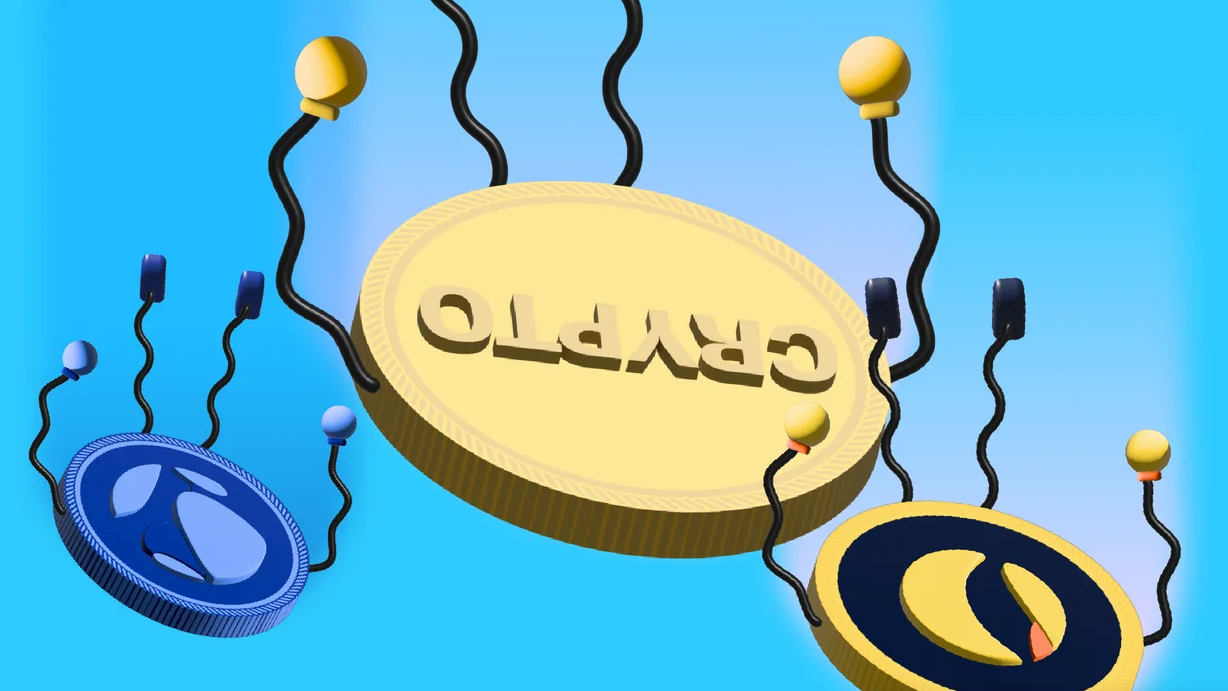
Bitcoin wasn't "doomed." Before the crash, LUNA was one of the top 5 cryptos by market cap. LUNA was trading around $80 at the start of May 2022, but after the rate hike?
Less than 1 cent. LUNA lost 99.99% of its value in days and was removed from every crypto exchange. Bitcoin's "crash" isn't as devastating when compared to LUNA.
Many people said Bitcoin is "due" for a LUNA-like crash and that the only reason it hasn't crashed is because it's bigger. Still false. If so, Bitcoin should be worth zero by now. We didn't. Instead, Bitcoin reached 28,000, then 29k, 30k, and 31k before falling to 18k. That's not the world's greatest recovery, but it shows Bitcoin's safety.
Bitcoin isn't falling constantly. It fell because of the initial shock of interest rates, but not further. Now, Bitcoin's value is more likely to rise than fall. Bitcoin's low price also attracts investors. They know what prices Bitcoin can reach with enough hype, and they want to capitalize on low prices before it's too late.

Bitcoin's crash was bad, but in a way it wasn't. To understand, consider 2021. In March 2021, Bitcoin surpassed $60k for the first time. Elon Musk's announcement in May that he would no longer support Bitcoin caused a massive crash in the crypto market. In May 2017, Bitcoin's price hit $29,000. Elon Musk's statement isn't worth more than the Fed raising rates. Many expected this big announcement to kill Bitcoin.
Not so. Bitcoin crashed from $58k to $31k in 2021. Bitcoin fell from $41k to $28k in 2022. This crash is smaller. Bitcoin's price held up despite tensions and stress, proving investors still believe in it. What happened after the initial crash in the past?
Bitcoin fell until mid-July. This is also something we’re not seeing today. After a week, Bitcoin began to improve daily. Bitcoin's price rose after mid-July. Bitcoin's price fluctuated throughout the rest of 2021, but it topped $67k in November. Despite no major changes, the peak occurred after the crash. Elon Musk seemed uninterested in crypto and wasn't likely to change his mind soon. What triggered this peak? Nothing, really. What really happened is that people got over the initial statement. They forgot.
Internet users have goldfish-like attention spans. People quickly forgot the crash's cause and were back investing in crypto months later. Despite the market's setbacks, more crypto investors emerged by the end of 2017. Who gained from these peaks? Bitcoin investors who bought low. Bitcoin not only recovered but also doubled its ROI. It was like a movie, and it shows us what to expect from Bitcoin in the coming months.
The current Bitcoin crash isn't as bad as the last one. LUNA is causing market panic. LUNA and Bitcoin are different cryptocurrencies. LUNA crashed because Terra wasn’t able to keep its peg with the USD. Bitcoin is unanchored. It's one of the most decentralized investments available. LUNA's distrust affected crypto prices, including Bitcoin, but it won't last forever.
This is why Bitcoin will likely rebound in the coming months. In 2022, people will get over the rise in interest rates and the crash of LUNA, just as they did with Elon Musk's crypto stance in 2021. When the world moves on to the next big controversy, Bitcoin's price will soar.
Bitcoin may recover for another reason. Like controversy, interest rates fluctuate. The Russian invasion caused this inflation. World markets will stabilize, prices will fall, and interest rates will drop.
Next, lower interest rates could boost Bitcoin's price. Eventually, it will happen. The U.S. economy can't sustain such high interest rates. Investors will put every last dollar into Bitcoin if interest rates fall again.
Bitcoin has proven to be a stable investment. This boosts its investment reputation. Even if Ethereum dethrones Bitcoin as crypto king one day (or any other crypto, for that matter). Bitcoin may stay on top of the crypto ladder for a while. We'll have to wait a few months to see if any of this is true.
This post is a summary. Read the full article here.
You might also like

Will Lockett
3 years ago
The World Will Change With MIT's New Battery

It's cheaper, faster charging, longer lasting, safer, and better for the environment.
Batteries are the future. Next-gen and planet-saving technology, including solar power and EVs, require batteries. As these smart technologies become more popular, we find that our batteries can't keep up. Lithium-ion batteries are expensive, slow to charge, big, fast to decay, flammable, and not environmentally friendly. MIT just created a new battery that eliminates all of these problems. So, is this the battery of the future? Or is there a catch?
When I say entirely new, I mean it. This battery employs no currently available materials. Its electrodes are constructed of aluminium and pure sulfur instead of lithium-complicated ion's metals and graphite. Its electrolyte is formed of molten chloro-aluminate salts, not an organic solution with lithium salts like lithium-ion batteries.
How does this change in materials help?
Aluminum, sulfur, and chloro-aluminate salts are abundant, easy to acquire, and cheap. This battery might be six times cheaper than a lithium-ion battery and use less hazardous mining. The world and our wallets will benefit.
But don’t go thinking this means it lacks performance.
This battery charged in under a minute in tests. At 25 degrees Celsius, the battery will charge 25 times slower than at 110 degrees Celsius. This is because the salt, which has a very low melting point, is in an ideal state at 110 degrees and can carry a charge incredibly quickly. Unlike lithium-ion, this battery self-heats when charging and discharging, therefore no external heating is needed.
Anyone who's seen a lithium-ion battery burst might be surprised. Unlike lithium-ion batteries, none of the components in this new battery can catch fire. Thus, high-temperature charging and discharging speeds pose no concern.
These batteries are long-lasting. Lithium-ion batteries don't last long, as any iPhone owner can attest. During charging, metal forms a dendrite on the electrode. This metal spike will keep growing until it reaches the other end of the battery, short-circuiting it. This is why phone batteries only last a few years and why electric car range decreases over time. This new battery's molten salt slows deposition, extending its life. This helps the environment and our wallets.
These batteries are also energy dense. Some lithium-ion batteries have 270 Wh/kg energy density (volume and mass). Aluminum-sulfur batteries could have 1392 Wh/kg, according to calculations. They'd be 5x more energy dense. Tesla's Model 3 battery would weigh 96 kg instead of 480 kg if this battery were used. This would improve the car's efficiency and handling.
These calculations were for batteries without molten salt electrolyte. Because they don't reflect the exact battery chemistry, they aren't a surefire prediction.
This battery seems great. It will take years, maybe decades, before it reaches the market and makes a difference. Right?
Nope. The project's scientists founded Avanti to develop and market this technology.
So we'll soon be driving cheap, durable, eco-friendly, lightweight, and ultra-safe EVs? Nope.
This battery must be kept hot to keep the salt molten; otherwise, it won't work and will expand and contract, causing damage. This issue could be solved by packs that can rapidly pre-heat, but that project is far off.
Rapid and constant charge-discharge cycles make these batteries ideal for solar farms, homes, and EV charging stations. The battery is constantly being charged or discharged, allowing it to self-heat and maintain an ideal temperature.
These batteries aren't as sexy as those making EVs faster, more efficient, and cheaper. Grid batteries are crucial to our net-zero transition because they allow us to use more low-carbon energy. As we move away from fossil fuels, we'll need millions of these batteries, so the fact that they're cheap, safe, long-lasting, and environmentally friendly will be huge. Who knows, maybe EVs will use this technology one day. MIT has created another world-changing technology.

Mike Meyer
3 years ago
Reality Distortion
Old power paradigm blocks new planetary paradigm
The difference between our reality and the media's reality is like a tale of two worlds. The greatest and worst of times, really.
Expanding information demands complex skills and understanding to separate important information from ignorance and crap. And that's just the start of determining the source's aim.
Trust who? We see people trust liars in public and then be destroyed by their decisions. Mistakes may be devastating.
Many give up and don't trust anyone. Reality is a choice, though. Same risks.
We must separate our needs and wants from reality. Needs and wants have rules. Greed and selfishness create an unlivable planet.
Culturally, we know this, but we ignore it as foolish. Selfish and greedy people obtain what they want, while others suffer.
We invade, plunder, rape, and burn. We establish civilizations by institutionalizing an exploitable underclass and denying its existence. These cultural lies promote greed and selfishness despite their destructiveness.
Controlling parts of society institutionalize these lies as fact. Many of each age are willing to gamble on greed because they were taught to see greed and selfishness as principles justified by prosperity.
Our cultural understanding recognizes the long-term benefits of collaboration and sharing. This older understanding generates an increasing tension between greedy people and those who see its planetary effects.
Survival requires distinguishing between global and regional realities. Simple, yet many can't do it. This is the first time human greed has had a global impact.
In the past, conflict stories focused on regional winners and losers. Losers lose, winners win, etc. Powerful people see potential decades of nuclear devastation as local, overblown, and not personally dangerous.
Mutually Assured Destruction (MAD) was a human choice that required people to acquiesce to irrational devastation. This prevented nuclear destruction. Most would refuse.
A dangerous “solution” relies on nuclear trigger-pullers not acting irrationally. Since then, we've collected case studies of sane people performing crazy things in experiments. We've been lucky, but the climate apocalypse could be different.
Climate disaster requires only continuing current behavior. These actions already cause global harm, but that's not a threat. These activities must be viewed differently.
Once grasped, denying planetary facts is hard to accept. Deniers can't think beyond regional power. Seeing planet-scale is unusual.
Decades of indoctrination defining any planetary perspective as un-American implies communal planetary assets are for plundering. The old paradigm limits any other view.
In the same way, the new paradigm sees the old regional power paradigm as a threat to planetary civilization and lifeforms. Insane!
While MAD relied on leaders not acting stupidly to trigger a nuclear holocaust, the delayed climatic holocaust needs correcting centuries of lunacy. We must stop allowing craziness in global leadership.
Nothing in our acknowledged past provides a paradigm for such. Only primitive people have failed to reach our level of sophistication.
Before European colonization, certain North American cultures built sophisticated regional nations but abandoned them owing to authoritarian cruelty and destruction. They were overrun by societies that saw no wrong in perpetual exploitation. David Graeber's The Dawn of Everything is an example of historical rediscovery, which is now crucial.
From the new paradigm's perspective, the old paradigm is irrational, yet it's too easy to see those in it as ignorant or malicious, if not both. These people are both, but the collapsing paradigm they promote is older or more ingrained than we think.
We can't shift that paradigm's view of a dead world. We must eliminate this mindset from our nations' leadership. No other way will preserve the earth.
Change is occurring. As always with tremendous transition, younger people are building the new paradigm.
The old paradigm's disintegration is insane. The ability to detect errors and abandon their sources is more important than age. This is gaining recognition.
The breakdown of the previous paradigm is not due to senile leadership, but to systemic problems that the current, conservative leadership cannot recognize.
Stop following the old paradigm.
Dmytro Spilka
3 years ago
Why NFTs Have a Bright Future Away from Collectible Art After Punks and Apes

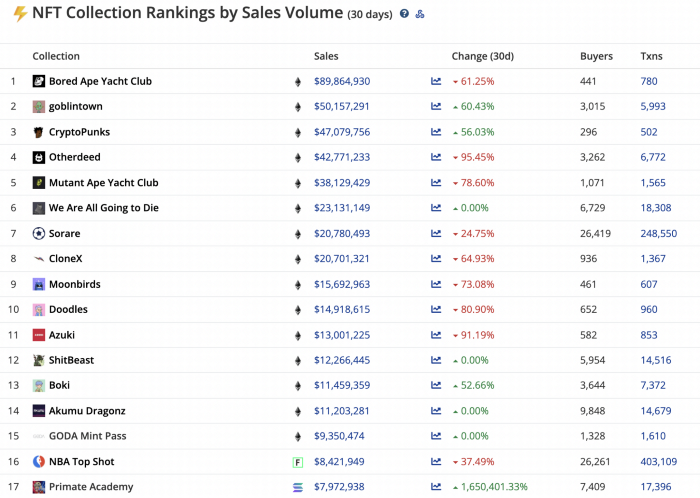
After a crazy second half of 2021 and significant trade volumes into 2022, the market for NFT artworks like Bored Ape Yacht Club, CryptoPunks, and Pudgy Penguins has begun a sharp collapse as market downturns hit token values.
DappRadar data shows NFT monthly sales have fallen below $1 billion since June 2021. OpenSea, the world's largest NFT exchange, has seen sales volume decline 75% since May and is trading like July 2021.
Prices of popular non-fungible tokens have also decreased. Bored Ape Yacht Club (BAYC) has witnessed volume and sales drop 63% and 15%, respectively, in the past month.
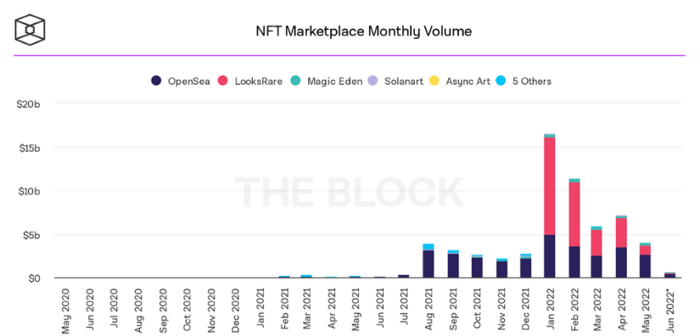
BeInCrypto analysis shows market decline. May 2022 cryptocurrency marketplace volume was $4 billion, according to a news platform. This is a sharp drop from April's $7.18 billion.
OpenSea, a big marketplace, contributed $2.6 billion, while LooksRare, Magic Eden, and Solanart also contributed.
NFT markets are digital platforms for buying and selling tokens, similar stock trading platforms. Although some of the world's largest exchanges offer NFT wallets, most users store their NFTs on their favorite marketplaces.
In January 2022, overall NFT sales volume was $16.57 billion, with LooksRare contributing $11.1 billion. May 2022's volume was $12.57 less than January, a 75% drop, and June's is expected to be considerably smaller.
A World Based on Utility
Despite declines in NFT trading volumes, not all investors are negative on NFTs. Although there are uncertainties about the sustainability of NFT-based art collections, there are fewer reservations about utility-based tokens and their significance in technology's future.
In June, business CEO Christof Straub said NFTs may help artists monetize unreleased content, resuscitate catalogs, establish deeper fan connections, and make processes more efficient through technology.
We all know NFTs can't be JPEGs. Straub noted that NFT music rights can offer more equitable rewards to musicians.
Music NFTs are here to stay if they have real value, solve real problems, are trusted and lawful, and have fair and sustainable business models.
NFTs can transform numerous industries, including music. Market opinion is shifting towards tokens with more utility than the social media artworks we're used to seeing.
While the major NFT names remain dominant in terms of volume, new utility-based initiatives are emerging as top 20 collections.
Otherdeed, Sorare, and NBA Top Shot are NFT-based games that rank above Bored Ape Yacht Club and Cryptopunks.
Users can switch video NFTs of basketball players in NBA Top Shot. Similar efforts are emerging in the non-fungible landscape.
Sorare shows how NFTs can support a new way of playing fantasy football, where participants buy and swap trading cards to create a 5-player team that wins rewards based on real-life performances.
Sorare raised 579.7 million in one of Europe's largest Series B financing deals in September 2021. Recently, the platform revealed plans to expand into Major League Baseball.
Strong growth indications suggest a promising future for NFTs. The value of art-based collections like BAYC and CryptoPunks may be questioned as markets become diluted by new limited collections, but the potential for NFTs to become intrinsically linked to tangible utility like online gaming, music and art, and even corporate reward schemes shows the industry has a bright future.