


More on Entrepreneurship/Creators

ANTHONY P.
3 years ago
Startups are difficult. Streamlining the procedure for creating the following unicorn.
New ventures are exciting. It's fun to imagine yourself rich, successful, and famous (if that's your thing). How you'll help others and make your family proud. This excitement can pull you forward for years, even when you intuitively realize that the path you're on may not lead to your desired success.
Know when to change course. Switching course can mean pivoting or changing direction.
In this not-so-short blog, I'll describe the journey of building your dream. And how the journey might look when you think you're building your dream, but fall short of that vision. Both can feel similar in the beginning, but there are subtle differences.
Let’s dive in.
How an exciting journey to a dead end looks and feels.
You want to help many people. You're business-minded, creative, and ambitious. You jump into entrepreneurship. You're excited, free, and in control.
I'll use tech as an example because that's what I know best, but this applies to any entrepreneurial endeavor.
So you start learning the basics of your field, say coding/software development. You read books, take courses, and may even join a bootcamp. You start practicing, and the journey begins. Once you reach a certain level of skill (which can take months, usually 12-24), you gain the confidence to speak with others in the field and find common ground. You might attract a co-founder this way with time. You and this person embark on a journey (Tip: the idea you start with is rarely the idea you end with).
Amateur mistake #1: You spend months building a product before speaking to customers.
Building something pulls you forward blindly. You make mistakes, avoid customers, and build with your co-founder or small team in the dark for months, usually 6-12 months.
You're excited when the product launches. We'll be billionaires! The market won't believe it. This excites you and the team. Launch.
….
Nothing happens.
Some people may sign up out of pity, only to never use the product or service again.
You and the team are confused, discouraged and in denial. They don't get what we've built yet. We need to market it better, we need to talk to more investors, someone will understand our vision.
This is a hopeless path, and your denial could last another 6 months. If you're lucky, while talking to consumers and investors (which you should have done from the start), someone who has been there before would pity you and give you an idea to pivot into that can create income.
Suppose you get this idea and pivot your business. Again, you've just pivoted into something limited by what you've already built. It may be a revenue-generating idea, but it's rarely new. Now you're playing catch-up, doing something others are doing but you can do better. (Tip #2: Don't be late.) Your chances of winning are slim, and you'll likely never catch up.
You're finally seeing revenue and feel successful. You can compete, but if you're not a first mover, you won't earn enough over time. You'll get by or work harder than ever to earn what a skilled trade could provide. You didn't go into business to stress out and make $100,000 or $200,000 a year. When you can make the same amount by becoming a great software developer, electrician, etc.
You become stuck. Either your firm continues this way for years until you realize there isn't enough growth to recruit a strong team and remove yourself from day-to-day operations due to competition. Or a catastrophic economic event forces you to admit that what you were building wasn't new and unique and wouldn't get you where you wanted to be.
This realization could take 6-10 years. No kidding.
The good news is, you’ve learned a lot along the way and this information can be used towards your next venture (if you have the energy).
Key Lesson: Don’t build something if you aren’t one of the first in the space building it just for the sake of building something.
-
Let's discuss what it's like to build something that can make your dream come true.
Case 2: Building something the market loves is difficult but rewarding.
It starts with a problem that hasn't been adequately solved for a long time but is now solvable due to technology. Or a new problem due to a change in how things are done.
Let's examine each example.
Example #1: Mass communication. The problem is now solvable due to some technological breakthrough.
Twitter — One of the first web 2 companies that became successful with the rise of smart mobile computing.
People can share their real-time activities via mobile device with friends, family, and strangers. Web 2 and smartphones made it easy and fun.
Example #2: A new problem has emerged due to some change in the way things are conducted.
Zoom- A web-conferencing company that reached massive success due to the movement towards “work from home”, remote/hybrid work forces.
Online web conferencing allows for face-to-face communication.
-
These two examples show how to build a unicorn-type company. It's a mix of solving the right problem at the right time, either through a technological breakthrough that opens up new opportunities or by fundamentally changing how people do things.
Let's find these opportunities.
Start by examining problems, such as how the world has changed and how we can help it adapt. It can also be both. Start team brainstorming. Research technologies, current world-trends, use common sense, and make a list. Then, choose the top 3 that you're most excited about and seem most workable based on your skillsets, values, and passion.
Once you have this list, create the simplest MVP you can and test it with customers. The prototype can be as simple as a picture or diagram of user flow and end-user value. No coding required. Market-test. Twitter's version 1 was simple. It was a web form that asked, "What are you doing?" Then publish it from your phone. A global status update, wherever you are. Currently, this company has a $50 billion market cap.
Here's their MVP screenshot.
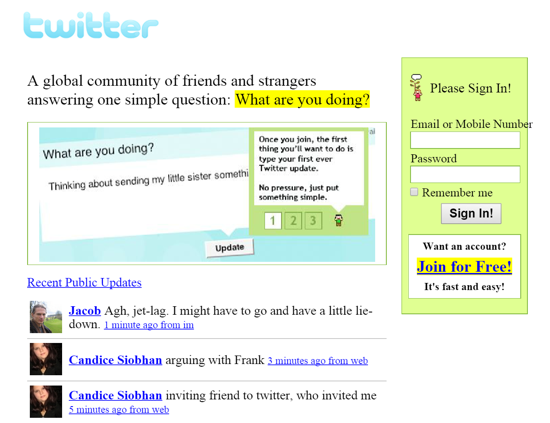
Small things grow. Tiny. Simplify.
Remember Frequency and Value when brainstorming. Your product is high frequency (Twitter, Instagram, Snapchat, TikTok) or high value (Airbnb for renting travel accommodations), or both (Gmail).
Once you've identified product ideas that meet the above criteria, they're simple, have a high frequency of use, or provide deep value. You then bring it to market in the simplest, most cost-effective way. You can sell a half-working prototype with imagination and sales skills. You need just enough of a prototype to convey your vision to a user or customer.
With this, you can approach real people. This will do one of three things: give you a green light to continue on your vision as is, show you that there is no opportunity and people won't use it, or point you in a direction that is a blend of what you've come up with and what the customer / user really wants, and you update the prototype and go back to the maze. Repeat until you have enough yeses and conviction to build an MVP.

SAHIL SAPRU
3 years ago
Growth tactics that grew businesses from 1 to 100
Everyone wants a scalable startup.
Innovation helps launch a startup. The secret to a scalable business is growth trials (from 1 to 100).
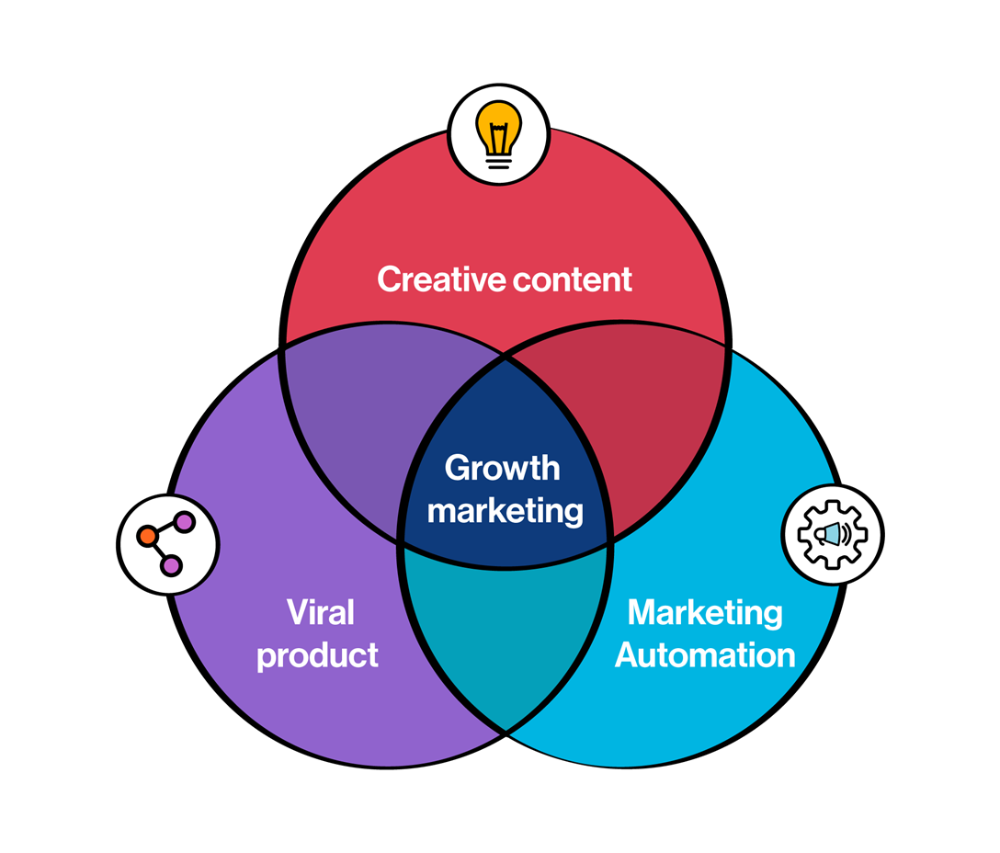
Growth marketing combines marketing and product development for long-term growth.
Today, I'll explain growth hacking strategies popular startups used to scale.
1/ A Facebook user's social value is proportional to their friends.
Facebook built its user base using content marketing and paid ads. Mark and his investors feared in 2007 when Facebook's growth stalled at 90 million users.
Chamath Palihapitiya was brought in by Mark.
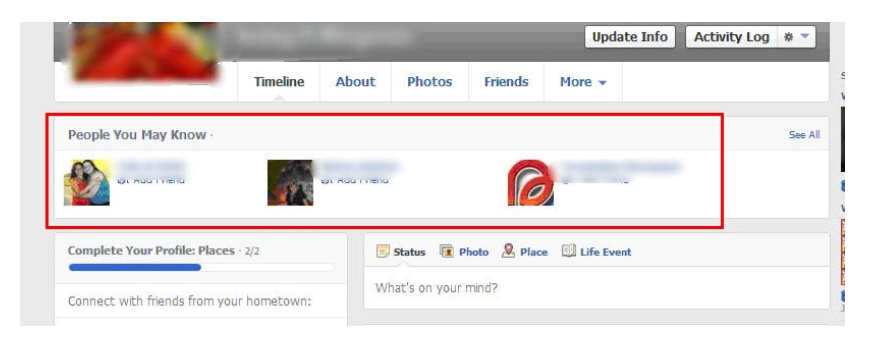
The team tested SEO keywords and MAU chasing. The growth team introduced “people you may know”
This feature reunited long-lost friends and family. Casual users became power users as the retention curve flattened.
Growth Hack Insights: With social network effect the value of your product or platform increases exponentially if you have users you know or can relate with.
2/ Airbnb - Focus on your value propositions
Airbnb nearly failed in 2009. The company's weekly revenue was $200 and they had less than 2 months of runway.
Enter Paul Graham. The team noticed a pattern in 40 listings. Their website's property photos sucked.
Why?
Because these photos were taken with regular smartphones. Users didn't like the first impression.
Graham suggested traveling to New York to rent a camera, meet with property owners, and replace amateur photos with high-resolution ones.
A week later, the team's weekly revenue doubled to $400, indicating they were on track.
Growth Hack Insights: When selling an “online experience” ensure that your value proposition is aesthetic enough for users to enjoy being associated with them.

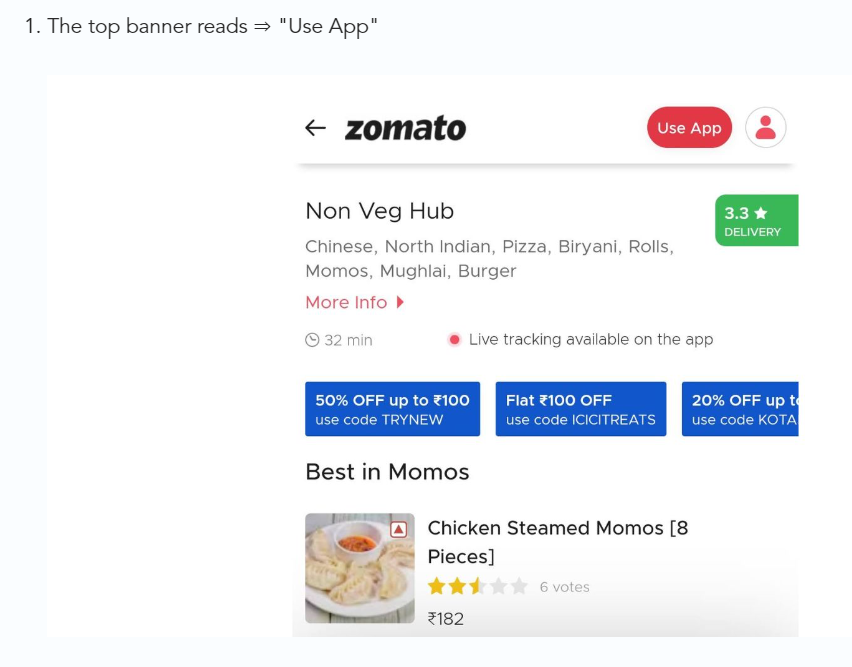
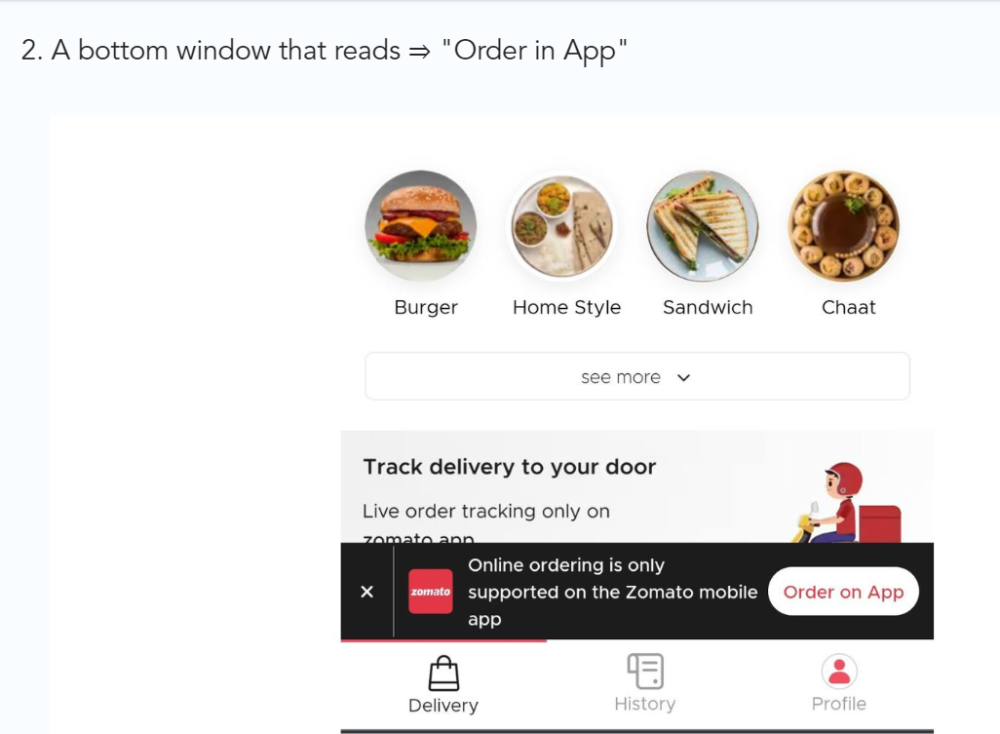
3/ Zomato - A company's smartphone push ensured growth.
Zomato delivers food. User retention was a challenge for the founders. Indian food customers are notorious for switching brands at the drop of a hat.
Zomato wanted users to order food online and repeat orders throughout the week.
Zomato created an attractive website with “near me” keywords for SEO indexing.
Zomato gambled to increase repeat orders. They only allowed mobile app food orders.
Zomato thought mobile apps were stickier. Product innovations in search/discovery/ordering or marketing campaigns like discounts/in-app notifications/nudges can improve user experience.
Zomato went public in 2021 after users kept ordering food online.
Growth Hack Insights: To improve user retention try to build platforms that build user stickiness. Your product and marketing team will do the rest for them.
4/ Hotmail - Signaling helps build premium users.
Ever sent or received an email or tweet with a sign — sent from iPhone?
Hotmail did it first! One investor suggested Hotmail add a signature to every email.
Overnight, thousands joined the company. Six months later, the company had 1 million users.
When serving an existing customer, improve their social standing. Signaling keeps the top 1%.
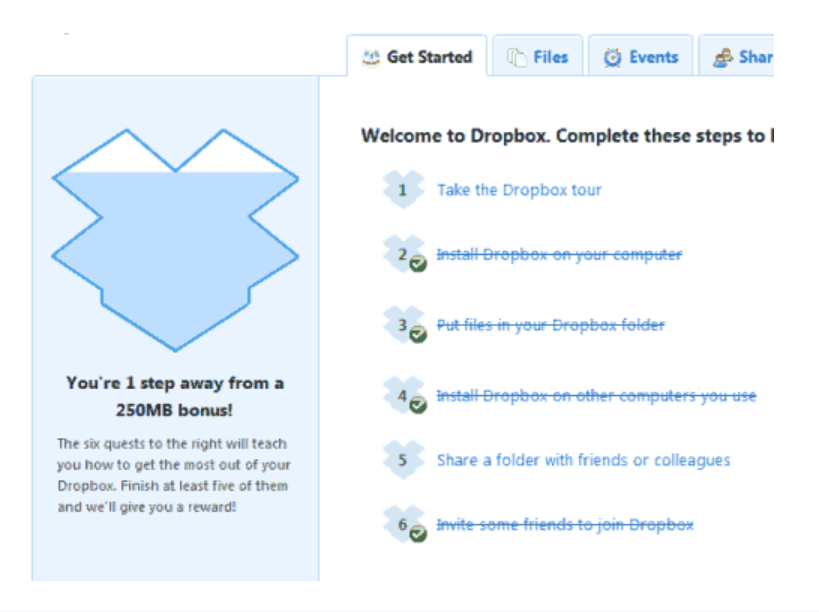
5/ Dropbox - Respect loyal customers
Dropbox is a company that puts people over profits. The company prioritized existing users.
Dropbox rewarded loyal users by offering 250 MB of free storage to anyone who referred a friend. The referral hack helped Dropbox get millions of downloads in its first few months.
Growth Hack Insights: Think of ways to improve the social positioning of your end-user when you are serving an existing customer. Signaling goes a long way in attracting the top 1% to stay.
These experiments weren’t hacks. Hundreds of failed experiments and user research drove these experiments. Scaling up experiments is difficult.
Contact me if you want to grow your startup's user base.

Aure's Notes
3 years ago
I met a man who in just 18 months scaled his startup to $100 million.
A fascinating business conversation.

This week at Web Summit, I had mentor hour.
Mentor hour connects startups with experienced entrepreneurs.
The YC-selected founder who mentored me had grown his company to $100 million in 18 months.
I had 45 minutes to question him.
I've compiled this.
Context
Founder's name is Zack.
After working in private equity, Zack opted to acquire an MBA.
Surrounded by entrepreneurs at a prominent school, he decided to become one himself.
Unsure how to proceed, he bet on two horses.
On one side, he received an offer from folks who needed help running their startup owing to lack of time. On the other hand, he had an idea for a SaaS to start himself.
He just needed to validate it.
Validating
Since Zack's proposal helped companies, he contacted university entrepreneurs for comments.
He contacted university founders.
Once he knew he'd correctly identified the problem and that people were willing to pay to address it, he started developing.
He earned $100k in a university entrepreneurship competition.
His plan was evident by then.
The other startup's founders saw his potential and granted him $400k to launch his own SaaS.
Hiring
He started looking for a tech co-founder because he lacked IT skills.
He interviewed dozens and picked the finest.
As he didn't want to wait for his program to be ready, he contacted hundreds of potential clients and got 15 letters of intent promising they'd join up when it was available.
YC accepted him by then.
He had enough positive signals to raise.
Raising
He didn't say how many VCs he called, but he indicated 50 were interested.
He jammed meetings into two weeks to generate pressure and encourage them to invest.
Seed raise: $11 million.
Selling
His objective was to contact as many entrepreneurs as possible to promote his product.
He first contacted startups by scraping CrunchBase data.
Once he had more money, he started targeting companies with ZoomInfo.
His VC urged him not to hire salespeople until he closed 50 clients himself.
He closed 100 and hired a CRO through a headhunter.
Scaling
Three persons started the business.
He primarily works in sales.
Coding the product was done by his co-founder.
Another person performing operational duties.
He regretted recruiting the third co-founder, who was ineffective (could have hired an employee instead).
He wanted his company to be big, so he hired two young marketing people from a competing company.
After validating several marketing channels, he chose PR.
$100 Million and under
He developed a sales team and now employs 30 individuals.
He raised a $100 million Series A.
Additionally, he stated
He’s been rejected a lot. Like, a lot.
Two great books to read: Steve Jobs by Isaacson, and Why Startups Fail by Tom Eisenmann.
The best skill to learn for non-tech founders is “telling stories”, which means sales. A founder’s main job is to convince: co-founders, employees, investors, and customers. Learn code, or learn sales.
Conclusion
I often read about these stories but hardly take them seriously.
Zack was amazing.
Three things about him stand out:
His vision. He possessed a certain amount of fire.
His vitality. The man had a lot of enthusiasm and spoke quickly and decisively. He takes no chances and pushes the envelope in all he does.
His Rolex.
He didn't do all this in 18 months.
Not really.
He couldn't launch his company without private equity experience.
These accounts disregard entrepreneurs' original knowledge.
Hormozi will tell you how he founded Gym Launch, but he won't tell you how he had a gym first, how he worked at uni to pay for his gym, or how he went to the gym and learnt about fitness, which gave him the idea to open his own.
Nobody knows nothing. If you scale quickly, it's probable because you gained information early.
Lincoln said, "Give me six hours to chop down a tree, and I'll spend four sharpening the axe."
Sharper axes cut trees faster.
You might also like

Sean Bloomfield
3 years ago
How Jeff Bezos wins meetings over
We've all been there: You propose a suggestion to your team at a meeting, and most people appear on board, but a handful or small minority aren't. How can we achieve collective buy-in when we need to go forward but don't know how to deal with some team members' perceived intransigence?
Steps:
Investigate the divergent opinions: Begin by sincerely attempting to comprehend the viewpoint of your disagreeing coworkers. Maybe it makes sense to switch horses in the middle of the race. Have you completely overlooked a blind spot, such as a political concern that could arise as an unexpected result of proceeding? This is crucial to ensure that the person or people feel heard as well as to advance the goals of the team. Sometimes all individuals need is a little affirmation before they fully accept your point of view.
It says a lot about you as a leader to be someone who always lets the perceived greatest idea win, regardless of the originating channel, if after studying and evaluating you see the necessity to align with the divergent position.
If, after investigation and assessment, you determine that you must adhere to the original strategy, we go to Step 2.
2. Disagree and Commit: Jeff Bezos, CEO of Amazon, has had this experience, and Julie Zhuo describes how he handles it in her book The Making of a Manager.
It's OK to disagree when the team is moving in the right direction, but it's not OK to accidentally or purposefully damage the team's efforts because you disagree. Let the team know your opinion, but then help them achieve company goals even if they disagree. Unknown. You could be wrong in today's ever-changing environment.
So next time you have a team member who seems to be dissenting and you've tried the previous tactics, you may ask the individual in the meeting I understand you but I don't want us to leave without you on board I need your permission to commit to this approach would you give us your commitment?

Bloomberg
3 years ago
Expulsion of ten million Ukrainians
According to recent data from two UN agencies, ten million Ukrainians have been displaced.
The International Organization for Migration (IOM) estimates nearly 6.5 million Ukrainians have relocated. Most have fled the war zones around Kyiv and eastern Ukraine, including Dnipro, Zhaporizhzhia, and Kharkiv. Most IDPs have fled to western and central Ukraine.
Since Russia invaded on Feb. 24, 3.6 million people have crossed the border to seek refuge in neighboring countries, according to the latest UN data. While most refugees have fled to Poland and Romania, many have entered Russia.
Internally displaced figures are IOM estimates as of March 19, based on 2,000 telephone interviews with Ukrainians aged 18 and older conducted between March 9-16. The UNHCR compiled the figures for refugees to neighboring countries on March 21 based on official border crossing data and its own estimates. The UNHCR's top-line total is lower than the country totals because Romania and Moldova totals include people crossing between the two countries.
Sources: IOM, UNHCR
According to IOM estimates based on telephone interviews with a representative sample of internally displaced Ukrainians, over 53% of those displaced are women, and over 60% of displaced households have children.

CyberPunkMetalHead
3 years ago
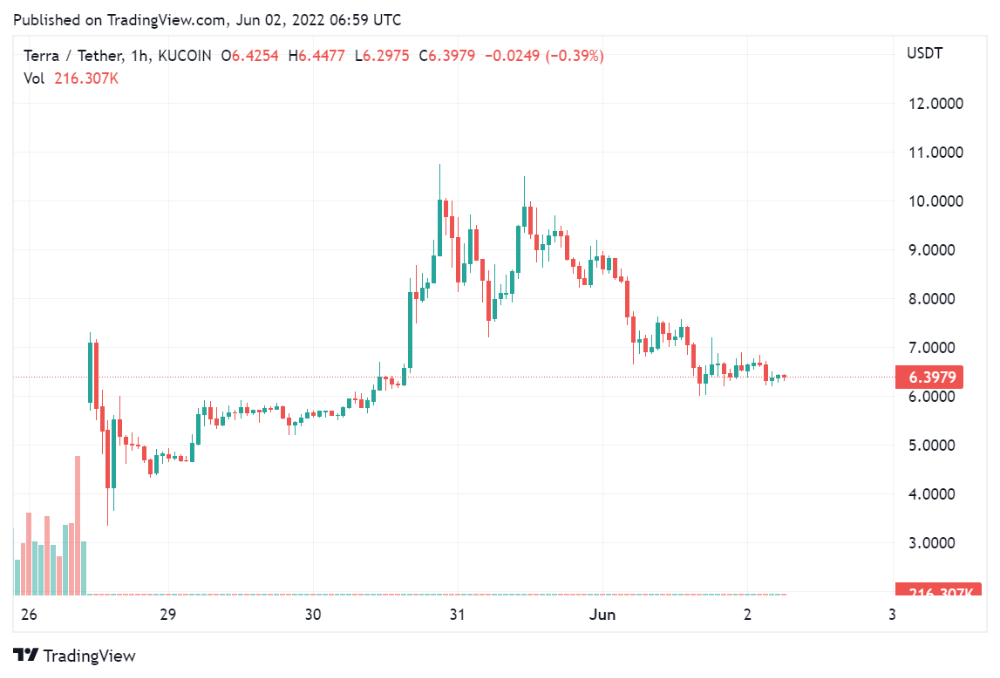
It's all about the ego with Terra 2.0.
UST depegs and LUNA crashes 99.999% in a fraction of the time it takes the Moon to orbit the Earth.
Fat Man, a Terra whistle-blower, promises to expose Do Kwon's dirty secrets and shady deals.
The Terra community has voted to relaunch Terra LUNA on a new blockchain. The Terra 2.0 Pheonix-1 blockchain went live on May 28, 2022, and people were airdropped the new LUNA, now called LUNA, while the old LUNA became LUNA Classic.
Does LUNA deserve another chance? To answer this, or at least start a conversation about the Terra 2.0 chain's advantages and limitations, we must assess its fundamentals, ideology, and long-term vision.
Whatever the result, our analysis must be thorough and ruthless. A failure of this magnitude cannot happen again, so we must magnify every potential breaking point by 10.
Will UST and LUNA holders be compensated in full?
The obvious. First, and arguably most important, is to restore previous UST and LUNA holders' bags.
Terra 2.0 has 1,000,000,000,000 tokens to distribute.
25% of a community pool
Holders of pre-attack LUNA: 35%
10% of aUST holders prior to attack
Holders of LUNA after an attack: 10%
UST holders as of the attack: 20%
Every LUNA and UST holder has been compensated according to the above proposal.
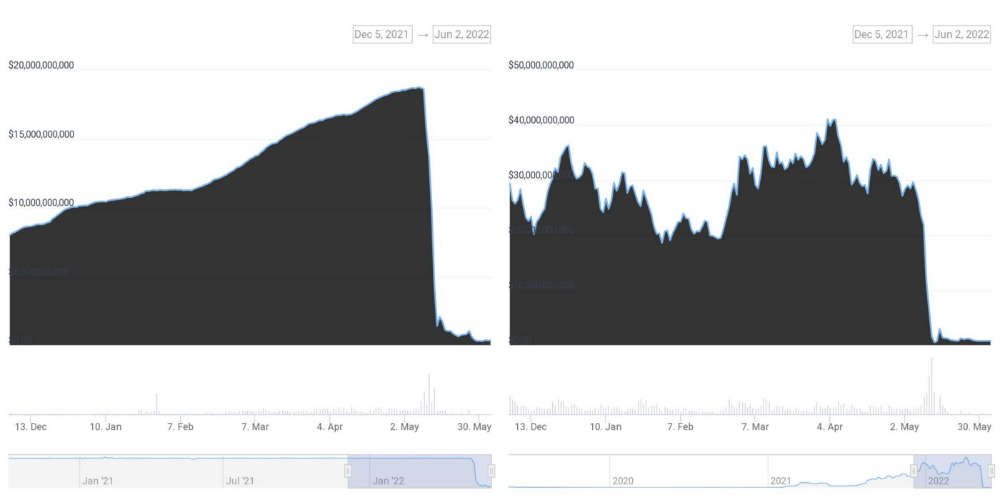
According to self-reported data, the new chain has 210.000.000 tokens and a $1.3bn marketcap. LUNC and UST alone lost $40bn. The new token must fill this gap. Since launch:
LUNA holders collectively own $1b worth of LUNA if we subtract the 25% community pool airdrop from the current market cap and assume airdropped LUNA was never sold.
At the current supply, the chain must grow 40 times to compensate holders. At the current supply, LUNA must reach $240.
LUNA needs a full-on Bull Market to make LUNC and UST holders whole.
Who knows if you'll be whole? From the time you bought to the amount and price, there are too many variables to determine if Terra can cover individual losses.
The above distribution doesn't consider individual cases. Terra didn't solve individual cases. It would have been huge.
What does LUNA offer in terms of value?
UST's marketcap peaked at $18bn, while LUNC's was $41bn. LUNC and UST drove the Terra chain's value.
After it was confirmed (again) that algorithmic stablecoins are bad, Terra 2.0 will no longer support them.
Algorithmic stablecoins contributed greatly to Terra's growth and value proposition. Terra 2.0 has no product without algorithmic stablecoins.
Terra 2.0 has an identity crisis because it has no actual product. It's like Volkswagen faking carbon emission results and then stopping car production.
A project that has already lost the trust of its users and nearly all of its value cannot survive without a clear and in-demand use case.
Do Kwon, how about him?
Oh, the Twitter-caller-poor? Who challenges crypto billionaires to break his LUNA chain? Who dissolved Terra Labs South Korea before depeg? Arrogant guy?
That's not a good image for LUNA, especially when making amends. I think he should step down and let a nicer person be Terra 2.0's frontman.
The verdict
Terra has a terrific community with an arrogant, unlikeable leader. The new LUNA chain must grow 40 times before it can start making up its losses, and even then, not everyone's losses will be covered.
I won't invest in Terra 2.0 or other algorithmic stablecoins in the near future. I won't be near any Do Kwon-related project within 100 miles. My opinion.
Can Terra 2.0 be saved? Comment below.