


5 Bored Apes borrowed to claim $1.1 million in APE tokens
Takeaway
Unknown user took advantage of the ApeCoin airdrop to earn $1.1 million.
He used a flash loan to borrow five BAYC NFTs, claim the airdrop, and repay the NFTs.
Yuga Labs, the creators of BAYC, airdropped ApeCoin (APE) to anyone who owns one of their NFTs yesterday.
For the Bored Ape Yacht Club and Mutant Ape Yacht Club collections, the team allocated 150 million tokens, or 15% of the total ApeCoin supply, worth over $800 million. Each BAYC holder received 10,094 tokens worth $80,000 to $200,000.
But someone managed to claim the airdrop using NFTs they didn't own. They used the airdrop's specific features to carry it out. And it worked, earning them $1.1 million in ApeCoin.
The trick was that the ApeCoin airdrop wasn't based on who owned which Bored Ape at a given time. Instead, anyone with a Bored Ape at the time of the airdrop could claim it. So if you gave someone your Bored Ape and you hadn't claimed your tokens, they could claim them.
The person only needed to get hold of some Bored Apes that hadn't had their tokens claimed to claim the airdrop. They could be returned immediately.
So, what happened?
The person found a vault with five Bored Ape NFTs that hadn't been used to claim the airdrop.
A vault tokenizes an NFT or a group of NFTs. You put a bunch of NFTs in a vault and make a token. This token can then be staked for rewards or sold (representing part of the value of the collection of NFTs). Anyone with enough tokens can exchange them for NFTs.
This vault uses the NFTX protocol. In total, it contained five Bored Apes: #7594, #8214, #9915, #8167, and #4755. Nobody had claimed the airdrop because the NFTs were locked up in the vault and not controlled by anyone.
The person wanted to unlock the NFTs to claim the airdrop but didn't want to buy them outright s o they used a flash loan, a common tool for large DeFi hacks. Flash loans are a low-cost way to borrow large amounts of crypto that are repaid in the same transaction and block (meaning that the funds are never at risk of not being repaid).
With a flash loan of under $300,000 they bought a Bored Ape on NFT marketplace OpenSea. A large amount of the vault's token was then purchased, allowing them to redeem the five NFTs. The NFTs were used to claim the airdrop, before being returned, the tokens sold back, and the loan repaid.
During this process, they claimed 60,564 ApeCoin airdrops. They then sold them on Uniswap for 399 ETH ($1.1 million). Then they returned the Bored Ape NFT used as collateral to the same NFTX vault.
Attack or arbitrage?
However, security firm BlockSecTeam disagreed with many social media commentators. A flaw in the airdrop-claiming mechanism was exploited, it said.
According to BlockSecTeam's analysis, the user took advantage of a "vulnerability" in the airdrop.
"We suspect a hack due to a flaw in the airdrop mechanism. The attacker exploited this vulnerability to profit from the airdrop claim" said BlockSecTeam.
For example, the airdrop could have taken into account how long a person owned the NFT before claiming the reward.
Because Yuga Labs didn't take a snapshot, anyone could buy the NFT in real time and claim it. This is probably why BAYC sales exploded so soon after the airdrop announcement.
More on NFTs & Art
Dmytro Spilka
3 years ago
Why NFTs Have a Bright Future Away from Collectible Art After Punks and Apes
After a crazy second half of 2021 and significant trade volumes into 2022, the market for NFT artworks like Bored Ape Yacht Club, CryptoPunks, and Pudgy Penguins has begun a sharp collapse as market downturns hit token values.
DappRadar data shows NFT monthly sales have fallen below $1 billion since June 2021. OpenSea, the world's largest NFT exchange, has seen sales volume decline 75% since May and is trading like July 2021.
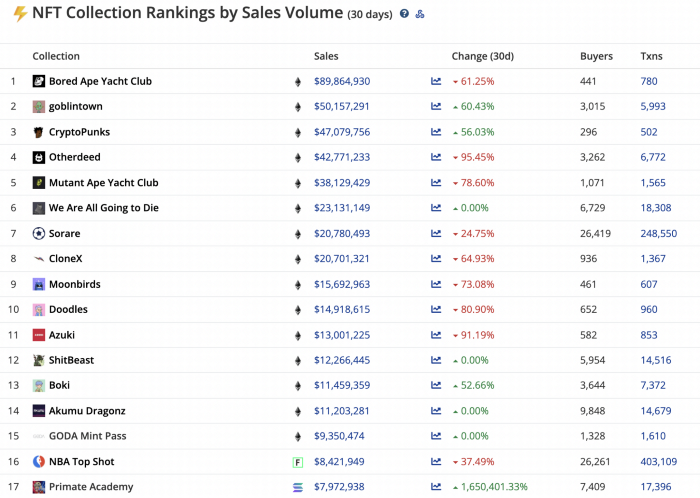
Prices of popular non-fungible tokens have also decreased. Bored Ape Yacht Club (BAYC) has witnessed volume and sales drop 63% and 15%, respectively, in the past month.
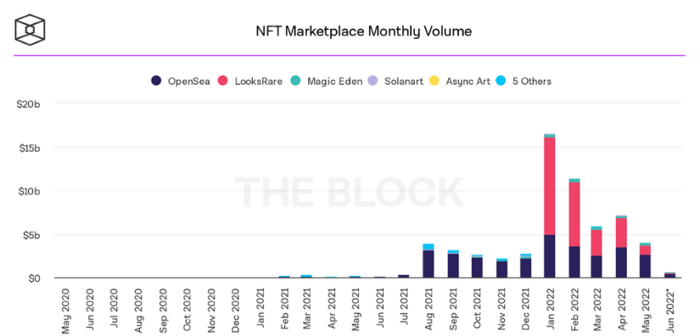
BeInCrypto analysis shows market decline. May 2022 cryptocurrency marketplace volume was $4 billion, according to a news platform. This is a sharp drop from April's $7.18 billion.
OpenSea, a big marketplace, contributed $2.6 billion, while LooksRare, Magic Eden, and Solanart also contributed.
NFT markets are digital platforms for buying and selling tokens, similar stock trading platforms. Although some of the world's largest exchanges offer NFT wallets, most users store their NFTs on their favorite marketplaces.
In January 2022, overall NFT sales volume was $16.57 billion, with LooksRare contributing $11.1 billion. May 2022's volume was $12.57 less than January, a 75% drop, and June's is expected to be considerably smaller.
A World Based on Utility
Despite declines in NFT trading volumes, not all investors are negative on NFTs. Although there are uncertainties about the sustainability of NFT-based art collections, there are fewer reservations about utility-based tokens and their significance in technology's future.
In June, business CEO Christof Straub said NFTs may help artists monetize unreleased content, resuscitate catalogs, establish deeper fan connections, and make processes more efficient through technology.
We all know NFTs can't be JPEGs. Straub noted that NFT music rights can offer more equitable rewards to musicians.
Music NFTs are here to stay if they have real value, solve real problems, are trusted and lawful, and have fair and sustainable business models.
NFTs can transform numerous industries, including music. Market opinion is shifting towards tokens with more utility than the social media artworks we're used to seeing.
While the major NFT names remain dominant in terms of volume, new utility-based initiatives are emerging as top 20 collections.
Otherdeed, Sorare, and NBA Top Shot are NFT-based games that rank above Bored Ape Yacht Club and Cryptopunks.
Users can switch video NFTs of basketball players in NBA Top Shot. Similar efforts are emerging in the non-fungible landscape.
Sorare shows how NFTs can support a new way of playing fantasy football, where participants buy and swap trading cards to create a 5-player team that wins rewards based on real-life performances.
Sorare raised 579.7 million in one of Europe's largest Series B financing deals in September 2021. Recently, the platform revealed plans to expand into Major League Baseball.
Strong growth indications suggest a promising future for NFTs. The value of art-based collections like BAYC and CryptoPunks may be questioned as markets become diluted by new limited collections, but the potential for NFTs to become intrinsically linked to tangible utility like online gaming, music and art, and even corporate reward schemes shows the industry has a bright future.

Sea Launch
3 years ago
A guide to NFT pre-sales and whitelists
Before we dig through NFT whitelists and pre-sales, if you know absolutely nothing about NFTs, check our NFT Glossary.
What are pre-sales and whitelists on NFTs?
An NFT pre-sale, as the name implies, allows community members or early supporters of an NFT project to mint before the public, usually via a whitelist or mint pass.
Coin collectors can use mint passes to claim NFTs during the public sale. Because the mint pass is executed by “burning” an NFT into a specific crypto wallet, the collector is not concerned about gas price spikes.
A whitelist is used to approve a crypto wallet address for an NFT pre-sale. In a similar way to an early access list, it guarantees a certain number of crypto wallets can mint one (or more) NFT.
New NFT projects can do a pre-sale without a whitelist, but whitelists are good practice to avoid gas wars and a fair shot at minting an NFT before launching in competitive NFT marketplaces like Opensea, Magic Eden, or CNFT.
Should NFT projects do pre-sales or whitelists? 👇
The reasons to do pre-sales or a whitelist for NFT creators:
Time the market and gain traction.
Pre-sale or whitelists can help NFT projects gauge interest early on.
Whitelist spots filling up quickly is usually a sign of a successful launch, though it does not guarantee NFT longevity (more on that later). Also, full whitelists create FOMO and momentum for the public sale among non-whitelisted NFT collectors.
If whitelist signups are low or slow, projects may need to work on their vision, community, or product. Or the market is in a bear cycle. In either case, it aids NFT projects in market timing.
Reward the early NFT Community members.
Pre-sale and whitelists can help NFT creators reward early supporters.
First, by splitting the minting process into two phases, early adopters get a chance to mint one or more NFTs from their collection at a discounted or even free price.
Did you know that BAYC started at 0.08 eth each? A serum that allowed you to mint a Mutant Ape has become as valuable as the original BAYC.
(2) Whitelists encourage early supporters to help build a project's community in exchange for a slot or status. If you invite 10 people to the NFT Discord community, you get a better ranking or even a whitelist spot.
Pre-sale and whitelisting have become popular ways for new projects to grow their communities and secure future buyers.
Prevent gas wars.
Most new NFTs are created on the Ethereum blockchain, which has the highest transaction fees (also known as gas) (Solana, Cardano, Polygon, Binance Smart Chain, etc).
An NFT public sale is a gas war when a large number of NFT collectors (or bots) try to mint an NFT at the same time.
Competing collectors are willing to pay higher gas fees to prioritize their transaction and out-price others when upcoming NFT projects are hyped and very popular.
Pre-sales and whitelisting prevent gas wars by breaking the minting process into smaller batches of members or season launches.
The reasons to do pre-sales or a whitelists for NFT collectors:
How do I get on an NFT whitelist?
- Popular NFT collections act as a launchpad for other new or hyped NFT collections.
Example: Interfaces NFTs gives out 100 whitelist spots to Deadfellaz NFTs holders. Both NFT projects win. Interfaces benefit from Deadfellaz's success and brand equity.
In this case, to get whitelisted NFT collectors need to hold that specific NFT that is acting like a launchpad.
- A NFT studio or collection that launches a new NFT project and rewards previous NFT holders with whitelist spots or pre-sale access.
The whitelist requires previous NFT holders or community members.
NFT Alpha Groups are closed, small, tight-knit Discord servers where members share whitelist spots or giveaways from upcoming NFTs.
The benefit of being in an alpha group is getting information about new NFTs first and getting in on pre-sale/whitelist before everyone else.
There are some entry barriers to alpha groups, but if you're active in the NFT community, you'll eventually bump into, be invited to, or form one.
- A whitelist spot is awarded to members of an NFT community who are the most active and engaged.
This participation reward is the most democratic. To get a chance, collectors must work hard and play to their strengths.
Whitelisting participation examples:
- Raffle, games and contest: NFT Community raffles, games, and contests. To get a whitelist spot, invite 10 people to X NFT Discord community.
- Fan art: To reward those who add value and grow the community by whitelisting the best fan art and/or artists is only natural.
- Giveaways: Lucky number crypto wallet giveaways promoted by an NFT community. To grow their communities and for lucky collectors, NFT projects often offer free NFT.
- Activate your voice in the NFT Discord Community. Use voice channels to get NFT teams' attention and possibly get whitelisted.
The advantage of whitelists or NFT pre-sales.
Chainalysis's NFT stats quote is the best answer:
“Whitelisting isn’t just some nominal reward — it translates to dramatically better investing results. OpenSea data shows that users who make the whitelist and later sell their newly-minted NFT gain a profit 75.7% of the time, versus just 20.8% for users who do so without being whitelisted. Not only that, but the data suggests it’s nearly impossible to achieve outsized returns on minting purchases without being whitelisted.” Full report here.
Sure, it's not all about cash. However, any NFT collector should feel secure in their investment by owning a piece of a valuable and thriving NFT project. These stats help collectors understand that getting in early on an NFT project (via whitelist or pre-sale) will yield a better and larger return.
The downsides of pre-sales & whitelists for NFT creators.
Pre-sales and whitelist can cause issues for NFT creators and collectors.
NFT flippers
NFT collectors who only want to profit from early minting (pre-sale) or low mint cost (via whitelist). To sell the NFT in a secondary market like Opensea or Solanart, flippers go after the discounted price.
For example, a 1000 Solana NFT collection allows 100 people to mint 1 Solana NFT at 0.25 SOL. The public sale price for the remaining 900 NFTs is 1 SOL. If an NFT collector sells their discounted NFT for 0.5 SOL, the secondary market floor price is below the public mint.
This may deter potential NFT collectors. Furthermore, without a cap in the pre-sale minting phase, flippers can get as many NFTs as possible to sell for a profit, dumping them in secondary markets and driving down the floor price.
Hijacking NFT sites, communities, and pre-sales phase
People try to scam the NFT team and their community by creating oddly similar but fake websites, whitelist links, or NFT's Discord channel.
Established and new NFT projects must be vigilant to always make sure their communities know which are the official links, how a whitelist or pre-sale rules and how the team will contact (or not) community members.
Another way to avoid the scams around the pre-sale phase, NFT projects opt to create a separate mint contract for the whitelisted crypto wallets and then another for the public sale phase.
Scam NFT projects
We've seen a lot of mid-mint or post-launch rug pulls, indicating that some bad NFT projects are trying to scam NFT communities and marketplaces for quick profit. What happened to Magic Eden's launchpad recently will help you understand the scam.
We discussed the benefits and drawbacks of NFT pre-sales and whitelists for both projects and collectors.
Finally, some practical tools and tips for finding new NFTs 👇
Tools & resources to find new NFT on pre-sale or to get on a whitelist:
In order to never miss an update, important pre-sale dates, or a giveaway, create a Tweetdeck or Tweeten Twitter dashboard with hyped NFT project pages, hashtags ( #NFTGiveaways , #NFTCommunity), or big NFT influencers.
Search for upcoming NFT launches that have been vetted by the marketplace and try to get whitelisted before the public launch.
Save-timing discovery platforms like sealaunch.xyz for NFT pre-sales and upcoming launches. How can we help 100x NFT collectors get projects? A project's official social media links, description, pre-sale or public sale dates, price and supply. We're also working with Dune on NFT data analysis to help NFT collectors make better decisions.
Don't invest what you can't afford to lose because a) the project may fail or become rugged. Find NFTs projects that you want to be a part of and support.
Read original post here
Sea Launch
3 years ago
📖 Guide to NFT terms: an NFT glossary.
NFT lingo can be overwhelming. As the NFT market matures and expands so does its own jargon, slang, colloquialisms or acronyms.
This ever-growing NFT glossary goal is to unpack key NFT terms to help you better understand the NFT market or at least not feel like a total n00b in a conversation about NFTs on Reddit, Discord or Twitter.
#
1:1 Art
Art where each piece is one of a kind (1 of 1). Unlike 10K projects, PFP or Generative Art collections have a cap of NFTs released that can range from a few hundreds to 10K.
1/1 of X
Contrary to 1:1 Art, 1/1 of X means each NFT is unique, but part of a large and cohesive collection. E.g: Fidenzas by Tyler Hobbs or Crypto Punks (each Punk is 1/1 of 10,000).
10K Project
A type of NFT collection that consists of approximately 10,000 NFTs (but not strictly).
A
AB
ArtBlocks, the most important platform for generative art currently.
AFAIK
As Far As I Know.
Airdrop
Distribution of an NFT token directly into a crypto wallet for free. Can be used as a marketing campaign or as scam by airdropping fake tokens to empty someone’s wallet.
Alpha
The first or very primitive release of a project. Or Investment term to track how a certain investment outdoes the market. E.g: Alpha of 1.0 = 1% improvement or Alpha of 20.0 = 20% improvement.
Altcoin
Any other crypto that is not Bitcoin. Bitcoin Maximalists can also refer to them as shitcoins.
AMA
Ask Me Anything. NFT creators or artists do sessions where anyone can ask questions about the NFT project, team, vision, etc. Usually hosted on Discord, but also on Reddit or even Youtube.
Ape
Someone can be aping, ape in or aped on an NFT meaning someone is taking a large position relative to its own portfolio size. Some argue that when someone apes can mean that they're following the hype, out of FOMO or without due diligence. Not related directly to the Bored Ape Yatch Club.
ATH
All-Time High. When a NFT project or token reaches the highest price to date.
Avatar project
An NFT collection that consists of avatars that people can use as their profile picture (see PFP) in social media to show they are part of an NFT community like Crypto Punks.
Axie Infinity
ETH blockchain-based game where players battle and trade Axies (digital pets). The main ERC-20 tokens used are Axie Infinity Shards (AXS) and Smooth Love Potions (formerly Small Love Potion) (SLP).
Axie Infinity Shards
AXS is an Eth token that powers the Axie Infinity game.
B
Bag Holder
Someone who holds its position in a crypto or keeps an NFT until it's worthless.
BAYC
Bored Ape Yacht Club. A very successful PFP 1/1 of 10,000 individual ape characters collection. People use BAYC as a Twitter profile picture to brag about being part of this NFT community.
Bearish
Borrowed finance slang meaning someone is doubtful about the current market and that it will crash.
Bear Market
When the Crypto or NFT market is going down in value.
Bitcoin (BTC)
First and original cryptocurrency as outlined in a whitepaper by the anonymous creator(s) Satoshi Nakamoto.
Bitcoin Maximalist
Believer that Bitcoin is the only cryptocurrency needed. All other cryptocurrencies are altcoins or shitcoins.
Blockchain
Distributed, decentralized, immutable database that is the basis of trust in Web 3.0 technology.
Bluechip
When an NFT project has a long track record of success and its value is sustained over time, therefore considered a solid investment.
BTD
Buy The Dip. A bear market can be an opportunity for crypto investors to buy a crypto or NFT at a lower price.
Bullish
Borrowed finance slang meaning someone is optimistic that a market will increase in value aka moon.
Bull market
When the Crypto or NFT market is going up and up in value.
Burn
Common crypto strategy to destroy or delete tokens from the circulation supply intentionally and permanently in order to limit supply and increase the value.
Buying on secondary
Whenever you don’t mint an NFT directly from the project, you can always buy it in secondary NFT marketplaces like OpenSea. Most NFT sales are secondary market sales.
C
Cappin or Capping
Slang for lying or faking. Opposed to no cap which means “no lie”.
Coinbase
Nasdaq listed US cryptocurrency exchange. Coinbase Wallet is one of Coinbase’s products where users can use a Chrome extension or app hot wallet to store crypto and NFTs.
Cold wallet
Otherwise called hardware wallet or cold storage. It’s a physical device to store your cryptocurrencies and/or NFTs offline. They are not connected to the Internet so are at less risk of being compromised.
Collection
A set of NFTs under a common theme as part of a NFT drop or an auction sale in marketplaces like OpenSea or Rarible.
Collectible
A collectible is an NFT that is a part of a wider NFT collection, usually part of a 10k project, PFP project or NFT Game.
Collector
Someone who buys NFTs to build an NFT collection, be part of a NFT community or for speculative purposes to make a profit.
Cope
The opposite of FOMO. When someone doesn’t buy an NFT because one is still dealing with a previous mistake of not FOMOing at a fraction of the price. So choosing to stay out.
Consensus mechanism
Method of authenticating and validating a transaction on a blockchain without the need to trust or rely on a central authority. Examples of consensus mechanisms are Proof of Work (PoW) or Proof of Stake (PoS).
Cozomo de’ Medici
Twitter alias used by Snoop Dogg for crypto and NFT chat.
Creator
An NFT creator is a person that creates the asset for the NFT idea, vision and in many cases the art (e.g. a jpeg, audio file, video file).
Crowsale
Where a crowdsale is the sale of a token that will be used in the business, an Initial Coin Offering (ICO) is the sale of a token that’s linked to the value of the business. Buying an ICO token is akin to buying stock in the company because it entitles you a share of the earnings and profits. Also, some tokens give you voting rights similar to holding stock in the business. The US Securities and Exchange Commission recently ruled that ICOs, but not crowdselling, will be treated as the sale of a security. This basically means that all ICOs must be registered like IPOs and offered only to accredited investors. This dramatically increases the costs and limits the pool of potential buyers.
Crypto Bags/Bags
Refers to how much cryptocurrencies someone holds, as in their bag of coins.
Cryptocurrency
The native coin of a blockchain (or protocol coin), secured by cryptography to be exchanged within a Peer 2 Peer economic system. E.g: Bitcoin (BTC) for the Bitcoin blockchain, Ether (ETH) for the Ethereum blockchain, etc.
Crypto community
The community of a specific crypto or NFT project. NFT communities use Twitter and Discord as their primary social media to hang out.
Crypto exchange
Where someone can buy, sell or trade cryptocurrencies and tokens.
Cryptography
The foundation of blockchain technology. The use of mathematical theory and computer science to encrypt or decrypt information.
CryptoKitties
One of the first and most popular NFT based blockchain games. In 2017, the NFT project almost broke the Ethereum blockchain and increased the gas prices dramatically.
CryptoPunk
Currently one of the most valuable blue chip NFT projects. It was created by Larva Labs. Crypto Punk holders flex their NFT as their profile picture on Twitter.
CT
Crypto Twitter, the crypto-community on Twitter.
Cypherpunks
Movement in the 1980s, advocating for the use of strong cryptography and privacy-enhancing technologies as a route to social and political change. The movement contributed and shaped blockchain tech as we know today.
D
DAO
Stands for Decentralized Autonomous Organization. When a NFT project is structured like a DAO, it grants all the NFT holders voting rights, control over future actions and the NFT’s project direction and vision. Many NFT projects are also organized as DAO to be a community-driven project.
Dapp
Mobile or web based decentralized application that interacts on a blockchain via smart contracts. E.g: Dapp is the frontend and the smart contract is the backend.
DCA
Acronym for Dollar Cost Averaging. An investment strategy to reduce the impact of crypto market volatility. E.g: buying into a crypto asset on a regular monthly basis rather than a big one time purchase.
Ded
Abbreviation for dead like "I sold my Punk for 90 ETH. I am ded."
DeFi
Short for Decentralized Finance. Blockchain alternative for traditional finance, where intermediaries like banks or brokerages are replaced by smart contracts to offer financial services like trading, lending, earning interest, insure, etc.
Degen
Short for degenerate, a gambler who buys into unaudited or unknown NFT or DeFi projects, without proper research hoping to chase high profits.
Delist
No longer offer an NFT for sale on a secondary market like Opensea. NFT Marketplaces can delist an NFT that infringes their rules. Or NFT owners can choose to delist their NFTs (has long as they have sufficient funds for the gas fees) due to price surges to avoid their NFT being bought or sold for a higher price.
Derivative
Projects derived from the original project that reinforces the value and importance of the original NFT. E.g: "alternative" punks.
Dev
A skilled professional who can build NFT projects using smart contracts and blockchain technology.
Dex
Decentralised Exchange that allows for peer-to-peer trustless transactions that don’t rely on a centralized authority to take place. E.g: Uniswap, PancakeSwap, dYdX, Curve Finance, SushiSwap, 1inch, etc.
Diamond Hands
Someone who believes and holds a cryptocurrency or NFT regardless of the crypto or NFT market fluctuations.
Discord
Chat app heavily used by crypto and NFT communities for knowledge sharing and shilling.
DLT
Acronym for Distributed Ledger Technology. It’s a protocol that allows the secure functioning of a decentralized database, through cryptography. This technological infrastructure scraps the need for a central authority to keep in check manipulation or exploitation of the network.
Dog coin
It’s a memecoin based on the Japanese dog breed, Shiba Inu, first popularised by Dogecoin. Other notable coins are Shiba Inu or Floki Inu. These dog coins are frequently subjected to pump and dumps and are extremely volatile. The original dog coin DOGE was created as a joke in 2013. Elon Musk is one of Dogecoin's most famous supporters.
Doxxed/Doxed
When the identity of an NFT team member, dev or creator is public, known or verifiable. In the NFT market, when a NFT team is doxed it’s a usually sign of confidence and transparency for NFT collectors to ensure they will not be scammed for an anonymous creator.
Drop
The release of an NFT (single or collection) into the NFT market.
DYOR
Acronym for Do Your Own Research. A common expression used in the crypto or NFT community to disclaim responsibility for the financial/strategy advice someone is providing the community and to avoid being called out by others in theNFT or crypto community.
E
EIP-1559 EIP
Referring to Ethereum Improvement Proposal 1559, commonly known as the London Fork. It’s an upgrade to the Ethereum protocol code to improve the blockchain security and scalability. The major change consists in shifting from a proof-of-work consensus mechanism (PoW) to a low energy and lower gas fees proof-of-stake system (PoS).
ERC-1155
Stands for Ethereum Request for Comment-1155. A multi-token standard that can represent any number of fungible (ERC-20) and non-fungible tokens (ERC-721).
ERC-20
Ethereum Request for Comment-20 is a standard defining a fungible token like a cryptocurrency.
ERC-721
Ethereum Request for Comment-721 is a standard defining a non-fungible token (NFT).
ETH
Aka Ether, the currency symbol for the native cryptocurrency of the Ethereum blockchain.
ETH2.0
Also known as the London Fork or EIP-1559 EIP. It’s an upgrade to the Ethereum network to improve the network’s security and scalability. The most dramatic change is the shift from the proof-of-work consensus mechanism (PoW) to proof-of-stake system (PoS).
Ether
Or ETH, the native cryptocurrency of the Ethereum blockchain.
Ethereum
Network protocol that allows users to create and run smart contracts over a decentralized network.
F
FCFS
Acronym for First Come First Served. Commonly used strategy in a NFT collection drop when the demand surpasses the supply.
Few
Short for "few understand". Similar to the irony behind the "probably nothing" expression. Like X person bought into a popular NFT, because it understands its long term value.
Fiat Currencies or Money
National government-issued currencies like the US Dollar (USD), Euro (EUR) or Great British Pound (GBP) that are not backed by a commodity like silver or gold. FIAT means an authoritative or arbitrary order like a government decree.
Flex
Slang for showing off. In the crypto community, it’s a Lamborghini or a gold Rolex. In the NFT world, it’s a CryptoPunk or BAYC PFP on Twitter.
Flip
Quickly buying and selling crypto or NFTs to make a profit.
Flippening
Colloquial expression coined in 2017 for when Ethereum’s market capitalisation surpasses Bitcoin’s.
Floor Price
It means the lowest asking price for an NFT collection or subset of a collection on a secondary market like OpenSea.
Floor Sweep
Refers when a NFT collector or investor buys all the lowest listed NFTs on a secondary NFT marketplace.
FOMO
Acronym for Fear Of Missing Out. Buying a crypto or NFT out of fear of missing out on the next big thing.
FOMO-in
Buying a crypto or NFT regardless if it's at the top of the market for FOMO.
Fractionalize
Turning one NFT like a Crypto Punk into X number of fractions ERC-20 tokens that prove ownership of that Punk. This allows for i) collective ownership of an NFT, ii) making an expensive NFT affordable for the common NFT collector and iii) adds more liquidity to a very illiquid NFT market.
FR
Abbreviation for For Real?
Fren
Means Friend and what people in the NFT community call each other in an endearing and positive way.
Foundation
An exclusive, by invitation only, NFT marketplace that specializes in NFT art.
Fungible
Means X can be traded for another X and still hold the same value. E.g: My dollars = your dollars. My 1 ether = your 1 ether. My casino chip = your casino chip. On Ethereum, fungible tokens are defined by the ERC-20 standard.
FUD
Acronym for Fear Uncertainty Doubt. It can be a) when someone spreads negative and sometimes false news to discredit a certain crypto or NFT project. Or b) the overall negative feeling regarding the future of the NFT/Crypto project or market, especially when going through a bear market.
Fudder
Someone who has FUD or engages in FUD about a NFT project.
Fudding your own bags
When an NFT collector or crypto investor speaks negatively about an NFT or crypto project he/she has invested in or has a stake in. Usually negative comments about the team or vision.
G
G
Means Gangster. A term of endearment used amongst the NFT Community.
Gas/Gas fees/Gas prices
The fee charged to complete a transaction in a blockchain. These gas prices vary tremendously between the blockchains, the consensus mechanism used to validate transactions or the number of transactions being made at a specific time.
Gas war
When a lot of NFT collectors (or bots) are trying to mint an NFT at once and therefore resulting in gas price surge.
Generative art
Artwork that is algorithmically created by code with unique traits and rarity.
Genesis drop
It refers to the first NFT drop a creator makes on an NFT auction platform.
GG
Interjection for Good Game.
GM
Interjection for Good Morning.
GMI
Acronym for Going to Make It. Opposite of NGMI (NOT Going to Make It).
GOAT
Acronym for Greatest Of All Time.
GTD
Acronym for Going To Dust. When a token or NFT project turns out to be a bad investment.
GTFO
Get The F*ck Out, as in “gtfo with that fud dude” if someone is talking bull.
GWEI
One billionth of an Ether (ETH) also known as a Shannon / Nanoether / Nano — unit of account used to price Ethereum gas transactions.
H
HEN (Hic Et Nunc)
A popular NFT art marketplace for art built on the Tezos blockchain. Big NFT marketplace for inexpensive NFTs but not a very user-friendly UI/website.
HODL
Misspelling of HOLD coined in an old Reddit post. Synonym with “Hold On for Dear Life” meaning hold your coin or NFT until the end, whether that they’ll moon or dust.
Hot wallet
Wallets connected to the Internet, less secure than cold wallet because they’re more susceptible to hacks.
Hype
Term used to show excitement or anticipation about an upcoming crypto project or NFT.
I
ICO
Acronym for Initial Coin Offering. It’s the crypto equivalent to a stocks’ IPO (Initial Public Offering) but with far less scrutiny or regulation (leading to a lot of scams). ICO’s are a popular way for crypto projects to raise funds.
IDO
Acronym for Initial Dex Offering. To put it simply it means to launch NFTs or tokens via a decentralized liquidity exchange. It’s a common fundraising method used by upcoming crypto or NFT projects. Many consider IDOs a far better fundraising alternative to ICOs.
IDK
Acronym for I Don’t Know.
IDEK
Acronym for I Don’t Even Know.
Imma
Short for I’m going to be.
IRL
Acronym for In Real Life. Refers to the physical world outside of the online/virtual world of crypto, NFTs, gaming or social media.
IPFS
Acronym for Interplanetary File System. A peer-to-peer file storage system using hashes to recall and preserve the integrity of the file, commonly used to store NFTs outside of the blockchain.
It’s Money Laundering
Someone can use this expression to suggest that NFT prices aren’t real and that actually people are using NFTs to launder money, without providing much proof or explanation on how it works.
IYKYK
Stands for If You Know, You Know This. Similar to the expression "few", used when someone buys into a popular crypto or NFT project, slightly because of FOMO but also because it believes in its long term value.
J
JPEG/JPG
File format typically used to encode NFT art. Some people also use Jpeg to mock people buying NFTs as in “All that money for a jpeg”.
K
KMS
Short for Kill MySelf.
L
Larva Labs/ LL
NFT Creators behind the popular NFT projects like Cryptopunks,Meebits or Autoglyphs.
Laser eyes
Bitcoin meme signalling support for BTC and/or it will break the $100k per coin valuation.
LFG
Acronym for Let’s F*cking Go! A common rallying call used in the crypto or NFT community to lead people into buying an NFT or a crypto.
Liquidity
Term that means that a token or NFT has a high volume activity in the crypto/NFT market. It’s easily sold and resold. But usually the NFT market it’s illiquid when compared to the general crypto market, due to the non-fungibility nature of an NFT (there are less buyers for every NFTs out there).
LMFAO
Stands for Laughing My F*cking Ass Off.
Looks Rare
Ironic expression commonly used in the NFT Community. Rarity is a driver of an NFT’s value.
London Hard Fork
Known as EIP-1559, was an Ethereum code upgrade proposal designed to improve the blockchain security and scalability. It’s major change is to shift from PoW to PoS consensus mechanism.
Long run
Means someone is committed to the NFT market or an NFT project in the long term.
M
Maximalist
Typically refers to Bitcoin Maximalists. People who only believe that Bitcoin is the most secure and resilient blockchain. For Maximalists, all other cryptocurrencies are shitcoins therefore a waste of time, development and money.
McDonald's
Common and ironic expression amongst the crypto community. It means that Mcdonald’s is always a valid backup plan or career in the case all cryptocurrencies crash and disappear.
Meatspace
Synonymous with IRL - In Real Life.
Memecoin
Cryptocurrency like Dogecoin that is based on an internet joke or meme.
Metamask
Popular crypto hot wallet platform to store crypto and NFTs.
Metaverse
Term was coined by writer Neal Stephenson in the 1992 dystopian novel “Snow Crash”. It’s an immersive and digital place where people interact via their avatars. Big tech players like Meta (formerly known as Facebook) and other independent players have been designing their own version of a metaverse. NFTs can have utility for users like buying, trading, winning, accessing, experiencing or interacting with things inside a metaverse.
Mfer
Short for “mother fker”.
Miners
Single person or company that mines one or more cryptocurrencies like Bitcoin or Ethereum. Both blockchains need computing power for their Proof of Work consensus mechanism. Miners provide the computing power and receive coins/tokens in return as payment.
Mining
Mining is the process by which new tokens enter in circulation as for example in the Bitcoin blockchain. Also, mining ensures the validity of new transactions happening in a given blockchain that uses the PoW consensus mechanism. Therefore, the ones who mine are rewarded by ensuring the validity of a blockchain.
Mint/Minting
Mint an NFT is the act of publishing your unique instance to a specific blockchain like Ethereum or Tezos blockchain. In simpler terms, a creator is adding a one-of-kind token (NFT) into circulation in a specific blockchain.
Once the NFT is minted - aka created - NFT collectors can i) direct mint, therefore purchase the NFT by paying the specified amount directly into the project’s wallet. Or ii) buy it via an intermediary like an NFT marketplace (e.g: OpenSea, Foundation, Rarible, etc.). Later, the NFT owner can choose to resell the NFT, most NFT creators set up a royalty for every time their NFT is resold.
Minting interval
How often an NFT creator can mint or create tokens.
MOAR
A misspelling that means “more”.
Moon/Mooning
When a coin (e.g. ETH), or token, like an NFT goes exponential in price and the price graph sees a vertical climb. Crypto or NFT users then use the expression that “X token is going to the moon!”.
Moon boys
Slang for crypto or NFT holders who are looking to pump the price dramatically - taking a token to the moon - for short term gains and with no real long term vision or commitment.
N
Never trust, always verify
Treat everyone or every project like something potentially malicious.
New coiner
Crypto slang for someone new to the cryptocurrency space. Usually newcomers can be more susceptible to FUD or scammers.
NFA
Acronym for Not Financial Advice.
NFT
Acronym for Non-Fungible Token. The type of token that can be created, bought, sold, resold and viewed in different dapps. The ERC-721 smart contract standard (Ethereum blockchain) is the most popular amongst NFTs.
NFT Marketplace / NFT Auction platform
Platforms where people can sell and buy NFTs, either via an auction or pay the seller’s price. The largest NFT marketplace is OpenSea. But there are other popular NFT marketplace examples like Foundation, SuperRare, Nifty Gateway, Rarible, Hic et Nunc (HeN), etc.
NFT Whale
A NFT collector or investor who buys a large amount of NFTs.
NGMI
Acronym for Not Going to Make It. For example, something said to someone who has paper hands.
NMP
Acronym for Not My Problem.
Nocoiner
It can be someone who simply doesn’t hold cryptocurrencies, mistrust the crypto market or believes that crypto is either a scam or a ponzi scheme.
Noob/N00b/Newbie
Slang for someone new or not experienced in cryptocurrency or NFTs. These people are more susceptible to scams, drawn into pump and dumps or getting rekt on bad coins.
Normie/Normy
Similar expression for a nocoiner.
NSFW
Acronym for Not Suitable For Work. Referring to online content inappropriate for viewing in public or at work. It began as mostly a tag for sexual content, nudity, or violence, but it has envolved to range a number of other topics that might be delicate or trigger viewers.
Nuclear NFTs
An NFT or collectible with more than 1,000 owners. For the NFT to be sold or resold, every co-owners must give their permission beforehand. Otherwise, the NFT transaction can’t be made.
O
OG
Acronym for Original Gangster and it popularized by 90s Hip Hop culture. It means the first, the original or the person who has been around since the very start and earned respect in the community. In NFT terms, Cryptopunks are the OG of NFTs.
On-chain vs Off-chain
An on-chain NFT is when the artwork (like a jpeg, video or music file) is stored directly into the blockchain making it more secure and less susceptible to being stolen. But, note that most blockchains can only store small amounts of data.
Off-chain NFTs means that the high quality image, music or video file is not stored in the blockchain. But, the NFT data is stored on an external party like a) a centralized server, highly vulnerable to the server being shut down/exploited. Or b) an InterPlanetary File System (IPFS), also an external party but more secure way of finding data because it utilizes a distributed, decentralized system.
OpenSea
By far the largest NFT marketplace in the world, currently.
P
Paper Hands
A crypto or NFT holder who is permeable to negative market sentiment or FUD. And does not hold their crypto or NFT for long. Expression used to describe someone who sells as soon as NFTs enter a bear market.
PFP
Stands for Picture For Profile. Twitter users who hold popular NFTs like Crypto Punk or BAYC use their punk or monkey avatar as their profile picture.
POAP NFT
Stands for Proof of Attendance Protocol. These types of NFTs are awarded to attendees of events, regardless if they’re physical or virtual, as proof you attended.
PoS
Stands for Proof of Stake. A consensus mechanism used by blockchains like Bitcoin or Ethereum to achieve agreement, trust and security in every transaction and keep the integrity of the blockchain intact. PoS mechanisms are considered more environmentally friendly than PoW as they’re lower energy and in emissions.
PoW
Stands for Proof of Work. A consensus mechanism used by blockchains like Bitcoin to achieve agreement, trust and security and keep the transactional integrity of the blockchain intact. PoW mechanism requires a lot of computational power, therefore uses more energy resources and higher CO2 emissions than the PoS mechanism.
Private Key
It can be similar to a password. It’s a secret number that allows users to access their cold or hot wallet funds, prove ownership of a certain address and sign transactions on the blockchain.
It’s not advisable to share a private key with anyone as it makes a person vulnerable to thefts. In case someone loses or forgets its private key, it can use a recovery phrase to restore access to a crypto or NFT wallet.
Pre-mine
A term used in crypto to refer to the act of creating a set amount of tokens before their public launch. It can also be known as a Genesis Sale and is usually associated with Initial Coin Offerings (ICOs) in order to compensate founders, developers or early investors.
Probably nothing
It’s an ironic expression used by NFT enthusiasts to refer to an important or soon to be big news, project or person in the NFT space. Meaning when someone says probably nothing it actually means that it is probably something.
Protocol Coin
Stands for the native coin of a blockchain. As in Ether for the Ethereum blockchain or BTC on the Bitcoin blockchain.
Pump & Dump
The term pump means when a person or a group of people buy or convince others to buy large quantities of a crypto or an NFT with the single goal to drive the price to a peak. When the price peaks, these people sell their position high and for a hefty profit, therefore dumping the price and leaving other slower investors or newbies rekt or at a loss.
R
Rarity
Rarity in NFT terms refers to how rare an NFT is. The rarity can be defined by the number of traits, scarcity or properties of an NFT.
Reaching
Slang for an exaggeration over something to make it sound worse than what it actually is or to take a point/scenario too far.
Recovery phrase
A 12-word phrase that acts like backup for your crypto private keys. A person can recover all of the crypto wallet accounts’ private keys from the recovery phrase. Is not advisable to share the recovery phrase with anyone.
Rekt
Slang for wrecked. When a crypto or NFT project goes wrong or down in value sharply. Or more broadly, when something goes wrong like a person is price out by the gas surge or an NFT floor price goes down.
Right Click Save As
An Ironic expression used by people who don’t understand the value or potential unlocked by NFTs. Person who makes fun that she/he can easily get a digital artwork by Right Click Save As and mock the NFT space and its hype.
Roadmap
The strategy outlined by an NFT project. A way to explain to the NFT community or a potential NFT investor, the different stages, value and the long term vision of the NFT project.
Royalties
NFT creators can set up their NFT so each time their NFT is resold, the creator gets paid a percentage of the sale price.
RN
Acronym for Right Now.
Rug Pull/Rugged
Slang for a scam when the founders, team or developers suddenly leave a crypto project and run away with all the investors’ funds leaving them with nothing.
S
Satoshi Nakamoto
The anonymous creator of the Bitcoin whitepaper and whose identity has never been verified.
Scammer
Someone actively trying to steal other people’s crypto or NFTs.
Secondary
Secondary refers to secondary NFT marketplaces, where NFT collectors or investors can resell NFTs after they’ve been minted. The price of an NFT or NFT collection is determined by those who list them.
Seed phrase
Another name for recovery phrase is the 12-word phrase that allows you to recover all of the crypto wallet accounts’ private keys and regain control of the wallet. Is not advisable to share the seed phrase with anyone.
Seems legit
When an NFT project or a person in the NFT community looks promising and the real deal, meaning seems legitimate. Depending on the context can also be used ironically.
Seems rare
An ironic expression or dismissive comment used by the NFT community. For example, It can be used sarcastically when someone asks for feedback on an NFT they own or created.
Ser
Slang for sir and a polite way of addressing others in an NFT community.
Shill
Expression when someone wants to promote or get exposure to an NFT they own or created.
Shill Thread
It’s a common Twitter strategy to gain traction by encouraging NFT creators to share a link to their NFT project in the hopes of getting bought or noticed by the NFT Community and potential buyers.
Simp/Simping
A NFT holder or creator who comes off as trying to hard impress an NFT whale or investor.
Sh*tposter
A person who mostly posts meme content on Twitter for fun.
SLP
Acronym for Smooth Love Potion. It’s a token players can earn as a reward in the NFT game Axie Infinity.
Smart Contract
A self-executing contract where the terms of the agreement between buyer and seller are directly written into the code and without third party or human intervention. Ethereum is a blockchain that can execute smart contracts, on the contrary to Bitcoin which does not have that capability.
SMFH
Acronym for Shaking My F*cking Head. Common reply to a person showing unbelievable idiocy.
Sock Puppet
Scam account used to lure noob investors into fake investment services.
Snag
It means to buy an NFT quickly and for a very low price. Can also be known as sniping.
Sotheby’s
Very famous auction house that has recently auctioned Beeple’s NFTs or Bored Ape Yacht Club and Crypto Punks’ NFT collections.
Stake
Crypto term for locking up a certain amount of crypto tokens for a set period of time to earn interest. In the NFT space, there are popping up a lot of projects or services that allow NFT holders to earn interest for holding a certain NFT.
Szn
Stands for season referring to crypto or NFT market cycles.
T
TINA
Acronym for There Is No Alternative. Example: someone asks “why are you investing in BTC?”, to which the reply is “TINA”.
TINA RIF
Acronym for There Is No Alternative Resistance Is Futile.
This is the way
A commendation for positive behavior by someone in the NFT Community.
Tokenomics
Referring to the economics of cryptocurrencies, DeFi or NFT projects.
V
Valhalla
Ironic use of the Viking “heaven”. Meaning someone’s NFT collection is either going to be a profitable and blue chip project, therefore they can ascend to Valhalla or is going to tank and that person will have to work at a Mcdonald’s.
Vibe
Term used to express a positive emotional state.
Volatile/Volatility
Term used to describe rapid market fluctuations and crypto or NFT prices go up and down quickly in a short period.
W
WAGMI
Acronym for We Are Going to Make It. Rally cry to build momentum for a crypto or NFT project and lead even more people into buying, shilling or supporting a specific project.
Wallet
There can be a hot or cold wallet, but both are a place where someone can store their cryptocurrency and tokens. Hot wallets are always connected to the Internet like MetaMask, Trust wallet or Phantom. On the contrary cold wallets are hardware wallets to store crypto or NFTs offline like Nano Ledger.
Weak Hands
Synonymous with Paper Hands. Someone who immediately sells their crypto or NFT because of a bear market, FUD or any other negative sentiment.
Web 1.0
Refers to the beginning of the Web. A period from around 1990 to 2005, also known as the read-only web.
Web 2.0
Refers to an iteration of Web 1.0. From 2005 to the present moment, where social media platforms like Facebook, Instagram, TikTok, Google, Twitter, etc reshaped the web, therefore becoming the read-write web.
Web 3.0
A term coined by Ethereum co-founder Gavin Wood and it’s an idea of what the future of the web could look like. Most peoples’ data, info or content would no longer be centralized in Web 2.0 giants - the Big Tech - but decentralized, mostly thanks to blockchain technology. Web 3.0 could be known as read-write-trust web.
Wen
As in When.
Wen Moon
Popular expression from crypto Twitter not so much in the NFT space. Refers to the still distant future when a token will moon.
Whitepaper
Document released by a crypto or NFT project where it lays the technical information behind the concept, vision, roadmap and plans to grow a certain project.
Whale
Someone who owns a large position on a specific or many cryptos or NFTs.
Y
Yodo
Acronym for You Only Die Once. The opposite of Yolo.
Yolo
Acronym for You Only Live Once. A person can use this when they just realized they bought a shitcoin or crap NFT and they’re getting rekt.
Original post
You might also like
Isaiah McCall
3 years ago
Is TikTok slowly destroying a new generation?
It's kids' digital crack

TikTok is a destructive social media platform.
The interface shortens attention spans and dopamine receptors.
TikTok shares more data than other apps.
Seeing an endless stream of dancing teens on my glowing box makes me feel like a Blade Runner extra.
TikTok did in one year what MTV, Hollywood, and Warner Music tried to do in 20 years. TikTok has psychotized the two-thirds of society Aldous Huxley said were hypnotizable.
Millions of people, mostly kids, are addicted to learning a new dance, lip-sync, or prank, and those who best dramatize this collective improvisation get likes, comments, and shares.
TikTok is a great app. So what?
The Commercial Magnifying Glass TikTok made me realize my generation's time was up and the teenage Zoomers were the target.
I told my 14-year-old sister, "Enjoy your time under the commercial magnifying glass."
TikTok sells your every move, gesture, and thought. Data is the new oil. If you tell someone, they'll say, "Yeah, they collect data, but who cares? I have nothing to hide."
It's a George Orwell novel's beginning. Look up Big Brother Award winners to see if TikTok won.

TikTok shares your data more than any other social media app, and where it goes is unclear. TikTok uses third-party trackers to monitor your activity after you leave the app.
Consumers can't see what data is shared or how it will be used. — Genius URL
32.5 percent of Tiktok's users are 10 to 19 and 29.5% are 20 to 29.
TikTok is the greatest digital marketing opportunity in history, and they'll use it to sell you things, track you, and control your thoughts. Any of its users will tell you, "I don't care, I just want to be famous."
TikTok manufactures mental illness
TikTok's effect on dopamine and the brain is absurd. Dopamine controls the brain's pleasure and reward centers. It's like a switch that tells your brain "this feels good, repeat."
Dr. Julie Albright, a digital culture and communication sociologist, said TikTok users are "carried away by dopamine." It's hypnotic, you'll keep watching."
TikTok constantly releases dopamine. A guy on TikTok recently said he didn't like books because they were slow and boring.
The US didn't ban Tiktok.
Biden and Trump agree on bad things. Both agree that TikTok threatens national security and children's mental health.
The Chinese Communist Party owns and operates TikTok, but that's not its only problem.
There’s borderline child porn on TikTok
It's unsafe for children and violated COPPA.
It's also Chinese spyware. I'm not a Trump supporter, but I was glad he wanted TikTok regulated and disappointed when he failed.
Full-on internet censorship is rare outside of China, so banning it may be excessive. US should regulate TikTok more.
We must reject a low-quality present for a high-quality future.
TikTok vs YouTube
People got mad when I wrote about YouTube's death.
They didn't like when I said TikTok was YouTube's first real challenger.
Indeed. TikTok is the fastest-growing social network. In three years, the Chinese social media app TikTok has gained over 1 billion active users. In the first quarter of 2020, it had the most downloads of any app in a single quarter.
TikTok is the perfect social media app in many ways. It's brief and direct.
Can you believe they had a YouTube vs TikTok boxing match? We are doomed as a species.
YouTube hosts my favorite videos. That’s why I use it. That’s why you use it. New users expect more. They want something quicker, more addictive.
TikTok's impact on other social media platforms frustrates me. YouTube copied TikTok to compete.
It's all about short, addictive content.
I'll admit I'm probably wrong about TikTok. My friend says his feed is full of videos about food, cute animals, book recommendations, and hot lesbians.
Whatever.
TikTok makes us bad
TikTok is the opposite of what the Ancient Greeks believed about wisdom.
It encourages people to be fake. It's like a never-ending costume party where everyone competes.
It does not mean that Gen Z is doomed.
They could be the saviors of the world for all I know.
TikTok feels like a step towards Mike Judge's "Idiocracy," where the average person is a pleasure-seeking moron.

Aaron Dinin, PhD
3 years ago
I put my faith in a billionaire, and he destroyed my business.
How did his money blind me?

Like most fledgling entrepreneurs, I wanted a mentor. I met as many nearby folks with "entrepreneur" in their LinkedIn biographies for coffee.
These meetings taught me a lot, and I'd suggest them to any new creator. Attention! Meeting with many experienced entrepreneurs means getting contradictory advice. One entrepreneur will tell you to do X, then the next one you talk to may tell you to do Y, which are sometimes opposites. You'll have to chose which suggestion to take after the chats.
I experienced this. Same afternoon, I had two coffee meetings with experienced entrepreneurs. The first meeting was with a billionaire entrepreneur who took his company public.
I met him in a swanky hotel lobby and ordered a drink I didn't pay for. As a fledgling entrepreneur, money was scarce.
During the meeting, I demoed the software I'd built, he liked it, and we spent the hour discussing what features would make it a success. By the end of the meeting, he requested I include a killer feature we both agreed would attract buyers. The feature was complex and would require some time. The billionaire I was sipping coffee with in a beautiful hotel lobby insisted people would love it, and that got me enthusiastic.
The second meeting was with a young entrepreneur who had recently raised a small amount of investment and looked as eager to pitch me as I was to pitch him. I forgot his name. I mostly recall meeting him in a filthy coffee shop in a bad section of town and buying his pricey cappuccino. Water for me.
After his pitch, I demoed my app. When I was done, he barely noticed. He questioned my customer acquisition plan. Who was my client? What did they offer? What was my plan? Etc. No decent answers.
After our meeting, he insisted I spend more time learning my market and selling. He ignored my questions about features. Don't worry about features, he said. Customers will request features. First, find them.
Putting your faith in results over relevance
Problems plagued my afternoon. I met with two entrepreneurs who gave me differing advice about how to proceed, and I had to decide which to pursue. I couldn't decide.
Ultimately, I followed the advice of the billionaire.
Obviously.
Who wouldn’t? That was the guy who clearly knew more.
A few months later, I constructed the feature the billionaire said people would line up for.
The new feature was unpopular. I couldn't even get the billionaire to answer an email showing him what I'd done. He disappeared.
Within a few months, I shut down the company, wasting all the time and effort I'd invested into constructing the killer feature the billionaire said I required.
Would follow the struggling entrepreneur's advice have saved my company? It would have saved me time in retrospect. Potential consumers would have told me they didn't want what I was producing, and I could have shut down the company sooner or built something they did want. Both outcomes would have been better.
Now I know, but not then. I favored achievement above relevance.
Success vs. relevance
The millionaire gave me advice on building a large, successful public firm. A successful public firm is different from a startup. Priorities change in the last phase of business building, which few entrepreneurs reach. He gave wonderful advice to founders trying to double their stock values in two years, but it wasn't beneficial for me.
The other failing entrepreneur had relevant, recent experience. He'd recently been in my shoes. We still had lots of problems. He may not have achieved huge success, but he had valuable advice on how to pass the closest hurdle.
The money blinded me at the moment. Not alone So much of company success is defined by money valuations, fundraising, exits, etc., so entrepreneurs easily fall into this trap. Money chatter obscures the value of knowledge.
Don't base startup advice on a person's income. Focus on what and when the person has learned. Relevance to you and your goals is more important than a person's accomplishments when considering advice.

Henrique Centieiro
3 years ago
DAO 101: Everything you need to know
Maybe you'll work for a DAO next! Over $1 Billion in NFTs in the Flamingo DAO Another DAO tried to buy the NFL team Denver Broncos. The UkraineDAO raised over $7 Million for Ukraine. The PleasrDAO paid $4m for a Wu-Tang Clan album that belonged to the “pharma bro.”
DAOs move billions and employ thousands. So learn what a DAO is, how it works, and how to create one!
DAO? So, what? Why is it better?
A Decentralized Autonomous Organization (DAO). Some people like to also refer to it as Digital Autonomous Organization, but I prefer the former.
They are virtual organizations. In the real world, you have organizations or companies right? These firms have shareholders and a board. Usually, anyone with authority makes decisions. It could be the CEO, the Board, or the HIPPO. If you own stock in that company, you may also be able to influence decisions. It's now possible to do something similar but much better and more equitable in the cryptocurrency world.
This article informs you:
DAOs- What are the most common DAOs, their advantages and disadvantages over traditional companies? What are they if any?
Is a DAO legally recognized?
How secure is a DAO?
I’m ready whenever you are!
A DAO is a type of company that is operated by smart contracts on the blockchain. Smart contracts are computer code that self-executes our commands. Those contracts can be any. Most second-generation blockchains support smart contracts. Examples are Ethereum, Solana, Polygon, Binance Smart Chain, EOS, etc. I think I've gone off topic. Back on track. Now let's go!
Unlike traditional corporations, DAOs are governed by smart contracts. Unlike traditional company governance, DAO governance is fully transparent and auditable. That's one of the things that sets it apart. The clarity!
A DAO, like a traditional company, has one major difference. In other words, it is decentralized. DAOs are more ‘democratic' than traditional companies because anyone can vote on decisions. Anyone! In a DAO, we (you and I) make the decisions, not the top-shots. We are the CEO and investors. A DAO gives its community members power. We get to decide.
As long as you are a stakeholder, i.e. own a portion of the DAO tokens, you can participate in the DAO. Tokens are open to all. It's just a matter of exchanging it. Ownership of DAO tokens entitles you to exclusive benefits such as governance, voting, and so on. You can vote for a move, a plan, or the DAO's next investment. You can even pitch for funding. Any ‘big' decision in a DAO requires a vote from all stakeholders. In this case, ‘token-holders'! In other words, they function like stock.
What are the 5 DAO types?
Different DAOs exist. We will categorize decentralized autonomous organizations based on their mode of operation, structure, and even technology. Here are a few. You've probably heard of them:
1. DeFi DAO
These DAOs offer DeFi (decentralized financial) services via smart contract protocols. They use tokens to vote protocol and financial changes. Uniswap, Aave, Maker DAO, and Olympus DAO are some examples. Most DAOs manage billions.
Maker DAO was one of the first protocols ever created. It is a decentralized organization on the Ethereum blockchain that allows cryptocurrency lending and borrowing without a middleman.
Maker DAO issues DAI, a stable coin. DAI is a top-rated USD-pegged stable coin.
Maker DAO has an MKR token. These token holders are in charge of adjusting the Dai stable coin policy. Simply put, MKR tokens represent DAO “shares”.
2. Investment DAO
Investors pool their funds and make investment decisions. Investing in new businesses or art is one example. Investment DAOs help DeFi operations pool capital. The Meta Cartel DAO is a community of people who want to invest in new projects built on the Ethereum blockchain. Instead of investing one by one, they want to pool their resources and share ideas on how to make better financial decisions.
Other investment DAOs include the LAO and Friends with Benefits.
3. DAO Grant/Launchpad
In a grant DAO, community members contribute funds to a grant pool and vote on how to allocate and distribute them. These DAOs fund new DeFi projects. Those in need only need to apply. The Moloch DAO is a great Grant DAO. The tokens are used to allocate capital. Also see Gitcoin and Seedify.
4. DAO Collector
I debated whether to put it under ‘Investment DAO' or leave it alone. It's a subset of investment DAOs. This group buys non-fungible tokens, artwork, and collectibles. The market for NFTs has recently exploded, and it's time to investigate. The Pleasr DAO is a collector DAO. One copy of Wu-Tang Clan's "Once Upon a Time in Shaolin" cost the Pleasr DAO $4 million. Pleasr DAO is known for buying Doge meme NFT. Collector DAOs include the Flamingo, Mutant Cats DAO, and Constitution DAOs. Don't underestimate their websites' "childish" style. They have millions.
5. Social DAO
These are social networking and interaction platforms. For example, Decentraland DAO and Friends With Benefits DAO.
What are the DAO Benefits?
Here are some of the benefits of a decentralized autonomous organization:
- They are trustless. You don’t need to trust a CEO or management team
- It can’t be shut down unless a majority of the token holders agree. The government can't shut - It down because it isn't centralized.
- It's fully democratic
- It is open-source and fully transparent.
What about DAO drawbacks?
We've been saying DAOs are the bomb? But are they really the shit? What could go wrong with DAO?
DAOs may contain bugs. If they are hacked, the results can be catastrophic.
No trade secrets exist. Because the smart contract is transparent and coded on the blockchain, it can be copied. It may be used by another organization without credit. Maybe DAOs should use Secret, Oasis, or Horizen blockchain networks.
Are DAOs legally recognized??
In most counties, DAO regulation is inexistent. It's unclear. Most DAOs don’t have a legal personality. The Howey Test and the Securities Act of 1933 determine whether DAO tokens are securities. Although most countries follow the US, this is only considered for the US. Wyoming became the first state to recognize DAOs as legal entities in July 2021 after passing a DAO bill. DAOs registered in Wyoming are thus legally recognized as business entities in the US and thus receive the same legal protections as a Limited Liability Company.
In terms of cyber-security, how secure is a DAO?
Blockchains are secure. However, smart contracts may have security flaws or bugs. This can be avoided by third-party smart contract reviews, testing, and auditing
Finally, Decentralized Autonomous Organizations are timeless. Let us examine the current situation: Ukraine's invasion. A DAO was formed to help Ukrainian troops fighting the Russians. It was named Ukraine DAO. Pleasr DAO, NFT studio Trippy Labs, and Russian art collective Pussy Riot organized this fundraiser. Coindesk reports that over $3 million has been raised in Ethereum-based tokens. AidForUkraine, a DAO aimed at supporting Ukraine's defense efforts, has launched. Accepting Solana token donations. They are fully transparent, uncensorable, and can’t be shut down or sanctioned.
DAOs are undeniably the future of blockchain. Everyone is paying attention. Personally, I believe traditional companies will soon have to choose between adapting or being left behind.
Long version of this post: https://medium.datadriveninvestor.com/dao-101-all-you-need-to-know-about-daos-275060016663