


5 Bored Apes borrowed to claim $1.1 million in APE tokens
Takeaway
Unknown user took advantage of the ApeCoin airdrop to earn $1.1 million.
He used a flash loan to borrow five BAYC NFTs, claim the airdrop, and repay the NFTs.
Yuga Labs, the creators of BAYC, airdropped ApeCoin (APE) to anyone who owns one of their NFTs yesterday.
For the Bored Ape Yacht Club and Mutant Ape Yacht Club collections, the team allocated 150 million tokens, or 15% of the total ApeCoin supply, worth over $800 million. Each BAYC holder received 10,094 tokens worth $80,000 to $200,000.
But someone managed to claim the airdrop using NFTs they didn't own. They used the airdrop's specific features to carry it out. And it worked, earning them $1.1 million in ApeCoin.
The trick was that the ApeCoin airdrop wasn't based on who owned which Bored Ape at a given time. Instead, anyone with a Bored Ape at the time of the airdrop could claim it. So if you gave someone your Bored Ape and you hadn't claimed your tokens, they could claim them.
The person only needed to get hold of some Bored Apes that hadn't had their tokens claimed to claim the airdrop. They could be returned immediately.
So, what happened?
The person found a vault with five Bored Ape NFTs that hadn't been used to claim the airdrop.
A vault tokenizes an NFT or a group of NFTs. You put a bunch of NFTs in a vault and make a token. This token can then be staked for rewards or sold (representing part of the value of the collection of NFTs). Anyone with enough tokens can exchange them for NFTs.
This vault uses the NFTX protocol. In total, it contained five Bored Apes: #7594, #8214, #9915, #8167, and #4755. Nobody had claimed the airdrop because the NFTs were locked up in the vault and not controlled by anyone.
The person wanted to unlock the NFTs to claim the airdrop but didn't want to buy them outright s o they used a flash loan, a common tool for large DeFi hacks. Flash loans are a low-cost way to borrow large amounts of crypto that are repaid in the same transaction and block (meaning that the funds are never at risk of not being repaid).
With a flash loan of under $300,000 they bought a Bored Ape on NFT marketplace OpenSea. A large amount of the vault's token was then purchased, allowing them to redeem the five NFTs. The NFTs were used to claim the airdrop, before being returned, the tokens sold back, and the loan repaid.
During this process, they claimed 60,564 ApeCoin airdrops. They then sold them on Uniswap for 399 ETH ($1.1 million). Then they returned the Bored Ape NFT used as collateral to the same NFTX vault.
Attack or arbitrage?
However, security firm BlockSecTeam disagreed with many social media commentators. A flaw in the airdrop-claiming mechanism was exploited, it said.
According to BlockSecTeam's analysis, the user took advantage of a "vulnerability" in the airdrop.
"We suspect a hack due to a flaw in the airdrop mechanism. The attacker exploited this vulnerability to profit from the airdrop claim" said BlockSecTeam.
For example, the airdrop could have taken into account how long a person owned the NFT before claiming the reward.
Because Yuga Labs didn't take a snapshot, anyone could buy the NFT in real time and claim it. This is probably why BAYC sales exploded so soon after the airdrop announcement.
More on NFTs & Art

CyberPunkMetalHead
3 years ago
Why Bitcoin NFTs Are Incomprehensible yet Likely Here to Stay
I'm trying to understand why Bitcoin NFTs aren't ready.
Ordinals, a new Bitcoin protocol, has been controversial. NFTs can be added to Bitcoin transactions using the protocol. They are not tokens or fungible. Bitcoin NFTs are transaction metadata. Yes. They're not owned.
In January, the Ordinals protocol allowed data like photos to be directly encoded onto sats, the smallest units of Bitcoin worth 0.00000001 BTC, on the Bitcoin blockchain. Ordinals does not need a sidechain or token like other techniques. The Ordinals protocol has encoded JPEG photos, digital art, new profile picture (PFP) projects, and even 1993 DOOM onto the Bitcoin network.
Ordinals inscriptions are permanent digital artifacts preserved on the Bitcoin blockchain. It differs from Ethereum, Solana, and Stacks NFT technologies that allow smart contract creators to change information. Ordinals store the whole image or content on the blockchain, not just a link to an external server, unlike centralized databases, which can change the linked image, description, category, or contract identifier.
So far, more than 50,000 ordinals have been produced on the Bitcoin blockchain, and some of them have already been sold for astronomical amounts. The Ethereum-based CryptoPunks NFT collection spawned Ordinal Punk. Inscription 620 sold for 9.5 BTC, or $218,000, the most.

Segwit and Taproot, two important Bitcoin blockchain updates, enabled this. These protocols store transaction metadata, unlike Ethereum, where the NFT is the token. Bitcoin's NFT is a sat's transaction details.
What effects do ordinary values and NFTs have on the Bitcoin blockchain?
Ordinals will likely have long-term effects on the Bitcoin Ecosystem since they store, transact, and compute more data.
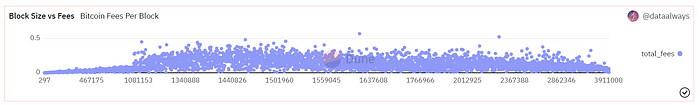
Charges Ordinals introduce scalability challenges. The Bitcoin network has limited transaction throughput and increased fees during peak demand. NFTs could make network transactions harder and more expensive. Ordinals currently occupy over 50% of block space, according to Glassnode.
One of the protocols that supported Ordinals Taproot has also seen a huge uptick:
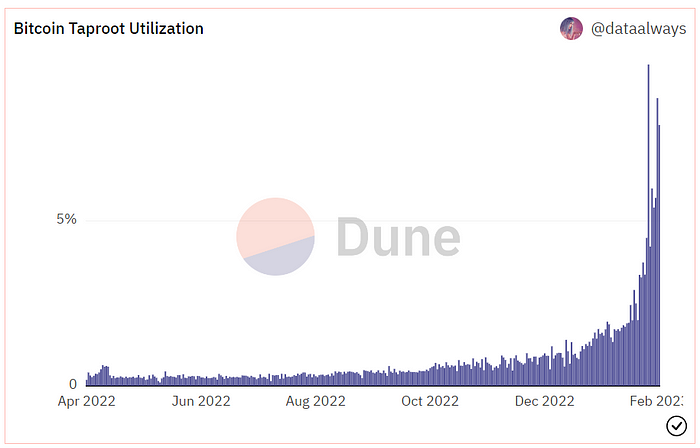
Taproot use increases block size and transaction costs.
This could cause network congestion but also support more L2s with Ordinals-specific use cases. Dune info here.
Storage Needs The Bitcoin blockchain would need to store more data to store NFT data directly. Since ordinals were introduced, blocksize has tripled from 0.7mb to over 2.2mb, which could increase storage costs and make it harder for nodes to join the network.
Use Case Diversity On the other hand, NFTs on the Bitcoin blockchain could broaden Bitcoin's use cases beyond storage and payment. This could expand Bitcoin's user base. This is two-sided. Bitcoin was designed to be trustless, decentralized, peer-to-peer money.
Chain to permanently store NFTs as ordinals will change everything.
Popularity rise This new use case will boost Bitcoin appeal, according to some. This argument fails since Bitcoin is the most popular cryptocurrency. Popularity doesn't require a new use case. Cryptocurrency adoption boosts Bitcoin. It need not compete with Ethereum or provide extra benefits to crypto investors. If there was a need for another chain that supports NFTs (there isn't), why would anyone choose the slowest and most expensive network? It appears contradictory and unproductive.
Nonetheless, holding an NFT on the Bitcoin blockchain is more secure than any other blockchain, but this has little utility.
Bitcoin NFTs are undoubtedly controversial. NFTs are strange and perhaps harmful to Bitcoin's mission. If Bitcoin NFTs are here to stay, I hope a sidechain or rollup solution will take over and leave the base chain alone.

Yuga Labs
4 years ago
Yuga Labs (BAYC and MAYC) buys CryptoPunks and Meebits and gives them commercial rights
Yuga has acquired the CryptoPunks and Meebits NFT IP from Larva Labs. These include 423 CryptoPunks and 1711 Meebits.
We set out to create in the NFT space because we admired CryptoPunks and the founders' visionary work. A lot of their work influenced how we built BAYC and NFTs. We're proud to lead CryptoPunks and Meebits into the future as part of our broader ecosystem.
"Yuga Labs invented the modern profile picture project and are the best in the world at operating these projects. They are ideal CrytoPunk and Meebit stewards. We are confident that in their hands, these projects will thrive in the emerging decentralized web.”
–The founders of Larva Labs, CryptoPunks, and Meebits
This deal grew out of discussions between our partner Guy Oseary and the Larva Labs founders. One call led to another, and now we're here. This does not mean Matt and John will join Yuga. They'll keep running Larva Labs and creating awesome projects that help shape the future of web3.
Next steps
Here's what we plan to do with CryptoPunks and Meebits now that we own the IP. Owners of CryptoPunks and Meebits will soon receive commercial rights equal to those of BAYC and MAYC holders. Our legal teams are working on new terms and conditions for both collections, which we hope to share with the community soon. We expect a wide range of third-party developers and community creators to incorporate CryptoPunks and Meebits into their web3 projects. We'll build the brand alongside them.
We don't intend to cram these NFT collections into the BAYC club model. We see BAYC as the hub of the Yuga universe, and CryptoPunks as a historical collection. We will work to improve the CryptoPunks and Meebits collections as good stewards. We're not in a hurry. We'll consult the community before deciding what to do next.
For us, NFTs are about culture. We're deeply invested in the BAYC community, and it's inspiring to see them grow, collaborate, and innovate. We're excited to see what CryptoPunks and Meebits do with IP rights. Our goal has always been to create a community-owned brand that goes beyond NFTs, and now we can include CryptoPunks and Meebits.

middlemarch.eth
4 years ago
ERC721R: A new ERC721 contract for random minting so people don’t snipe all the rares!
That is, how to snipe all the rares without using ERC721R!
Introduction: Blessed and Lucky
Mphers was the first mfers derivative, and as a Phunks derivative, I wanted one.
I wanted an alien. And there are only 8 in the 6,969 collection. I got one!
In case it wasn't clear from the tweet, I meant that I was lucky to have figured out how to 100% guarantee I'd get an alien without any extra luck.
Read on to find out how I did it, how you can too, and how developers can avoid it!
How to make rare NFTs without luck.
# How to mint rare NFTs without needing luck
The key to minting a rare NFT is knowing the token's id ahead of time.
For example, once I knew my alien was #4002, I simply refreshed the mint page until #3992 was minted, and then mint 10 mphers.
How did I know #4002 was extraterrestrial? Let's go back.
First, go to the mpher contract's Etherscan page and look up the tokenURI of a previously issued token, token #1:
As you can see, mphers creates metadata URIs by combining the token id and an IPFS hash.
This method gives you the collection's provenance in every URI, and while that URI can be changed, it affects everyone and is public.
Consider a token URI without a provenance hash, like https://mphers.art/api?tokenId=1.
As a collector, you couldn't be sure the devs weren't changing #1's metadata at will.
The API allows you to specify “if #4002 has not been minted, do not show any information about it”, whereas IPFS does not allow this.
It's possible to look up the metadata of any token, whether or not it's been minted.
Simply replace the trailing “1” with your desired id.
Mpher #4002
These files contain all the information about the mpher with the specified id. For my alien, we simply search all metadata files for the string “alien mpher.”
Take a look at the 6,969 meta-data files I'm using OpenSea's IPFS gateway, but you could use ipfs.io or something else.
Use curl to download ten files at once. Downloading thousands of files quickly can lead to duplicates or errors. But with a little tweaking, you should be able to get everything (and dupes are fine for our purposes).
Now that you have everything in one place, grep for aliens:
The numbers are the file names that contain “alien mpher” and thus the aliens' ids.
The entire process takes under ten minutes. This technique works on many NFTs currently minting.
In practice, manually minting at the right time to get the alien is difficult, especially when tokens mint quickly. Then write a bot to poll totalSupply() every second and submit the mint transaction at the exact right time.
You could even look for the token you need in the mempool before it is minted, and get your mint into the same block!
However, in my experience, the “big” approach wins 95% of the time—but not 100%.
“Am I being set up all along?”
Is a question you might ask yourself if you're new to this.
It's disheartening to think you had no chance of minting anything that someone else wanted.
But, did you have no opportunity? You had an equal chance as everyone else!
Take me, for instance: I figured this out using open-source tools and free public information. Anyone can do this, and not understanding how a contract works before minting will lead to much worse issues.
The mpher mint was fair.
While a fair game, “snipe the alien” may not have been everyone's cup of tea.
People may have had more fun playing the “mint lottery” where tokens were distributed at random and no one could gain an advantage over someone simply clicking the “mint” button.
How might we proceed?
Minting For Fashion Hats Punks, I wanted to create a random minting experience without sacrificing fairness. In my opinion, a predictable mint beats an unfair one. Above all, participants must be equal.
Sadly, the most common method of creating a random experience—the post-mint “reveal”—is deeply unfair. It works as follows:
- During the mint, token metadata is unavailable. Instead, tokenURI() returns a blank JSON file for each id.
- An IPFS hash is updated once all tokens are minted.
- You can't tell how the contract owner chose which token ids got which metadata, so it appears random.
Because they alone decide who gets what, the person setting the metadata clearly has a huge unfair advantage over the people minting. Unlike the mpher mint, you have no chance of winning here.
But what if it's a well-known, trusted, doxxed dev team? Are reveals okay here?
No! No one should be trusted with such power. Even if someone isn't consciously trying to cheat, they have unconscious biases. They might also make a mistake and not realize it until it's too late, for example.
You should also not trust yourself. Imagine doing a reveal, thinking you did it correctly (nothing is 100%! ), and getting the rarest NFT. Isn't that a tad odd Do you think you deserve it? An NFT developer like myself would hate to be in this situation.
Reveals are bad*
UNLESS they are done without trust, meaning everyone can verify their fairness without relying on the developers (which you should never do).
An on-chain reveal powered by randomness that is verifiably outside of anyone's control is the most common way to achieve a trustless reveal (e.g., through Chainlink).
Tubby Cats did an excellent job on this reveal, and I highly recommend their contract and launch reflections. Their reveal was also cool because it was progressive—you didn't have to wait until the end of the mint to find out.
In his post-launch reflections, @DefiLlama stated that he made the contract as trustless as possible, removing as much trust as possible from the team.
In my opinion, everyone should know the rules of the game and trust that they will not be changed mid-stream, while trust minimization is critical because smart contracts were designed to reduce trust (and it makes it impossible to hack even if the team is compromised). This was a huge mistake because it limited our flexibility and our ability to correct mistakes.
And @DefiLlama is a superstar developer. Imagine how much stress maximizing trustlessness will cause you!
That leaves me with a bad solution that works in 99 percent of cases and is much easier to implement: random token assignments.
Introducing ERC721R: A fully compliant IERC721 implementation that picks token ids at random.
ERC721R implements the opposite of a reveal: we mint token ids randomly and assign metadata deterministically.
This allows us to reveal all metadata prior to minting while reducing snipe chances.
Then import the contract and use this code:
What is ERC721R and how does it work
First, a disclaimer: ERC721R isn't truly random. In this sense, it creates the same “game” as the mpher situation, where minters compete to exploit the mint. However, ERC721R is a much more difficult game.
To game ERC721R, you need to be able to predict a hash value using these inputs:
This is impossible for a normal person because it requires knowledge of the block timestamp of your mint, which you do not have.
To do this, a miner must set the timestamp to a value in the future, and whatever they do is dependent on the previous block's hash, which expires in about ten seconds when the next block is mined.
This pseudo-randomness is “good enough,” but if big money is involved, it will be gamed. Of course, the system it replaces—predictable minting—can be manipulated.
The token id is chosen in a clever implementation of the Fisher–Yates shuffle algorithm that I copied from CryptoPhunksV2.
Consider first the naive solution: (a 10,000 item collection is assumed):
- Make an array with 0–9999.
- To create a token, pick a random item from the array and use that as the token's id.
- Remove that value from the array and shorten it by one so that every index corresponds to an available token id.
This works, but it uses too much gas because changing an array's length and storing a large array of non-zero values is expensive.
How do we avoid them both? What if we started with a cheap 10,000-zero array? Let's assign an id to each index in that array.
Assume we pick index #6500 at random—#6500 is our token id, and we replace the 0 with a 1.
But what if we chose #6500 again? A 1 would indicate #6500 was taken, but then what? We can't just "roll again" because gas will be unpredictable and high, especially later mints.
This allows us to pick a token id 100% of the time without having to keep a separate list. Here's how it works:
- Make a 10,000 0 array.
- Create a 10,000 uint numAvailableTokens.
- Pick a number between 0 and numAvailableTokens. -1
- Think of #6500—look at index #6500. If it's 0, the next token id is #6500. If not, the value at index #6500 is your next token id (weird!)
- Examine the array's last value, numAvailableTokens — 1. If it's 0, move the value at #6500 to the end of the array (#9999 if it's the first token). If the array's last value is not zero, update index #6500 to store it.
- numAvailableTokens is decreased by 1.
- Repeat 3–6 for the next token id.
So there you go! The array stays the same size, but we can choose an available id reliably. The Solidity code is as follows:
Unfortunately, this algorithm uses more gas than the leading sequential mint solution, ERC721A.
This is most noticeable when minting multiple tokens in one transaction—a 10 token mint on ERC721R costs 5x more than on ERC721A. That said, ERC721A has been optimized much further than ERC721R so there is probably room for improvement.
Conclusion
Listed below are your options:
- ERC721A: Minters pay lower gas but must spend time and energy devising and executing a competitive minting strategy or be comfortable with worse minting results.
- ERC721R: Higher gas, but the easy minting strategy of just clicking the button is optimal in all but the most extreme cases. If miners game ERC721R it’s the worst of both worlds: higher gas and a ton of work to compete.
- ERC721A + standard reveal: Low gas, but not verifiably fair. Please do not do this!
- ERC721A + trustless reveal: The best solution if done correctly, highly-challenging for dev, potential for difficult-to-correct errors.
Did I miss something? Comment or tweet me @dumbnamenumbers.
Check out the code on GitHub to learn more! Pull requests are welcome—I'm sure I've missed many gas-saving opportunities.
Thanks!
Read the original post here
You might also like

Navdeep Yadav
3 years ago
31 startup company models (with examples)
Many people find the internet's various business models bewildering.
This article summarizes 31 startup e-books.
1. Using the freemium business model (free plus premium),
The freemium business model offers basic software, games, or services for free and charges for enhancements.
Examples include Slack, iCloud, and Google Drive
Provide a rudimentary, free version of your product or service to users.
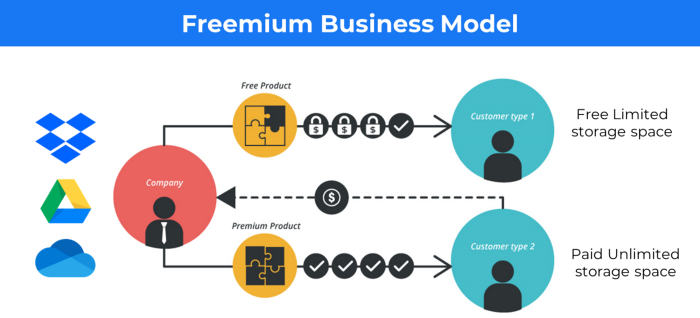
Google Drive and Dropbox offer 15GB and 2GB of free space but charge for more.
Freemium business model details (Click here)
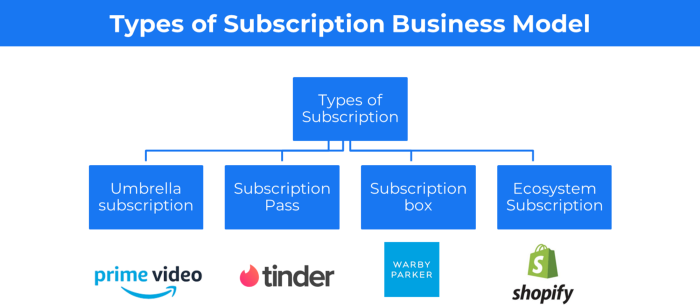
2. The Business Model of Subscription
Subscription business models sell a product or service for recurring monthly or yearly revenue.
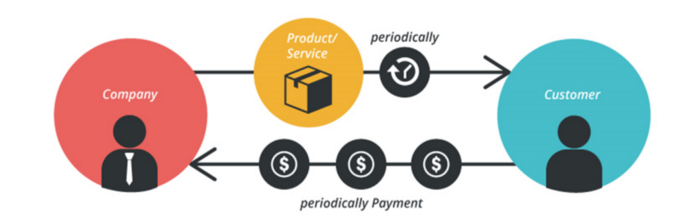
Examples: Tinder, Netflix, Shopify, etc
It's the next step to Freemium if a customer wants to pay monthly for premium features.
Subscription Business Model (Click here)
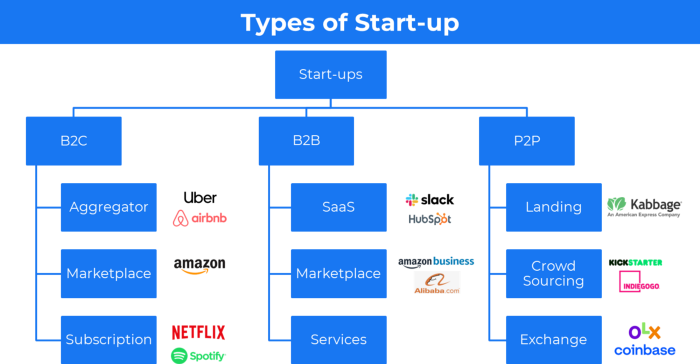
3. A market-based business strategy
It's an e-commerce site or app where third-party sellers sell products or services.
Examples are Amazon and Fiverr.
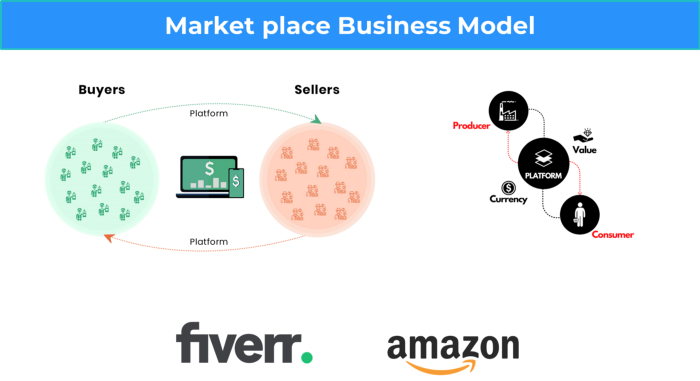
On Amazon's marketplace, a third-party vendor sells a product.
Freelancers on Fiverr offer specialized skills like graphic design.
Marketplace's business concept is explained.
4. Business plans using aggregates
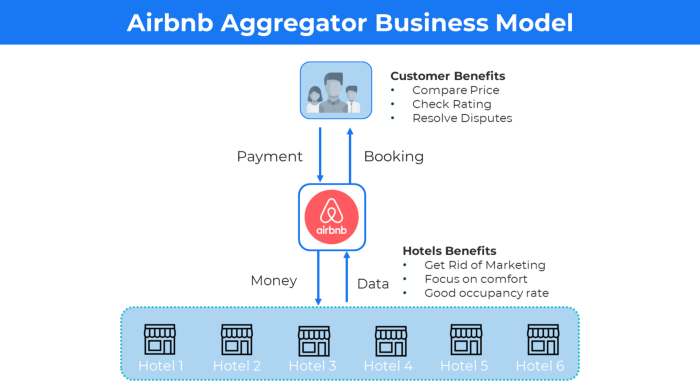
In the aggregator business model, the service is branded.
Uber, Airbnb, and other examples
Marketplace and Aggregator business models differ.
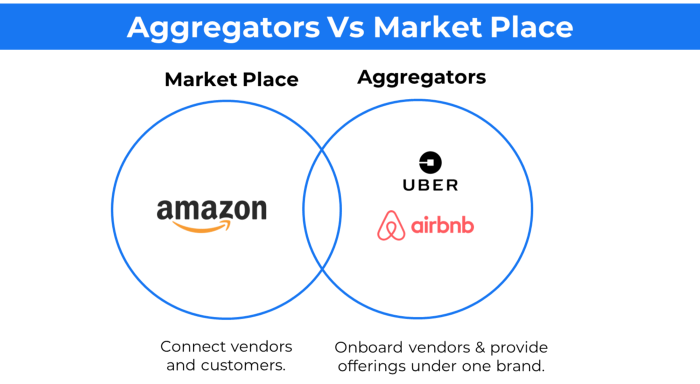
Amazon and Fiverr link merchants and customers and take a 10-20% revenue split.
Uber and Airbnb-style aggregator Join these businesses and provide their products.
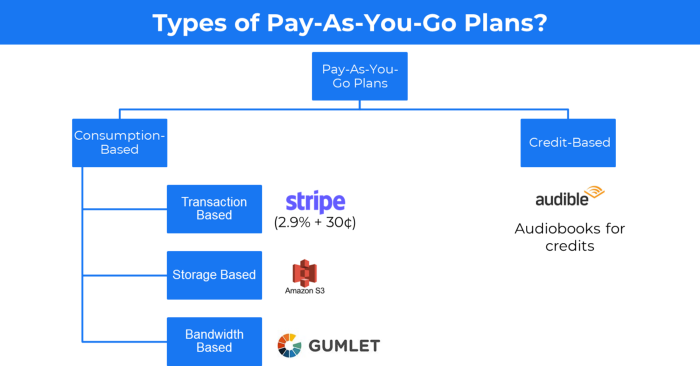
5. The pay-as-you-go concept of business
This is a consumption-based pricing system. Cloud companies use it.
Example: Amazon Web Service and Google Cloud Platform (GCP) (AWS)
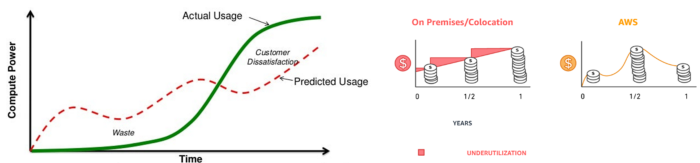
AWS, an Amazon subsidiary, offers over 200 pay-as-you-go cloud services.
“In short, the more you use the more you pay”
When it's difficult to divide clients into pricing levels, pay-as-you is employed.
6. The business model known as fee-for-service (FFS)
FFS charges fixed and variable fees for each successful payment.
For instance, PayU, Paypal, and Stripe
Stripe charges 2.9% + 30 per payment.
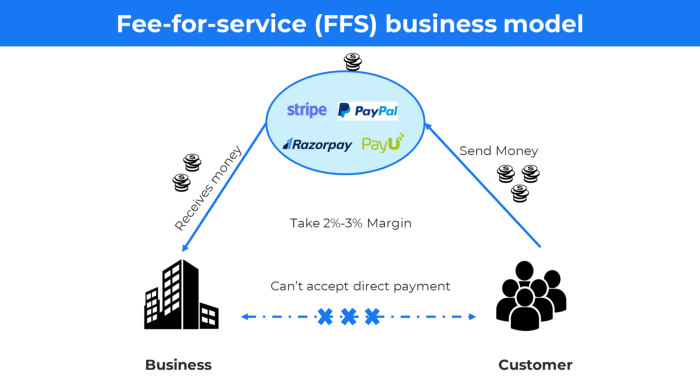
These firms offer a payment gateway to take consumer payments and deposit them to a business account.
Fintech business model
7. EdTech business strategy
In edtech, you generate money by selling material or teaching as a service.
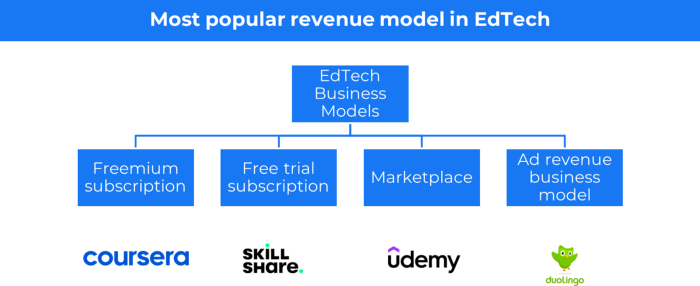
edtech business models
Freemium When course content is free but certification isn't, e.g. Coursera
FREE TRIAL SkillShare offers free trials followed by monthly or annual subscriptions.
Self-serving marketplace approach where you pick what to learn.
Ad-revenue model The company makes money by showing adverts to its huge user base.
Lock-in business strategy
Lock in prevents customers from switching to a competitor's brand or offering.
It uses switching costs or effort to transmit (soft lock-in), improved brand experience, or incentives.
Apple, SAP, and other examples
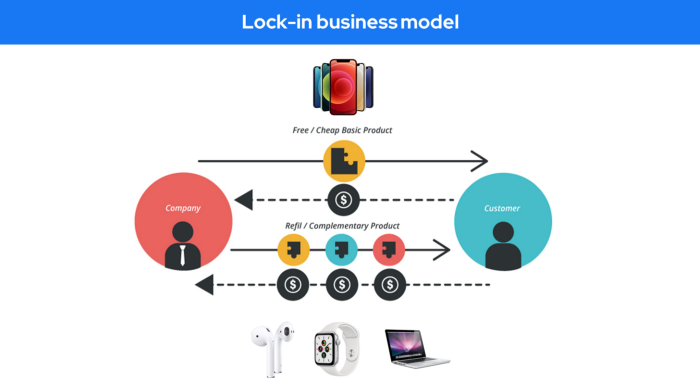
Apple offers an iPhone and then locks you in with extra hardware (Watch, Airpod) and platform services (Apple Store, Apple Music, cloud, etc.).
9. Business Model for API Licensing
APIs let third-party apps communicate with your service.
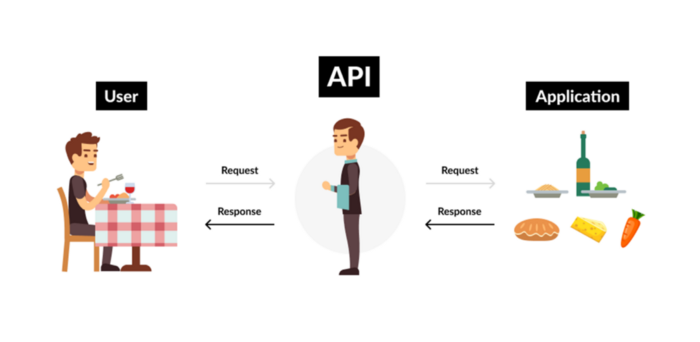
Uber and Airbnb use Google Maps APIs for app navigation.
Examples are Google Map APIs (Map), Sendgrid (Email), and Twilio (SMS).
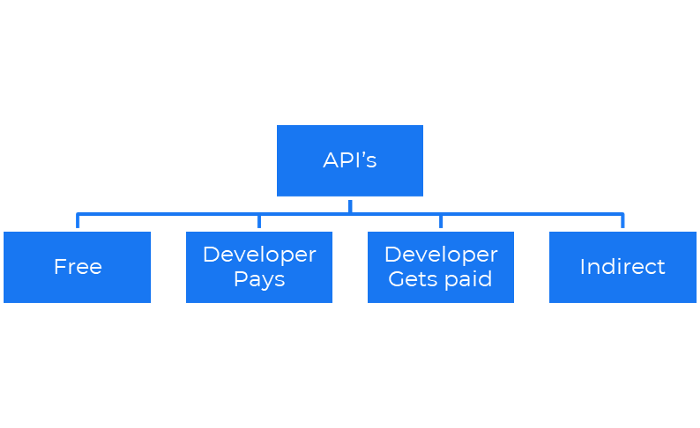
Business models for APIs
Free: The simplest API-driven business model that enables unrestricted API access for app developers. Google Translate and Facebook are two examples.
Developer Pays: Under this arrangement, service providers such as AWS, Twilio, Github, Stripe, and others must be paid by application developers.
The developer receives payment: These are the compensated content producers or developers who distribute the APIs utilizing their work. For example, Amazon affiliate programs
10. Open-source enterprise
Open-source software can be inspected, modified, and improved by anybody.
For instance, use Firefox, Java, or Android.

Google paid Mozilla $435,702 million to be their primary search engine in 2018.
Open-source software profits in six ways.
Paid assistance The Project Manager can charge for customization because he is quite knowledgeable about the codebase.
A full database solution is available as a Software as a Service (MongoDB Atlas), but there is a fee for the monitoring tool.
Open-core design R studio is a better GUI substitute for open-source applications.
sponsors of GitHub Sponsorships benefit the developers in full.
demands for paid features Earn Money By Developing Open Source Add-Ons for Current Products
Open-source business model
11. The business model for data
If the software or algorithm collects client data to improve or monetize the system.
Open AI GPT3 gets smarter with use.
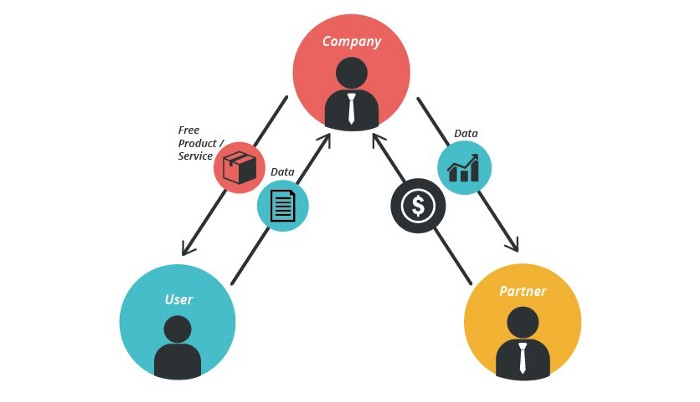
Foursquare allows users to exchange check-in locations.
Later, they compiled large datasets to enable retailers like Starbucks launch new outlets.
12. Business Model Using Blockchain
Blockchain is a distributed ledger technology that allows firms to deploy smart contracts without a central authority.
Examples include Alchemy, Solana, and Ethereum.
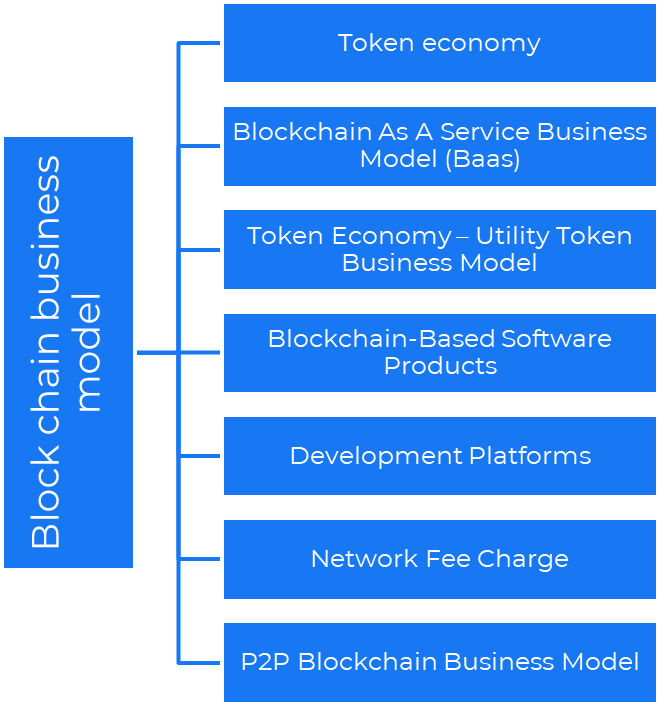
Business models using blockchain
Economy of tokens or utility When a business uses a token business model, it issues some kind of token as one of the ways to compensate token holders or miners. For instance, Solana and Ethereum
Bitcoin Cash P2P Business Model Peer-to-peer (P2P) blockchain technology permits direct communication between end users. as in IPFS
Enterprise Blockchain as a Service (Baas) BaaS focuses on offering ecosystem services similar to those offered by Amazon (AWS) and Microsoft (Azure) in the web 3 sector. Example: Ethereum Blockchain as a Service with Bitcoin (EBaaS).
Blockchain-Based Aggregators With AWS for blockchain, you can use that service by making an API call to your preferred blockchain. As an illustration, Alchemy offers nodes for many blockchains.
13. The free-enterprise model
In the freeterprise business model, free professional accounts are led into the funnel by the free product and later become B2B/enterprise accounts.
For instance, Slack and Zoom
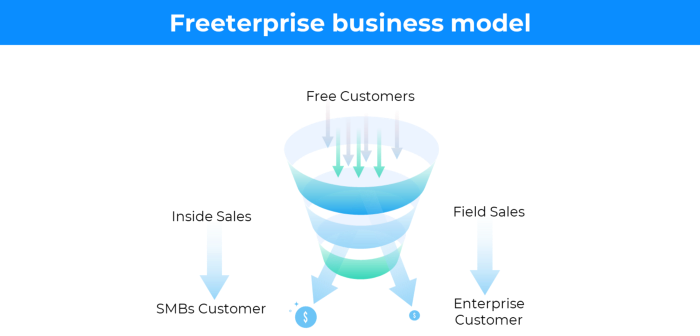
Freeterprise companies flourish through collaboration.
Start with a free professional account to build an enterprise.
14. Business plan for razor blades
It's employed in hardware where one piece is sold at a loss and profits are made through refills or add-ons.
Gillet razor & blades, coffee machine & beans, HP printer & cartridge, etc.
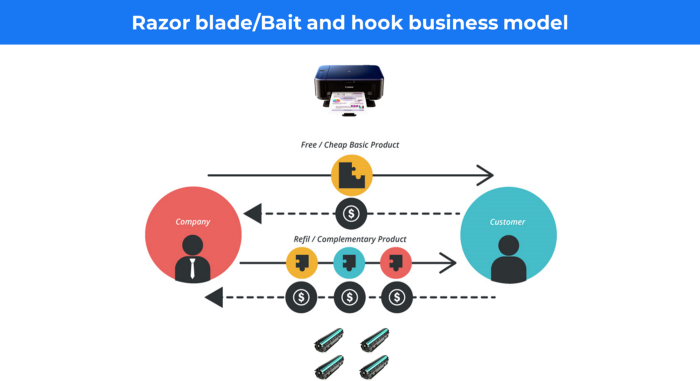
Sony sells the Playstation console at a loss but makes up for it by selling games and charging for online services.
Advantages of the Razor-Razorblade Method
lowers the risk a customer will try a product. enables buyers to test the goods and services without having to pay a high initial investment.
The product's ongoing revenue stream has the potential to generate sales that much outweigh the original investments.
Razor blade business model
15. The business model of direct-to-consumer (D2C)
In D2C, the company sells directly to the end consumer through its website using a third-party logistic partner.
Examples include GymShark and Kylie Cosmetics.
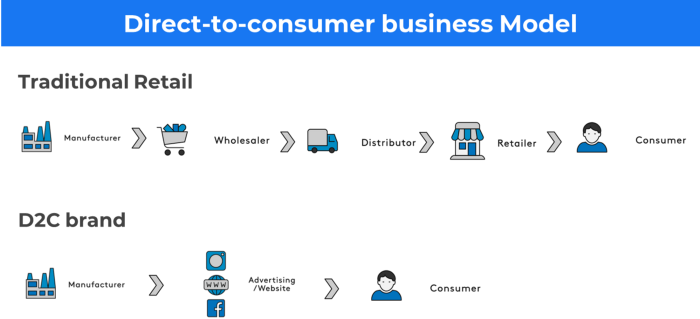
D2C brands can only expand via websites, marketplaces (Amazon, eBay), etc.
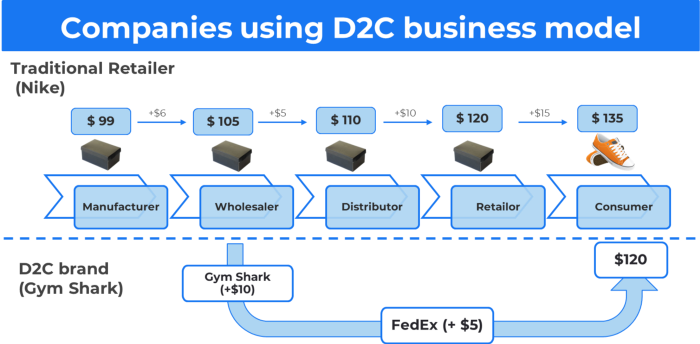
D2C benefits
Lower reliance on middlemen = greater profitability
You now have access to more precise demographic and geographic customer data.
Additional space for product testing
Increased customisation throughout your entire product line-Inventory Less
16. Business model: White Label vs. Private Label
Private label/White label products are made by a contract or third-party manufacturer.
Most amazon electronics are made in china and white-labeled.
Amazon supplements and electronics.
Contract manufacturers handle everything after brands select product quantities on design labels.
17. The franchise model
The franchisee uses the franchisor's trademark, branding, and business strategy (company).
For instance, KFC, Domino's, etc.
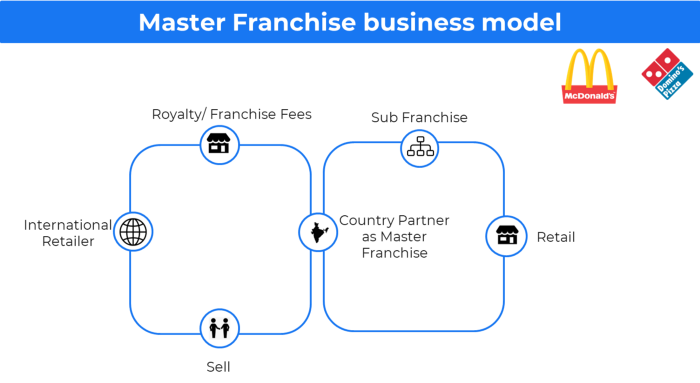
Subway, Domino, Burger King, etc. use this business strategy.
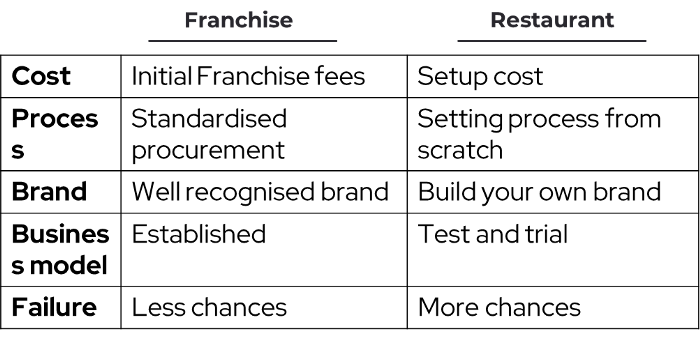
Many people pick a franchise because opening a restaurant is risky.
18. Ad-based business model
Social media and search engine giants exploit search and interest data to deliver adverts.
Google, Meta, TikTok, and Snapchat are some examples.
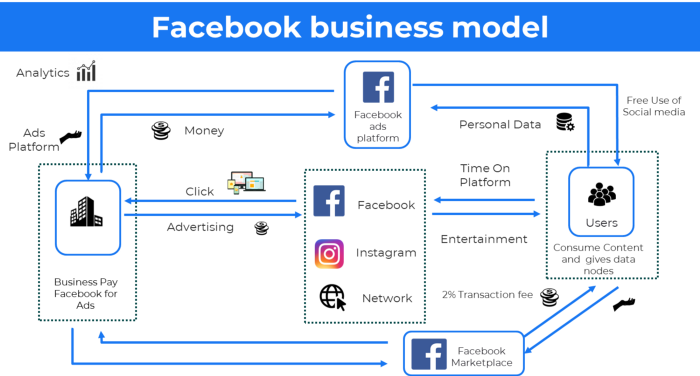
Users don't pay for the service or product given, e.g. Google users don't pay for searches.
In exchange, they collected data and hyper-personalized adverts to maximize revenue.
19. Business plan for octopuses
Each business unit functions separately but is connected to the main body.
Instance: Oyo
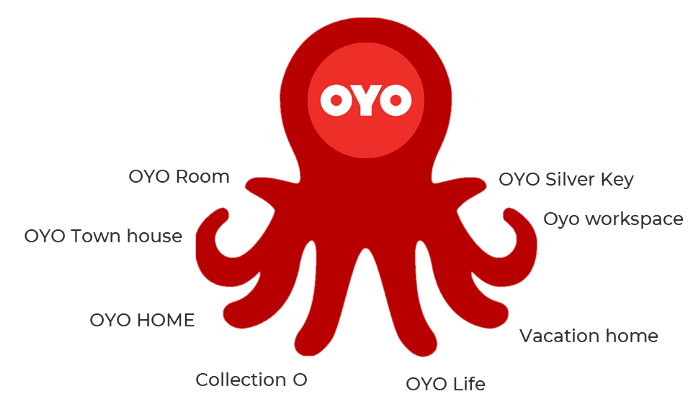
OYO is Asia's Airbnb, operating hotels, co-working, co-living, and vacation houses.
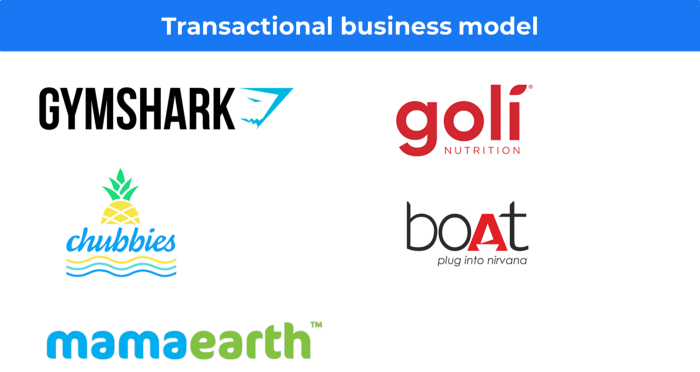
20, Transactional business model, number
Sales to customers produce revenue.
E-commerce sites and online purchases employ SSL.
Goli is an ex-GymShark.
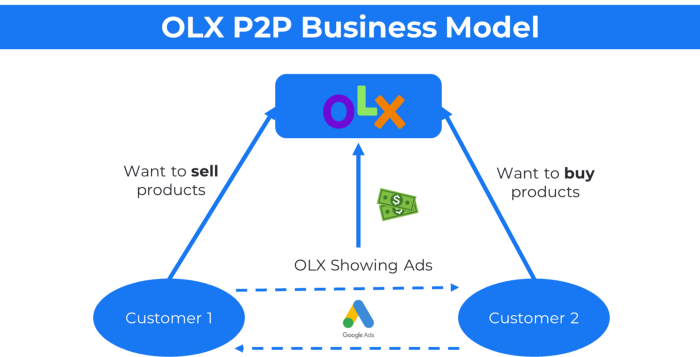
21. The peer-to-peer (P2P) business model
In P2P, two people buy and sell goods and services without a third party or platform.
Consider OLX.
22. P2P lending as a manner of operation
In P2P lending, one private individual (P2P Lender) lends/invests or borrows money from another (P2P Borrower).
Instance: Kabbage
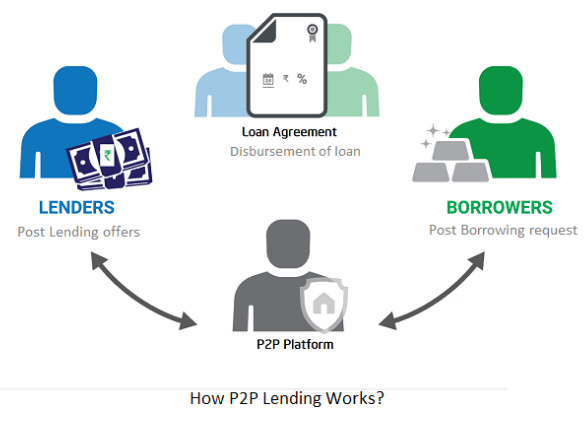
Social lending lets people lend and borrow money directly from each other without an intermediary financial institution.
23. A business model for brokers
Brokerages charge a commission or fee for their services.
Examples include eBay, Coinbase, and Robinhood.
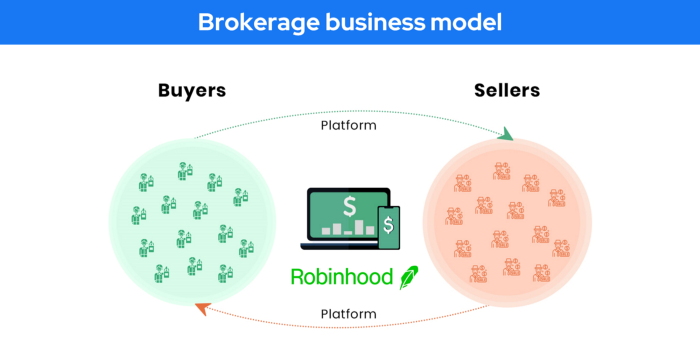
Brokerage businesses are common in Real estate, finance, and online and operate on this model.
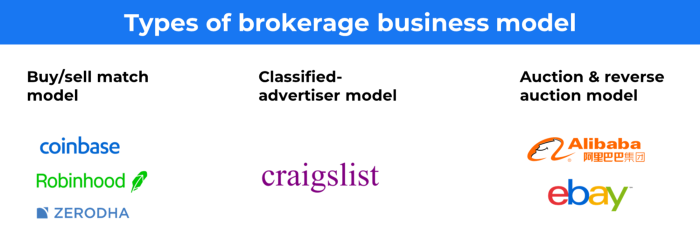
Buy/sell similar models Examples include financial brokers, insurance brokers, and others who match purchase and sell transactions and charge a commission.
These brokers charge an advertiser a fee based on the date, place, size, or type of an advertisement. This is known as the classified-advertiser model. For instance, Craiglist
24. Drop shipping as an industry
Dropshipping allows stores to sell things without holding physical inventories.
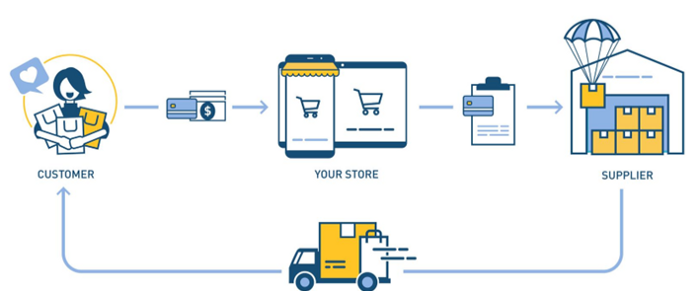
When a customer orders, use a third-party supplier and logistic partners.
Retailer product portfolio and customer experience Fulfiller The consumer places the order.
Dropshipping advantages
Less money is needed (Low overhead-No Inventory or warehousing)
Simple to start (costs under $100)
flexible work environment
New product testing is simpler
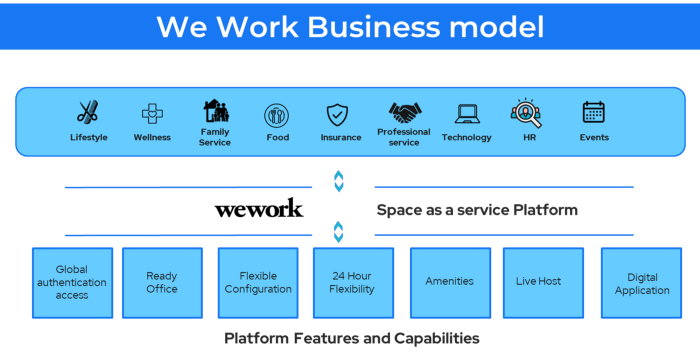
25. Business Model for Space as a Service
It's centered on a shared economy that lets millennials live or work in communal areas without ownership or lease.
Consider WeWork and Airbnb.
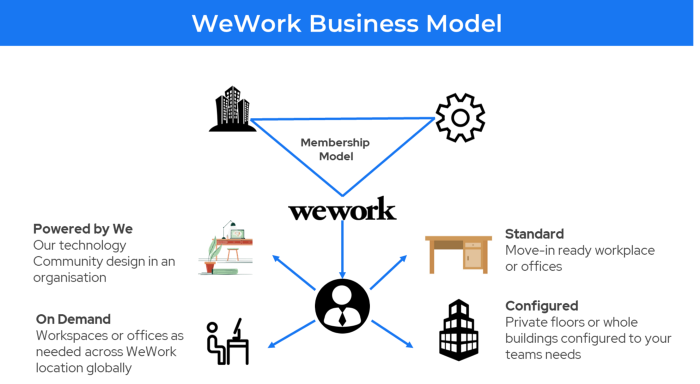
WeWork helps businesses with real estate, legal compliance, maintenance, and repair.
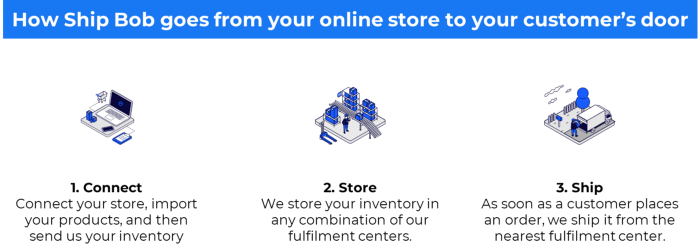
26. The business model for third-party logistics (3PL)
In 3PL, a business outsources product delivery, warehousing, and fulfillment to an external logistics company.
Examples include Ship Bob, Amazon Fulfillment, and more.

3PL partners warehouse, fulfill, and return inbound and outbound items for a charge.
Inbound logistics involves bringing products from suppliers to your warehouse.
Outbound logistics refers to a company's production line, warehouse, and customer.
27. The last-mile delivery paradigm as a commercial strategy
Last-mile delivery is the collection of supply chain actions that reach the end client.
Examples include Rappi, Gojek, and Postmates.
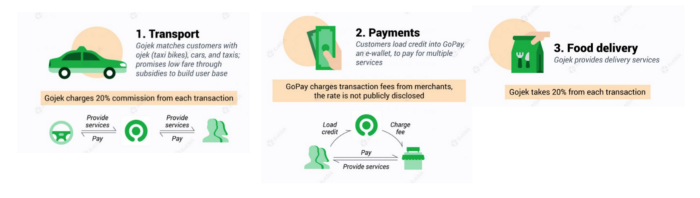
Last-mile is tied to on-demand and has a nighttime peak.
28. The use of affiliate marketing
Affiliate marketing involves promoting other companies' products and charging commissions.
Examples include Hubspot, Amazon, and Skillshare.
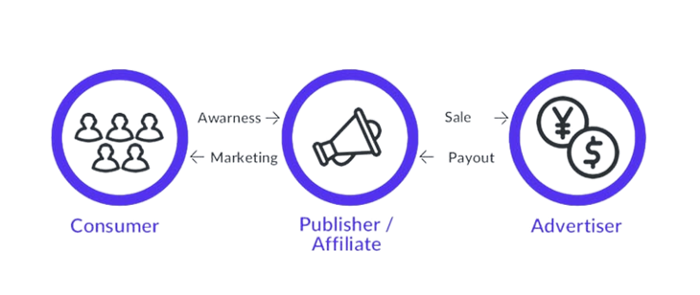
Your favorite youtube channel probably uses these short amazon links to get 5% of sales.
Affiliate marketing's benefits
In exchange for a success fee or commission, it enables numerous independent marketers to promote on its behalf.
Ensure system transparency by giving the influencers a specific tracking link and an online dashboard to view their profits.
Learn about the newest bargains and have access to promotional materials.
29. The business model for virtual goods
This is an in-app purchase for an intangible product.
Examples include PubG, Roblox, Candy Crush, etc.
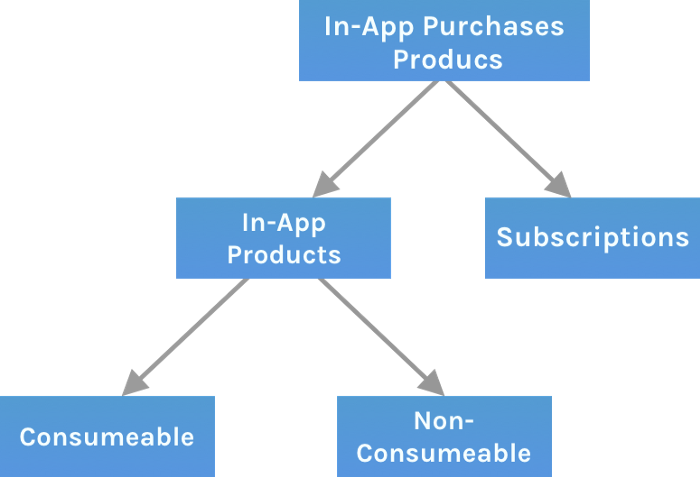
Consumables are like gaming cash that runs out. Non-consumable products provide a permanent advantage without repeated purchases.
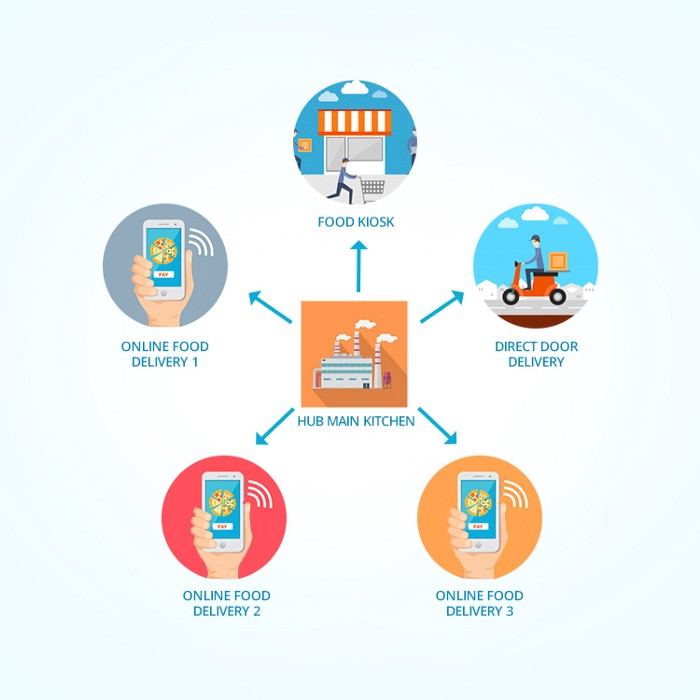
30. Business Models for Cloud Kitchens
Ghost, Dark, Black Box, etc.
Delivery-only restaurant.
These restaurants don't provide dine-in, only delivery.
For instance, NextBite and Faasos
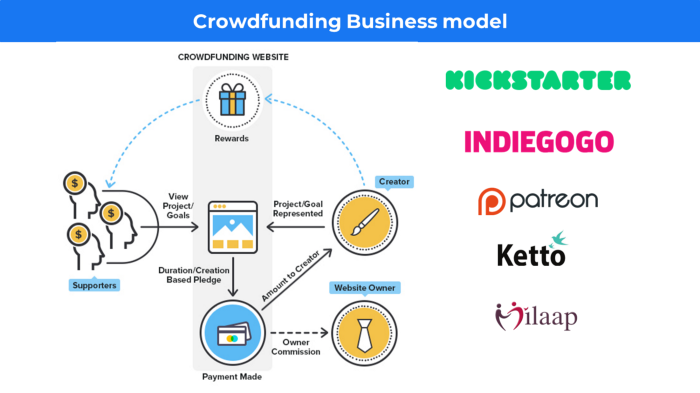
31. Crowdsourcing as a Business Model
Crowdsourcing = Using the crowd as a platform's source.
In crowdsourcing, you get support from people around the world without hiring them.
Crowdsourcing sites
Open-Source Software gives access to the software's source code so that developers can edit or enhance it. Examples include Firefox browsers and Linux operating systems.
Crowdfunding The oculus headgear would be an example of crowdfunding in essence, with no expectations.

Jan-Patrick Barnert
4 years ago
Wall Street's Bear Market May Stick Around
If history is any guide, this bear market might be long and severe.
This is the S&P 500 Index's fourth such incident in 20 years. The last bear market of 2020 was a "shock trade" caused by the Covid-19 pandemic, although earlier ones in 2000 and 2008 took longer to bottom out and recover.
Peter Garnry, head of equities strategy at Saxo Bank A/S, compares the current selloff to the dotcom bust of 2000 and the 1973-1974 bear market marked by soaring oil prices connected to an OPEC oil embargo. He blamed high tech valuations and the commodity crises.
"This drop might stretch over a year and reach 35%," Garnry wrote.
Here are six bear market charts.
Time/depth
The S&P 500 Index plummeted 51% between 2000 and 2002 and 58% during the global financial crisis; it took more than 1,000 trading days to recover. The former took 638 days to reach a bottom, while the latter took 352 days, suggesting the present selloff is young.
Valuations
Before the tech bubble burst in 2000, valuations were high. The S&P 500's forward P/E was 25 times then. Before the market fell this year, ahead values were near 24. Before the global financial crisis, stocks were relatively inexpensive, but valuations dropped more than 40%, compared to less than 30% now.
Earnings
Every stock crash, especially earlier bear markets, returned stocks to fundamentals. The S&P 500 decouples from earnings trends but eventually recouples.
Support
Central banks won't support equity investors just now. The end of massive monetary easing will terminate a two-year bull run that was among the strongest ever, and equities may struggle without cheap money. After years of "don't fight the Fed," investors must embrace a new strategy.
Bear Haunting Bear
If the past is any indication, rising government bond yields are bad news. After the financial crisis, skyrocketing rates and a falling euro pushed European stock markets back into bear territory in 2011.
Inflation/rates
The current monetary policy climate differs from past bear markets. This is the first time in a while that markets face significant inflation and rising rates.
This post is a summary. Read full article here

Scott Galloway
3 years ago
First Health
ZERO GRACE/ZERO MALICE
Amazon's purchase of One Medical could speed up American healthcare
The U.S. healthcare industry is a 7-ton seal bleeding at sea. Predators are circling. Unearned margin: price increases relative to inflation without quality improvements. Amazon is the 11-foot megalodon with 7-inch teeth. Amazon is no longer circling... but attacking.
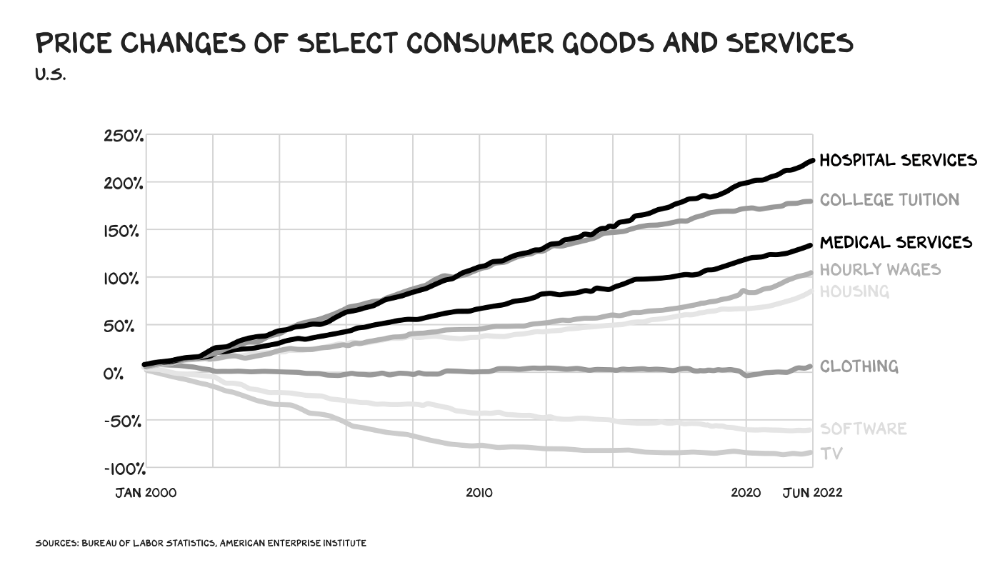
In 2020 dollars, per capita U.S. healthcare spending increased from $2,968 in 1980 to $12,531. The result is a massive industry with 13% of the nation's workers and a fifth of GDP.
Doctor No
In 40 years, healthcare has made progress. From 73.7 in 1980 to 78.8 in 2019, life expectancy rose (before Covid knocked it back down a bit). Pharmacological therapies have revolutionized, and genetic research is paying off. The financial return, improvement split by cost increases, is terrible. No country has expense rises like the U.S., and no one spends as much per capita as we do. Developed countries have longer life expectancies, healthier populations, and less economic hardship.

Two-thirds of U.S. personal bankruptcies are due to medical expenses and/or missed work. Mom or Dad getting cancer could bankrupt many middle-class American families. 40% of American adults delayed or skipped needed care due to cost. Every healthcare improvement seems to have a downside. Same pharmacological revolution that helped millions caused opioid epidemic. Our results are poor in many areas: The U.S. has a high infant mortality rate.
Healthcare is the second-worst retail industry in the country. Gas stations are #1. Imagine walking into a Best Buy to buy a TV and a Blue Shirt associate requests you fill out the same 14 pages of paperwork you filled out yesterday. Then you wait in a crowded room until they call you, 20 minutes after the scheduled appointment you were asked to arrive early for, to see the one person in the store who can talk to you about TVs, who has 10 minutes for you. The average emergency room wait time in New York is 6 hours and 10 minutes.
If it's bad for the customer, it's worse for the business. Physicians spend 27% of their time helping patients; 49% on EHRs. Documentation, order entry, billing, and inbox management. Spend a decade getting an M.D., then become a bureaucrat.
No industry better illustrates scale diseconomies. If we got the same return on healthcare spending as other countries, we'd all live to 100. We could spend less, live longer and healthier, and pay off the national debt in 15 years. U.S. healthcare is the worst ever.
What now? Competition is at the heart of capitalism, the worst system of its kind.
Priority Time
Amazon is buying One Medical for $3.9 billion. I think this deal will liberate society. Two years in, I think One Medical is great. When I got Covid, I pressed the One Medical symbol on my phone; a nurse practitioner prescribed Paxlovid and told me which pharmacies had it in stock.
Amazon enables the company's vision. One Medical's stock is down to $10 from $40 at the start of 2021. Last year, it lost $250 million and needs cash (Amazon has $60 billion). ONEM must grow. The service has 736,000 members. Half of U.S. households have Amazon Prime. Finally, delivery. One Medical is a digital health/physical office hybrid, but you must pick up medication at the pharmacy. Upgrade your Paxlovid delivery time after a remote consultation. Amazon's core competency means it'll happen. Healthcare speed and convenience will feel alien.
It's been a long, winding road to disruption. Amazon, JPMorgan, and Berkshire Hathaway formed Haven four years ago to provide better healthcare for their 1.5 million employees. It rocked healthcare stocks the morning of the press release, but folded in 2021.
Amazon Care is an employee-focused service. Home-delivered virtual health services and nurses. It's doing well, expanding nationwide, and providing healthcare for other companies. Hilton is Amazon Care's biggest customer. The acquisition of One Medical will bring 66 million Prime households capital, domain expertise, and billing infrastructure. Imagine:
"Alexa, I'm hot and my back hurts."
"Connecting you to a Prime doctor now."
Want to vs. Have to
I predicted Amazon entering healthcare years ago. Why? For the same reason Apple is getting into auto. Amazon's P/E is 56, double Walmart's. The corporation must add $250 billion in revenue over the next five years to retain its share price. White-label clothes or smart home products won't generate as much revenue. It must enter a huge market without scale, operational competence, and data skills.
Current Situation
Healthcare reform benefits both consumers and investors. In 2015, healthcare services had S&P 500-average multiples. The market is losing faith in public healthcare businesses' growth. Healthcare services have lower EV/EBITDA multiples than the S&P 500.

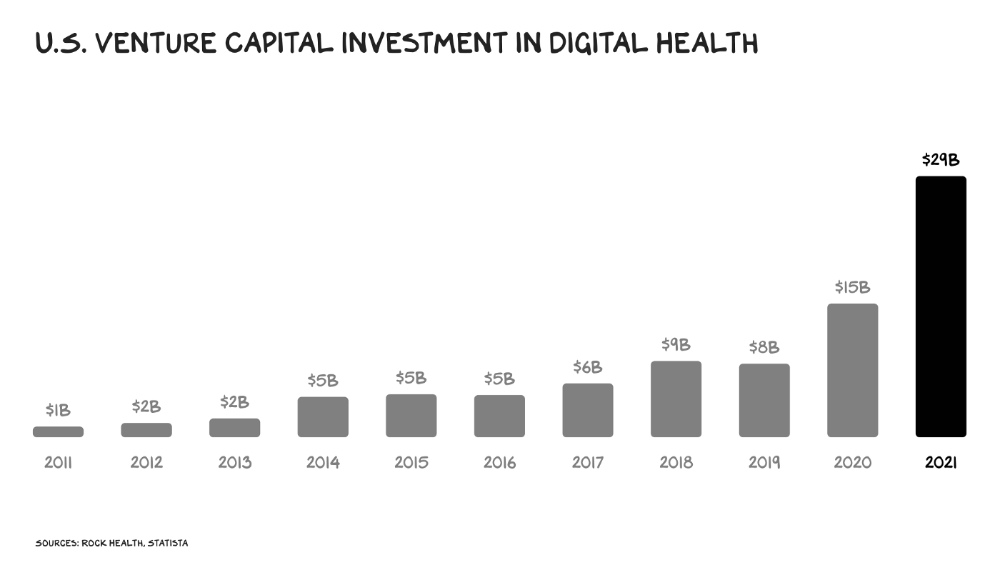
Amazon isn't the only prey-hunter. Walmart and Alibaba are starting pharmacies. Uber is developing medical transportation. Private markets invested $29 billion in telehealth last year, up 95% from 2020.
The pandemic accelerated telehealth, the immediate unlock. After the first positive Covid case in the U.S., services that had to be delivered in person shifted to Zoom... We lived. We grew. Video house calls continued after in-person visits were allowed. McKinsey estimates telehealth visits are 38 times pre-pandemic levels. Doctors adopted the technology, regulators loosened restrictions, and patients saved time. We're far from remote surgery, but many patient visits are unnecessary. A study of 40 million patients during lockdown found that for chronic disease patients, online visits didn't affect outcomes. This method of care will only improve.

Amazon's disruption will be significant and will inspire a flood of capital, startups, and consumer brands. Mark Cuban launched a pharmacy that eliminates middlemen in January. Outcome? A 90-day supply of acid-reflux medication costs $17. Medicare could have saved $3.6 billion by buying generic drugs from Cuban's pharmacy. Other apex predators will look at different limbs of the carcass for food. Nike could enter healthcare via orthopedics, acupuncture, and chiropractic. LVMH, L'Oréal, and Estée Lauder may launch global plastic surgery brands. Hilton and Four Seasons may open hospitals. Lennar and Pulte could build "Active Living" communities that Nana would leave feet first, avoiding the expense and tragedy of dying among strangers.
Risks
Privacy matters: HIV status is different from credit card and billing address. Most customers (60%) feel fine sharing personal health data via virtual technologies, though. Unavoidable. 85% of doctors believe data-sharing and interoperability will become the norm. Amazon is the most trusted tech company for handling personal data. Not Meta: Amazon.
What about antitrust, then?
Amazon should be required to spin off AWS and/or Amazon Fulfillment and banned from promoting its own products. It should be allowed to acquire hospitals. One Medical's $3.9 billion acquisition is a drop in the bucket compared to UnitedHealth's $498 billion market valuation.
Antitrust enforcement shouldn't assume some people/firms are good/bad. It should recognize that competition is good and focus on making markets more competitive in each deal. The FTC should force asset divestitures in e-commerce, digital marketing, and social media. These companies can also promote competition in a social ill.
U.S. healthcare makes us fat, depressed, and broke. Competition has produced massive value and prosperity across most of our economy.
Dear Amazon … bring it.