


More on Web3 & Crypto

Julie Plavnik
3 years ago
How to Become a Crypto Broker [Complying and Making Money]
Three options exist. The third one is the quickest and most fruitful.
You've mastered crypto trading and want to become a broker.
So you may wonder: Where to begin?
If so, keep reading.
Today I'll compare three different approaches to becoming a cryptocurrency trader.
What are cryptocurrency brokers, and how do they vary from stockbrokers?
A stockbroker implements clients' market orders (retail or institutional ones).
Brokerage firms are regulated, insured, and subject to regulatory monitoring.
Stockbrokers are required between buyers and sellers. They can't trade without a broker. To trade, a trader must open a broker account and deposit money. When a trader shops, he tells his broker what orders to place.
Crypto brokerage is trade intermediation with cryptocurrency.
In crypto trading, however, brokers are optional.
Crypto exchanges offer direct transactions. Open an exchange account (no broker needed) and make a deposit.
Question:
Since crypto allows DIY trading, why use a broker?
Let's compare cryptocurrency exchanges vs. brokers.
Broker versus cryptocurrency exchange
Most existing crypto exchanges are basically brokers.
Examine their primary services:
connecting purchasers and suppliers
having custody of clients' money (with the exception of decentralized cryptocurrency exchanges),
clearance of transactions.
Brokerage is comparable, don't you think?
There are exceptions. I mean a few large crypto exchanges that follow the stock exchange paradigm. They outsource brokerage, custody, and clearing operations. Classic exchange setups are rare in today's bitcoin industry.
Back to our favorite “standard” crypto exchanges. All-in-one exchanges and brokers. And usually, they operate under a broker or a broker-dealer license, save for the exchanges registered somewhere in a free-trade offshore paradise. Those don’t bother with any licensing.
What’s the sense of having two brokers at a time?
Better liquidity and trading convenience.
The crypto business is compartmentalized.
We have CEXs, DEXs, hybrid exchanges, and semi-exchanges (those that aggregate liquidity but do not execute orders on their sides). All have unique regulations and act as sovereign states.
There are about 18k coins and hundreds of blockchain protocols, most of which are heterogeneous (i.e., different in design and not interoperable).
A trader must register many accounts on different exchanges, deposit funds, and manage them all concurrently to access global crypto liquidity.
It’s extremely inconvenient.
Crypto liquidity fragmentation is the largest obstacle and bottleneck blocking crypto from mass adoption.
Crypto brokers help clients solve this challenge by providing one-gate access to deep and diverse crypto liquidity from numerous exchanges and suppliers. Professionals and institutions need it.
Another killer feature of a brokerage may be allowing clients to trade crypto with fiat funds exclusively, without fiat/crypto conversion. It is essential for professional and institutional traders.
Who may work as a cryptocurrency broker?
Apparently, not anyone. Brokerage requires high-powered specialists because it involves other people's money.
Here's the essentials:
excellent knowledge, skills, and years of trading experience
high-quality, quick, and secure infrastructure
highly developed team
outstanding trading capital
High-ROI network: long-standing, trustworthy connections with customers, exchanges, liquidity providers, payment gates, and similar entities
outstanding marketing and commercial development skills.
What about a license for a cryptocurrency broker? Is it necessary?
Complex question.
If you plan to play in white-glove jurisdictions, you may need a license. For example, in the US, as a “money transmitter” or as a CASSP (crypto asset secondary services provider) in Australia.
Even in these jurisdictions, there are no clear, holistic crypto brokerage and licensing policies.
Your lawyer will help you decide if your crypto brokerage needs a license.
Getting a license isn't quick. Two years of patience are needed.
How can you turn into a cryptocurrency broker?
Finally, we got there! 🎉
Three actionable ways exist:
To kickstart a regulated stand-alone crypto broker
To get a crypto broker franchise, and
To become a liquidity network broker.
Let's examine each.
1. Opening a regulated cryptocurrency broker
It's difficult. Especially If you're targeting first-world users.
You must comply with many regulatory, technical, financial, HR, and reporting obligations to keep your organization running. Some are mentioned above.
The licensing process depends on the products you want to offer (spots or derivatives) and the geographic areas you plan to service. There are no general rules for that.
In an overgeneralized way, here are the boxes you will have to check:
capital availability (usually a large amount of capital c is required)
You will have to move some of your team members to the nation providing the license in order to establish an office presence there.
the core team with the necessary professional training (especially applies to CEO, Head of Trading, Assistant to Head of Trading, etc.)
insurance
infrastructure that is trustworthy and secure
adopted proper AML/KYC/financial monitoring policies, etc.
Assuming you passed, what's next?
I bet it won’t be mind-blowing for you that the license is just a part of the deal. It won't attract clients or revenue.
To bring in high-dollar clientele, you must be a killer marketer and seller. It's not easy to convince people to give you money.
You'll need to be a great business developer to form successful, long-term agreements with exchanges (ideally for no fees), liquidity providers, banks, payment gates, etc. Persuade clients.
It's a tough job, isn't it?

I expect a Quora-type question here:
Can I start an unlicensed crypto broker?
Well, there is always a workaround with crypto!
You can register your broker in a free-trade zone like Seychelles to avoid US and other markets with strong watchdogs.
This is neither wise nor sustainable.
First, such experiments are illegal.
Second, you'll have trouble attracting clients and strategic partners.
A license equals trust. That’s it.
Even a pseudo-license from Mauritius matters.
Here are this method's benefits and downsides.
Cons first.
As you navigate this difficult and expensive legal process, you run the risk of missing out on business prospects. It's quite simple to become excellent compliance yet unable to work. Because your competitors are already courting potential customers while you are focusing all of your effort on paperwork.
Only God knows how long it will take you to pass the break-even point when everything with the license has been completed.
It is a money-burning business, especially in the beginning when the majority of your expenses will go toward marketing, sales, and maintaining license requirements. Make sure you have the fortitude and resources necessary to face such a difficult challenge.
Pros
It may eventually develop into a tool for making money. Because big guys who are professionals at trading require a white-glove regulated brokerage. You have every possibility if you work hard in the areas of sales, marketing, business development, and wealth. Simply put, everything must align.
Launching a regulated crypto broker is analogous to launching a crypto exchange. It's ROUGH. Sure you can take it?
2. Franchise for Crypto Broker (Crypto Sub-Brokerage)
A broker franchise is easier and faster than becoming a regulated crypto broker. Not a traditional brokerage.
A broker franchisee, often termed a sub-broker, joins with a broker (a franchisor) to bring them new clients. Sub-brokers market a broker's products and services to clients.
Sub-brokers are the middlemen between a broker and an investor.
Why is sub-brokering easier?
less demanding qualifications and legal complexity. All you need to do is keep a few certificates on hand (each time depends on the jurisdiction).
No significant investment is required
there is no demand that you be a trading member of an exchange, etc.
As a sub-broker, you can do identical duties without as many rights and certifications.
What about the crypto broker franchise?
Sub-brokers aren't common in crypto.
In most existing examples (PayBito, PCEX, etc.), franchises are offered by crypto exchanges, not brokers. Though we remember that crypto exchanges are, in fact, brokers, do we?
Similarly:
For a commission, a franchiser crypto broker receives new leads from a crypto sub-broker.
See above for why enrolling is easy.
Finding clients is difficult. Most crypto traders prefer to buy-sell on their own or through brokers over sub-broker franchises.
3. Broker of the Crypto Trading Network (or a Network Broker)
It's the greatest approach to execute crypto brokerage, based on effort/return.
Network broker isn't an established word. I wrote it for clarity.
Remember how we called crypto liquidity fragmentation the current crypto finance paradigm's main bottleneck?
Where there's a challenge, there's progress.
Several well-funded projects are aiming to fix crypto liquidity fragmentation. Instead of launching another crypto exchange with siloed trading, the greatest minds create trading networks that aggregate crypto liquidity from desynchronized sources and enable quick, safe, and affordable cross-blockchain transactions. Each project offers a distinct option for users.
Crypto liquidity implies:
One-account access to cryptocurrency liquidity pooled from network participants' exchanges and other liquidity sources
compiled price feeds
Cross-chain transactions that are quick and inexpensive, even for HFTs
link between participants of all kinds, and
interoperability among diverse blockchains
Fast, diversified, and cheap global crypto trading from one account.
How does a trading network help cryptocurrency brokers?
I’ll explain it, taking Yellow Network as an example.
Yellow provides decentralized Layer-3 peer-to-peer trading.
trade across chains globally with real-time settlement and
Between cryptocurrency exchanges, brokers, trading companies, and other sorts of network members, there is communication and the exchange of financial information.
Have you ever heard about ECN (electronic communication network)? If not, it's an automated system that automatically matches buy and sell orders. Yellow is a decentralized digital asset ECN.
Brokers can:
Start trading right now without having to meet stringent requirements; all you need to do is integrate with Yellow Protocol and successfully complete some KYC verification.
Access global aggregated crypto liquidity through a single point.
B2B (Broker to Broker) liquidity channels that provide peer liquidity from other brokers. Orders from the other broker will appear in the order book of a broker who is peering with another broker on the market. It will enable a broker to broaden his offer and raise the total amount of liquidity that is available to his clients.
Select a custodian or use non-custodial practices.
Comparing network crypto brokerage to other types:
A licensed stand-alone brokerage business is much more difficult and time-consuming to launch than network brokerage, and
Network brokerage, in contrast to crypto sub-brokerage, is scalable, independent, and offers limitless possibilities for revenue generation.
Yellow Network Whitepaper. has more details on how to start a brokerage business and what rewards you'll obtain.
Final thoughts
There are three ways to become a cryptocurrency broker, including the non-conventional liquidity network brokerage. The last option appears time/cost-effective.
Crypto brokerage isn't crowded yet. Act quickly to find your right place in this market.
Choose the way that works for you best and see you in crypto trading.
Discover Web3 & DeFi with Yellow Network!
Yellow, powered by Openware, is developing a cross-chain P2P liquidity aggregator to unite the crypto sector and provide global remittance services that aid people.
Join the Yellow Community and plunge into this decade's biggest product-oriented crypto project.
Observe Yellow Twitter
Enroll in Yellow Telegram
Visit Yellow Discord.
On Hacker Noon, look us up.
Yellow Network will expose development, technology, developer tools, crypto brokerage nodes software, and community liquidity mining.

Chris
2 years ago
What the World's Most Intelligent Investor Recently Said About Crypto
Cryptoshit. This thing is crazy to buy.

Charlie Munger is revered and powerful in finance.
Munger, vice chairman of Berkshire Hathaway, is noted for his wit, no-nonsense attitude to investment, and ability to spot promising firms and markets.
Munger's crypto views have upset some despite his reputation as a straight shooter.
“There’s only one correct answer for intelligent people, just totally avoid all the people that are promoting it.” — Charlie Munger
The Munger Interview on CNBC (4:48 secs)
This Monday, CNBC co-anchor Rebecca Quick interviewed Munger and brought up his 2007 statement, "I'm not allowed to have an opinion on this subject until I can present the arguments against my viewpoint better than the folks who are supporting it."
Great investing and life advice!
If you can't explain the opposing reasons, you're not informed enough to have an opinion.
In today's world, it's important to grasp both sides of a debate before supporting one.
Rebecca inquired:
Does your Wall Street Journal article on banning cryptocurrency apply? If so, would you like to present the counterarguments?
Mungers reply:
I don't see any viable counterarguments. I think my opponents are idiots, hence there is no sensible argument against my position.
Consider his words.
Do you believe Munger has studied both sides?
He said, "I assume my opponents are idiots, thus there is no sensible argument against my position."
This is worrisome, especially from a guy who once encouraged studying both sides before forming an opinion.
Munger said:
National currencies have benefitted humanity more than almost anything else.
Hang on, I think we located the perpetrator.
Munger thinks crypto will replace currencies.
False.
I doubt he studied cryptocurrencies because the name is deceptive.
He misread a headline as a Dollar destroyer.
Cryptocurrencies are speculations.
Like Tesla, Amazon, Apple, Google, Microsoft, etc.
Crypto won't replace dollars.
In the interview with CNBC, Munger continued:
“I’m not proud of my country for allowing this crap, what I call the cryptoshit. It’s worthless, it’s no good, it’s crazy, it’ll do nothing but harm, it’s anti-social to allow it.” — Charlie Munger
Not entirely inaccurate.
Daily cryptos are established solely to pump and dump regular investors.
Let's get into Munger's crypto aversion.
Rat poison is bitcoin.
Munger famously dubbed Bitcoin rat poison and a speculative bubble that would implode.
Partially.
But the bubble broke. Since 2021, the market has fallen.
Scam currencies and NFTs are being eliminated, which I like.
Whoa.
Why does Munger doubt crypto?
Mungers thinks cryptocurrencies has no intrinsic value.
He worries about crypto fraud and money laundering.
Both are valid issues.
Yet grouping crypto is intellectually dishonest.
Ethereum, Bitcoin, Solana, Chainlink, Flow, and Dogecoin have different purposes and values (not saying they’re all good investments).
Fraudsters who hurt innocents will be punished.
Therefore, complaining is useless.
Why not stop it? Repair rather than complain.
Regrettably, individuals today don't offer solutions.
Blind Areas for Mungers
As with everyone, Mungers' bitcoin views may be impacted by his biases and experiences.
OK.
But Munger has always advocated classic value investing and may be wary of investing in an asset outside his expertise.
Mungers' banking and insurance investments may influence his bitcoin views.
Could a coworker or acquaintance have told him crypto is bad and goes against traditional finance?
Right?
Takeaways
Do you respect Charlie Mungers?
Yes and no, like any investor or individual.
To understand Mungers' bitcoin beliefs, you must be critical.
Mungers is a successful investor, but his views about bitcoin should be considered alongside other viewpoints.
Munger’s success as an investor has made him an influencer in the space.
Influence gives power.
He controls people's thoughts.
Munger's ok. He will always be heard.
I'll do so cautiously.

Jeff Scallop
3 years ago
The Age of Decentralized Capitalism and DeFi
DeCap is DeFi's killer app.
“Software is eating the world.” Marc Andreesen, venture capitalist
DeFi. Imagine a blockchain-based alternative financial system that offers the same products and services as traditional finance, but with more variety, faster, more secure, lower cost, and simpler access.
Decentralised finance (DeFi) is a marketplace without gatekeepers or central authority managing the flow of money, where customers engage directly with smart contracts running on a blockchain.
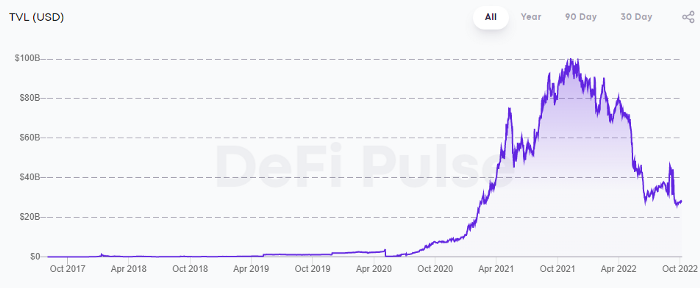
DeFi grew exponentially in 2020/21, with Total Value Locked (an inadequate estimate for market size) topping at $100 billion. After that, it crashed.
The accumulation of funds by individuals with high discretionary income during the epidemic, the novelty of crypto trading, and the high yields given (5% APY for stablecoins on established platforms to 100%+ for risky assets) are among the primary elements explaining this exponential increase.
No longer your older brothers DeFi
Since transactions are anonymous, borrowers had to overcollateralize DeFi 1.0. To borrow $100 in stablecoins, you must deposit $150 in ETH. DeFi 1.0's business strategy raises two problems.
Why does DeFi offer interest rates that are higher than those of the conventional financial system?;
Why would somebody put down more cash than they intended to borrow?
Maxed out on their own resources, investors took loans to acquire more crypto; the demand for those loans raised DeFi yields, which kept crypto prices increasing; as crypto prices rose, investors made a return on their positions, allowing them to deposit more money and borrow more crypto.
This is a bull market game. DeFi 1.0's overcollateralization speculation is dead. Cryptocrash sank it.
The “speculation by overcollateralisation” world of DeFi 1.0 is dead
At a JP Morgan digital assets conference, institutional investors were more interested in DeFi than crypto or fintech. To me, that shows DeFi 2.0's institutional future.
DeFi 2.0 protocols must handle KYC/AML, tax compliance, market abuse, and cybersecurity problems to be institutional-ready.
Stablecoins gaining market share under benign regulation and more CBDCs coming online in the next couple of years could help DeFi 2.0 separate from crypto volatility.
DeFi 2.0 will have a better footing to finally decouple from crypto volatility
Then we can transition from speculation through overcollateralization to DeFi's genuine comparative advantages: cheaper transaction costs, near-instant settlement, more efficient price discovery, faster time-to-market for financial innovation, and a superior audit trail.
Akin to Amazon for financial goods
Amazon decimated brick-and-mortar shops by offering millions of things online, warehouses by keeping just-in-time inventory, and back-offices by automating invoicing and payments. Software devoured retail. DeFi will eat banking with software.
DeFi is the Amazon for financial items that will replace fintech. Even the most advanced internet brokers offer only 100 currency pairings and limited bonds, equities, and ETFs.
Old banks settlement systems and inefficient, hard-to-upgrade outdated software harm them. For advanced gamers, it's like driving an F1 vehicle on dirt.
It is like driving a F1 car on a dirt road, for the most sophisticated players
Central bankers throughout the world know how expensive and difficult it is to handle cross-border payments using the US dollar as the reserve currency, which is vulnerable to the economic cycle and geopolitical tensions.
Decentralization is the only method to deliver 24h global financial markets. DeFi 2.0 lets you buy and sell startup shares like Google or Tesla. VC funds will trade like mutual funds. Or create a bundle coverage for your car, house, and NFTs. Defi 2.0 consumes banking and creates Global Wall Street.
Defi 2.0 is how software eats banking and delivers the global Wall Street
Decentralized Capitalism is Emerging
90% of markets are digital. 10% is hardest to digitalize. That's money creation, ID, and asset tokenization.
90% of financial markets are already digital. The only problem is that the 10% left is the hardest to digitalize
Debt helped Athens construct a powerful navy that secured trade routes. Bonds financed the Renaissance's wars and supply chains. Equity fueled industrial growth. FX drove globalization's payments system. DeFi's plans:
If the 20th century was a conflict between governments and markets over economic drivers, the 21st century will be between centralized and decentralized corporate structures.
Offices vs. telecommuting. China vs. onshoring/friendshoring. Oil & gas vs. diverse energy matrix. National vs. multilateral policymaking. DAOs vs. corporations Fiat vs. crypto. TradFi vs.
An age where the network effects of the sharing economy will overtake the gains of scale of the monopolistic competition economy
This is the dawn of Decentralized Capitalism (or DeCap), an age where the network effects of the sharing economy will reach a tipping point and surpass the scale gains of the monopolistic competition economy, further eliminating inefficiencies and creating a more robust economy through better data and automation. DeFi 2.0 enables this.
DeFi needs to pay the piper now.
DeCap won't be Web3.0's Shangri-La, though. That's too much for an ailing Atlas. When push comes to shove, DeFi folks want to survive and fight another day for the revolution. If feasible, make a tidy profit.
Decentralization wasn't meant to circumvent regulation. It circumvents censorship. On-ramp, off-ramp measures (control DeFi's entry and exit points, not what happens in between) sound like a good compromise for DeFi 2.0.
The sooner authorities realize that DeFi regulation is made ex-ante by writing code and constructing smart contracts with rules, the faster DeFi 2.0 will become the more efficient and safe financial marketplace.
More crucially, we must boost system liquidity. DeFi's financial stability risks are downplayed. DeFi must improve its liquidity management if it's to become mainstream, just as banks rely on capital constraints.
This reveals the complex and, frankly, inadequate governance arrangements for DeFi protocols. They redistribute control from tokenholders to developers, which is bad governance regardless of the economic model.
But crypto can only ride the existing banking system for so long before forming its own economy. DeFi will upgrade web2.0's financial rails till then.
You might also like

DC Palter
2 years ago
Why Are There So Few Startups in Japan?
Japan's startup challenge: 7 reasons

Every day, another Silicon Valley business is bought for a billion dollars, making its founders rich while growing the economy and improving consumers' lives.
Google, Amazon, Twitter, and Medium dominate our daily lives. Tesla automobiles and Moderna Covid vaccinations.
The startup movement started in Silicon Valley, California, but the rest of the world is catching up. Global startup buzz is rising. Except Japan.
644 of CB Insights' 1170 unicorns—successful firms valued at over $1 billion—are US-based. China follows with 302 and India third with 108.
Japan? 6!
1% of US startups succeed. The third-largest economy is tied with small Switzerland for startup success.
Mexico (8), Indonesia (12), and Brazil (12) have more successful startups than Japan (16). South Korea has 16. Yikes! Problem?
Why Don't Startups Exist in Japan More?
Not about money. Japanese firms invest in startups. To invest in startups, big Japanese firms create Silicon Valley offices instead of Tokyo.
Startups aren't the issue either. Local governments are competing to be Japan's Shirikon Tani, providing entrepreneurs financing, office space, and founder visas.
Startup accelerators like Plug and Play in Tokyo, Osaka, and Kyoto, the Startup Hub in Kobe, and Google for Startups are many.
Most of the companies I've encountered in Japan are either local offices of foreign firms aiming to expand into the Japanese market or small businesses offering local services rather than disrupting a staid industry with new ideas.
There must be a reason Japan can develop world-beating giant corporations like Toyota, Nintendo, Shiseido, and Suntory but not inventive startups.
Culture, obviously. Japanese culture excels in teamwork, craftsmanship, and quality, but it hates moving fast, making mistakes, and breaking things.
If you have a brilliant idea in Silicon Valley, quit your job, get money from friends and family, and build a prototype. To fund the business, you approach angel investors and VCs.
Most non-startup folks don't aware that venture capitalists don't want good, profitable enterprises. That's wonderful if you're developing a solid small business to consult, open shops, or make a specialty product. However, you must pay for it or borrow money. Venture capitalists want moon rockets. Silicon Valley is big or bust. Almost 90% will explode and crash. The few successes are remarkable enough to make up for the failures.
Silicon Valley's high-risk, high-reward attitude contrasts with Japan's incrementalism. Japan makes the best automobiles and cleanrooms, but it fails to produce new items that grow the economy.
Changeable? Absolutely. But, what makes huge manufacturing enterprises successful and what makes Japan a safe and comfortable place to live are inextricably connected with the lack of startups.
Barriers to Startup Development in Japan
These are the 7 biggest obstacles to Japanese startup success.
Unresponsive Employment Market
While the lifelong employment system in Japan is evolving, the average employee stays at their firm for 12 years (15 years for men at large organizations) compared to 4.3 years in the US. Seniority, not experience or aptitude, determines career routes, making it tough to quit a job to join a startup and then return to corporate work if it fails.
Conservative Buyers
Even if your product is buggy and undocumented, US customers will migrate to a cheaper, superior one. Japanese corporations demand perfection from their trusted suppliers and keep with them forever. Startups need income fast, yet product evaluation takes forever.
Failure intolerance
Japanese business failures harm lives. Failed forever. It hinders risk-taking. Silicon Valley embraces failure. Build another startup if your first fails. Build a third if that fails. Every setback is viewed as a learning opportunity for success.
4. No Corporate Purchases
Silicon Valley industrial giants will buy fast-growing startups for a lot of money. Many huge firms have stopped developing new goods and instead buy startups after the product is validated.
Japanese companies prefer in-house product development over startup acquisitions. No acquisitions mean no startup investment and no investor reward.
Startup investments can also be monetized through stock market listings. Public stock listings in Japan are risky because the Nikkei was stagnant for 35 years while the S&P rose 14x.
5. Social Unity Above Wealth
In Silicon Valley, everyone wants to be rich. That creates a competitive environment where everyone wants to succeed, but it also promotes fraud and societal problems.
Japan values communal harmony above individual success. Wealthy folks and overachievers are avoided. In Japan, renegades are nearly impossible.
6. Rote Learning Education System
Japanese high school graduates outperform most Americans. Nonetheless, Japanese education is known for its rote memorization. The American system, which fails too many kids, emphasizes creativity to create new products.
Immigration.
Immigrants start 55% of successful Silicon Valley firms. Some come for university, some to escape poverty and war, and some are recruited by Silicon Valley startups and stay to start their own.
Japan is difficult for immigrants to start a business due to language barriers, visa restrictions, and social isolation.
How Japan Can Promote Innovation
Patchwork solutions to deep-rooted cultural issues will not work. If customers don't buy things, immigration visas won't aid startups. Startups must have a chance of being acquired for a huge sum to attract investors. If risky startups fail, employees won't join.
Will Japan never have a startup culture?
Once a consensus is reached, Japan changes rapidly. A dwindling population and standard of living may lead to such consensus.
Toyota and Sony were firms with renowned founders who used technology to transform the world. Repeatable.
Silicon Valley is flawed too. Many people struggle due to wealth disparities, job churn and layoffs, and the tremendous ups and downs of the economy caused by stock market fluctuations.
The founders of the 10% successful startups are heroes. The 90% that fail and return to good-paying jobs with benefits are never mentioned.
Silicon Valley startup culture and Japanese corporate culture are opposites. Each have pros and cons. Big Japanese corporations make the most reliable, dependable, high-quality products yet move too slowly. That's good for creating cars, not social networking apps.
Can innovation and success be encouraged without eroding social cohesion? That can motivate software firms to move fast and break things while recognizing the beauty and precision of expert craftsmen? A hybrid culture where Japan can make the world's best and most original items. Hopefully.

Todd Lewandowski
3 years ago
DWTS: How to Organize Your To-Do List Quickly
Don't overcomplicate to-do lists. DWTS (Done, Waiting, Top 3, Soon) organizes your to-dos.

How Are You Going to Manage Everything?
Modern America is busy. Work involves meetings. Anytime, Slack communications arrive. Many software solutions offer a @-mention notification capability. Emails.
Work obligations continue. At home, there are friends, family, bills, chores, and fun things.
How are you going to keep track of it all? Enter the todo list. It’s been around forever. It’s likely to stay forever in some way, shape, or form.
Everybody has their own system. You probably modified something from middle school. Post-its? Maybe it’s an app? Maybe both, another system, or none.
I suggest a format that has worked for me in 15 years of professional and personal life.
Try it out and see if it works for you. If not, no worries. You do you! Hopefully though you can learn a thing or two, and I from you too.
It is merely a Google Doc, yes.
It's a giant list. One task per line. Indent subtasks on a new line. Add or move new tasks as needed.
I recommend using Google Docs. It's easy to use and flexible for structuring.
Prioritizing these tasks is key. I organize them using DWTS (Done, Waiting, Top 3, Soon). Chronologically is good because it implicitly provides both a priority (high, medium, low) and an ETA (now, soon, later).
Yes, I recognize the similarities to DWTS (Dancing With The Stars) TV Show. Although I'm not a fan, it's entertaining. The acronym is easy to remember and adds fun to something dull.

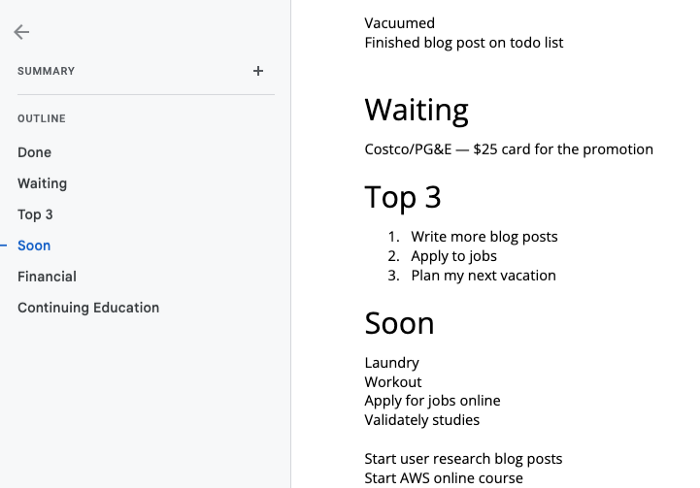
What each section contains
Done
All tasks' endpoint. Finish here. Don't worry about it again.
Waiting
You're blocked and can't continue. Blocked tasks usually need someone. Write Person Task so you know who's waiting.
Blocking tasks shouldn't last long. After a while, remind them kindly. If people don't help you out of kindness, they will if you're persistent.
Top 3
Mental focus areas. These can be short- to mid-term goals or recent accomplishments. 2 to 5 is a good number to stay focused.
Top 3 reminds us to prioritize. If they don't fit your Top 3 goals, delay them.
Every 1:1 at work is a project update. Another chance to list your top 3. You should know your Top 3 well and be able to discuss them confidently.
Soon
Here's your short-term to-do list. Rank them from highest to lowest.
I usually subdivide it with empty lines. First is what I have to do today, then week, then month. Subsections can be arranged however you like.
Inventories by Concept
Tasks that aren’t in your short or medium future go into the backlog.
Eventually you’ll complete these tasks, assign them to someone else, or mark them as “wont’ do” (like done but in another sense).
Backlog tasks don't need to be organized chronologically because their timing and priority may change. Theme-organize them. When planning/strategic, you can choose themes to focus on, so future top 3 topics.
More Tips on Todos
Decide Upon a Morning Goal
Morning routines are universal. Coffee and Wordle. My to-do list is next. Two things:
As needed, update the to-do list: based on the events of yesterday and any fresh priorities.
Pick a few jobs to complete today: Pick a few goals that you know you can complete today. Push the remainder below and move them to the top of the Soon section. I typically select a few tasks I am confident I can complete along with one stretch task that might extend into tomorrow.
Finally. By setting and achieving small goals every day, you feel accomplished and make steady progress on medium and long-term goals.
Tech companies call this a daily standup. Everyone shares what they did yesterday, what they're doing today, and any blockers. The name comes from a tradition of holding meetings while standing up to keep them short. Even though it's virtual, everyone still wants a quick meeting.
Your team may or may not need daily standups. Make a daily review a habit with your coffee.
Review Backwards & Forwards on a regular basis
While you're updating your to-do list daily, take time to review it.
Review your Done list. Remember things you're proud of and things that could have gone better. Your Done list can be long. Archive it so your main to-do list isn't overwhelming.
Future-gaze. What you considered important may no longer be. Reorder tasks. Backlog grooming is a workplace term.
Backwards-and-forwards reviews aren't required often. Every 3-6 months is fine. They help you see the forest as often as the trees.
Final Remarks
Keep your list simple. Done, Waiting, Top 3, Soon. These are the necessary sections. If you like, add more subsections; otherwise, keep it simple.
I recommend a morning review. By having clear goals and an action-oriented attitude, you'll be successful.

Gajus Kuizinas
3 years ago
How a few lines of code were able to eliminate a few million queries from the database
I was entering tens of millions of records per hour when I first published Slonik PostgreSQL client for Node.js. The data being entered was usually flat, making it straightforward to use INSERT INTO ... SELECT * FROM unnset() pattern. I advocated the unnest approach for inserting rows in groups (that was part I).

However, today I’ve found a better way: jsonb_to_recordset.
jsonb_to_recordsetexpands the top-level JSON array of objects to a set of rows having the composite type defined by an AS clause.
jsonb_to_recordset allows us to query and insert records from arbitrary JSON, like unnest. Since we're giving JSON to PostgreSQL instead of unnest, the final format is more expressive and powerful.
SELECT *
FROM json_to_recordset('[{"name":"John","tags":["foo","bar"]},{"name":"Jane","tags":["baz"]}]')
AS t1(name text, tags text[]);
 name |   tags
------+-----------
 John | {foo,bar}
 Jane | {baz}
(2 rows)
Let’s demonstrate how you would use it to insert data.
Inserting data using json_to_recordset
Say you need to insert a list of people with attributes into the database.
const persons = [
  {
    name: 'John',
    tags: ['foo', 'bar']
  },
  {
    name: 'Jane',
    tags: ['baz']
  }
];
You may be tempted to traverse through the array and insert each record separately, e.g.
for (const person of persons) {
await pool.query(sql`
INSERT INTO person (name, tags)
VALUES (
${person.name},
${sql.array(person.tags, 'text[]')}
)
`);
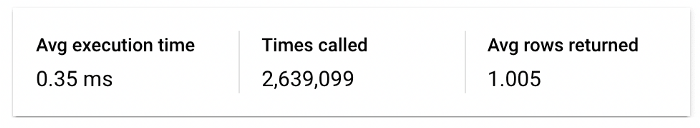
}It's easier to read and grasp when working with a few records. If you're like me and troubleshoot a 2M+ insert query per day, batching inserts may be beneficial.
What prompted the search for better alternatives.
Inserting using unnest pattern might look like this:
await pool.query(sql`
  INSERT INTO public.person (name, tags)
  SELECT t1.name, t1.tags::text[]
  FROM unnest(
    ${sql.array(['John', 'Jane'], 'text')},
    ${sql.array(['{foo,bar}', '{baz}'], 'text')}
  ) AS t1.(name, tags);
`);
You must convert arrays into PostgreSQL array strings and provide them as text arguments, which is unsightly. Iterating the array to create slices for each column is likewise unattractive.
However, with jsonb_to_recordset, we can:
await pool.query(sql`
  INSERT INTO person (name, tags)
  SELECT *
  FROM jsonb_to_recordset(${sql.jsonb(persons)}) AS t(name text, tags text[])
`);
In contrast to the unnest approach, using jsonb_to_recordset we can easily insert complex nested data structures, and we can pass the original JSON document to the query without needing to manipulate it.
In terms of performance they are also exactly the same. As such, my current recommendation is to prefer jsonb_to_recordset whenever inserting lots of rows or nested data structures.