


More on Web3 & Crypto
Langston Thomas
3 years ago
A Simple Guide to NFT Blockchains
Ethereum's blockchain rules NFTs. Many consider it the one-stop shop for NFTs, and it's become the most talked-about and trafficked blockchain in existence.
Other blockchains are becoming popular in NFTs. Crypto-artists and NFT enthusiasts have sought new places to mint and trade NFTs due to Ethereum's high transaction costs and environmental impact.
When choosing a blockchain to mint on, there are several factors to consider. Size, creator costs, consumer spending habits, security, and community input are important. We've created a high-level summary of blockchains for NFTs to help clarify the fast-paced world of web3 tech.
Ethereum
Ethereum currently has the most NFTs. It's decentralized and provides financial and legal services without intermediaries. It houses popular NFT marketplaces (OpenSea), projects (CryptoPunks and the Bored Ape Yacht Club), and artists (Pak and Beeple).
It's also expensive and energy-intensive. This is because Ethereum works using a Proof-of-Work (PoW) mechanism. PoW requires computers to solve puzzles to add blocks and transactions to the blockchain. Solving these puzzles requires a lot of computer power, resulting in astronomical energy loss.
You should consider this blockchain first due to its popularity, security, decentralization, and ease of use.
Solana
Solana is a fast programmable blockchain. Its proof-of-history and proof-of-stake (PoS) consensus mechanisms eliminate complex puzzles. Reduced validation times and fees result.
PoS users stake their cryptocurrency to become a block validator. Validators get SOL. This encourages and rewards users to become stakers. PoH works with PoS to cryptographically verify time between events. Solana blockchain ensures transactions are in order and found by the correct leader (validator).
Solana's PoS and PoH mechanisms keep transaction fees and times low. Solana isn't as popular as Ethereum, so there are fewer NFT marketplaces and blockchain traders.
Tezos
Tezos is a greener blockchain. Tezos rose in 2021. Hic et Nunc was hailed as an economic alternative to Ethereum-centric marketplaces until Nov. 14, 2021.
Similar to Solana, Tezos uses a PoS consensus mechanism and only a PoS mechanism to reduce computational work. This blockchain uses two million times less energy than Ethereum. It's cheaper than Ethereum (but does cost more than Solana).
Tezos is a good place to start minting NFTs in bulk. Objkt is the largest Tezos marketplace.
Flow
Flow is a high-performance blockchain for NFTs, games, and decentralized apps (dApps). Flow is built with scalability in mind, so billions of people could interact with NFTs on the blockchain.
Flow became the NBA's blockchain partner in 2019. Flow, a product of Dapper labs (the team behind CryptoKitties), launched and hosts NBA Top Shot, making the blockchain integral to the popularity of non-fungible tokens.
Flow uses PoS to verify transactions, like Tezos. Developers are working on a model to handle 10,000 transactions per second on the blockchain. Low transaction fees.
Flow NFTs are tradeable on Blocktobay, OpenSea, Rarible, Foundation, and other platforms. NBA, NFL, UFC, and others have launched NFT marketplaces on Flow. Flow isn't as popular as Ethereum, resulting in fewer NFT marketplaces and blockchain traders.
Asset Exchange (WAX)
WAX is king of virtual collectibles. WAX is popular for digitalized versions of legacy collectibles like trading cards, figurines, memorabilia, etc.
Wax uses a PoS mechanism, but also creates carbon offset NFTs and partners with Climate Care. Like Flow, WAX transaction fees are low, and network fees are redistributed to the WAX community as an incentive to collectors.
WAX marketplaces host Topps, NASCAR, Hot Wheels, and cult classic film franchises like Godzilla, The Princess Bride, and Spiderman.
Binance Smart Chain
BSC is another good option for balancing fees and performance. High-speed transactions and low fees hurt decentralization. BSC is most centralized.
Binance Smart Chain uses Proof of Staked Authority (PoSA) to support a short block time and low fees. The 21 validators needed to run the exchange switch every 24 hours. 11 of the 21 validators are directly connected to the Binance Crypto Exchange, according to reports.
While many in the crypto and NFT ecosystems dislike centralization, the BSC NFT market picked up speed in 2021. OpenBiSea, AirNFTs, JuggerWorld, and others are gaining popularity despite not having as robust an ecosystem as Ethereum.

Jayden Levitt
3 years ago
The country of El Salvador's Bitcoin-obsessed president lost $61.6 million.
It’s only a loss if you sell, right?
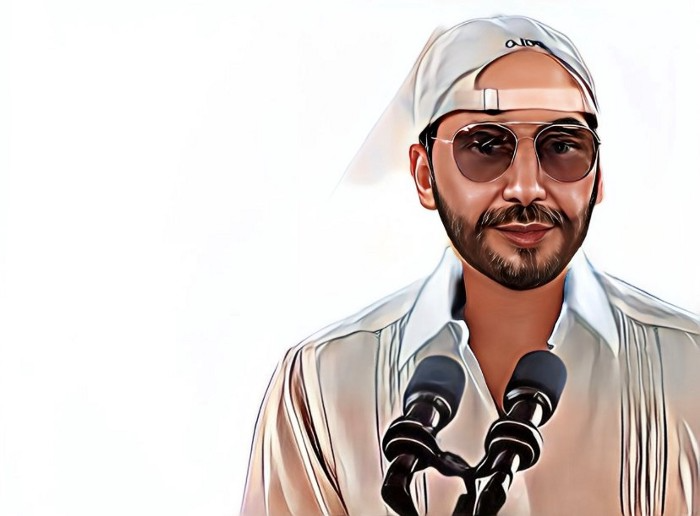
Nayib Bukele proclaimed himself “the world’s coolest dictator”.
His jokes aren't clear.
El Salvador's 43rd president self-proclaimed “CEO of El Salvador” couldn't be less presidential.
His thin jeans, aviator sunglasses, and baseball caps like a cartel lord.
He's popular, though.
Bukele won 53% of the vote by fighting violent crime and opposition party corruption.
El Salvador's 6.4 million inhabitants are riding the cryptocurrency volatility wave.
They were powerless.
Their autocratic leader, a former Yamaha Motors salesperson and Bitcoin believer, wants to help 70% unbanked locals.
He intended to give the citizens a way to save money and cut the country's $200 million remittance cost.
Transfer and deposit costs.
This makes logical sense when the president’s theatrics don’t blind you.
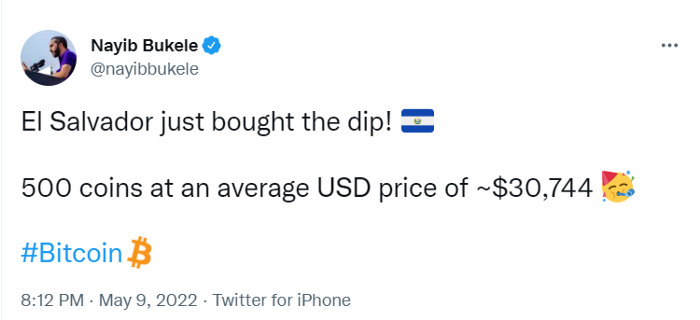
El Salvador's Bukele revealed plans to make bitcoin legal tender.
Remittances total $5.9 billion (23%) of the country's expenses.
Anything that reduces costs could boost the economy.
The country’s unbanked population is staggering. Here’s the data by % of people who either have a bank account (Blue) or a mobile money account (Black).
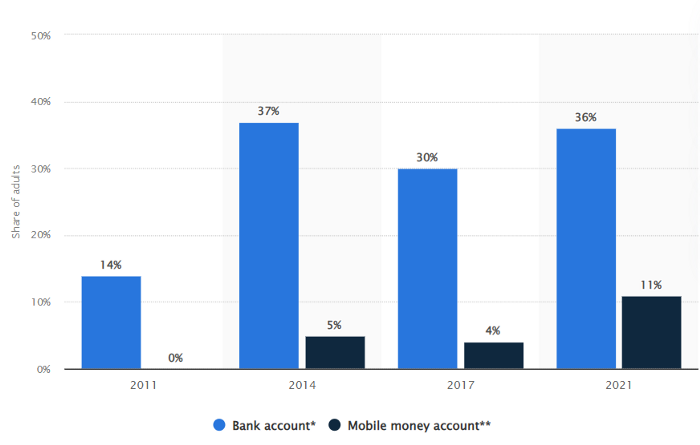
According to Bukele, 46% of the population has downloaded the Chivo Bitcoin Wallet.
In 2021, 36% of El Salvadorans had bank accounts.
Large rural countries like Kenya seem to have resolved their unbanked dilemma.
An economy surfaced where village locals would sell, trade and store network minutes and data as a store of value.
Kenyan phone networks realized unbanked people needed a safe way to accumulate wealth and have an emergency fund.
96% of Kenyans utilize M-PESA, which doesn't require a bank account.
The software involves human agents who hang out with cash and a phone.
These people are like ATMs.
You offer them cash to deposit money in your mobile money account or withdraw cash.
In a country with a faulty banking system, cash availability and a safe place to deposit it are important.
William Jack and Tavneet Suri found that M-PESA brought 194,000 Kenyan households out of poverty by making transactions cheaper and creating a safe store of value.
Mobile money, a service that allows monetary value to be stored on a mobile phone and sent to other users via text messages, has been adopted by most Kenyan households. We estimate that access to the Kenyan mobile money system M-PESA increased per capita consumption levels and lifted 194,000 households, or 2% of Kenyan households, out of poverty.
The impacts, which are more pronounced for female-headed households, appear to be driven by changes in financial behaviour — in particular, increased financial resilience and saving. Mobile money has therefore increased the efficiency of the allocation of consumption over time while allowing a more efficient allocation of labour, resulting in a meaningful reduction of poverty in Kenya.
Currently, El Salvador has 2,301 Bitcoin.
At publication, it's worth $44 million. That remains 41% of Bukele's original $105.6 million.
Unknown if the country has sold Bitcoin, but Bukeles keeps purchasing the dip.
It's still falling.
This might be a fantastic move for the impoverished country over the next five years, if they can live economically till Bitcoin's price recovers.
The evidence demonstrates that a store of value pulls individuals out of poverty, but others say Bitcoin is premature.
You may regard it as an aggressive endeavor to front run the next wave of adoption, offering El Salvador a financial upside.

Ann
3 years ago
These new DeFi protocols are just amazing.
I've never seen this before.
Focus on native crypto development, not price activity or turmoil.
CT is boring now. Either folks are still angry about FTX or they're distracted by AI. Plus, it's year-end, and people rest for the holidays. 2022 was rough.
So DeFi fans can get inspired by something fresh. Who's building? As I read the Defillama daily roundup, many updates are still on FTX and its contagion.
I've used the same method on their Raises page. Not much happened :(. Maybe my high standards are to fault, but the business may be resting. OK.
The handful I locate might last us till the end of the year. (If another big blowup occurs.)
Hashflow
An on-chain monitor account I follow reported a huge transfer of $HFT from Binance to Jump Tradings.
I was intrigued. Stacking? So I checked and discovered out the project was launched through Binance Launchpad, which has introduced many 100x tokens (although momentarily) in the past, such as GALA and STEPN.
Hashflow appears to be pumpable. Binance launchpad, VC backers, CEX listing immediately. What's the protocol?
Hasflow is intriguing and timely, I discovered. After the FTX collapse, people looked more at DEXs.
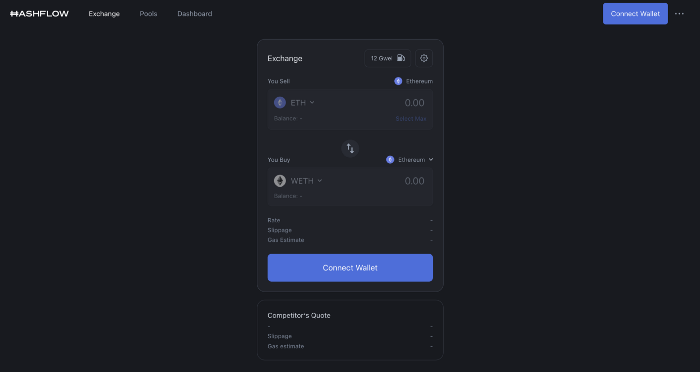
Hashflow is a decentralized exchange that connects traders with professional market makers, according to its Binance launchpad description. Post-FTX, market makers lost their MM-ing chance with the collapse of the world's third-largest exchange. Jump and Wintermute back them?
Why is that the case? Hashflow doesn't use bonding curves like standard AMM. On AMMs, you pay more for the following trade because the prior trade reduces liquidity (supply and demand). With market maker quotations, you get a CEX-like experience (fewer coins in the pool, higher price). Stable prices, no MEV frontrunning.
Hashflow is innovative because...
DEXs gained from the FTX crash, but let's be honest: DEXs aren't as good as CEXs. Hashflow will change this.
Hashflow offers MEV protection, which major dealers seek in DEXs. You can trade large amounts without front running and sandwich assaults.
Hasflow offers a user-friendly swapping platform besides MEV. Any chain can be traded smoothly. This is a benefit because DEXs lag CEXs in UX.
Status, timeline:
Wintermute wrote in August that prominent market makers will work on Hashflow. Binance launched a month-long farming session in December. Jump probably participated in this initial sell, therefore we witnessed a significant transfer after the introduction.
Binance began trading HFT token on November 11 (the day FTX imploded). coincidence?)
Tokens are used for community rewards. Perhaps they'd copy dYdX. (Airdrop?). Read their documents about their future plans. Tokenomics doesn't impress me. Governance, rewards, and NFT.
Their stat page details their activity. First came Ethereum, then Arbitrum. For a new protocol in a bear market, they handled a lot of unique users daily.
It’s interesting to see their future. Will they be thriving? Not only against DEXs, but also among the CEXs too.
STFX
I forget how I found STFX. Possibly a Twitter thread concerning Arbitrum applications. STFX was the only new protocol I found interesting.
STFX is a new concept and trader problem-solver. I've never seen this protocol.
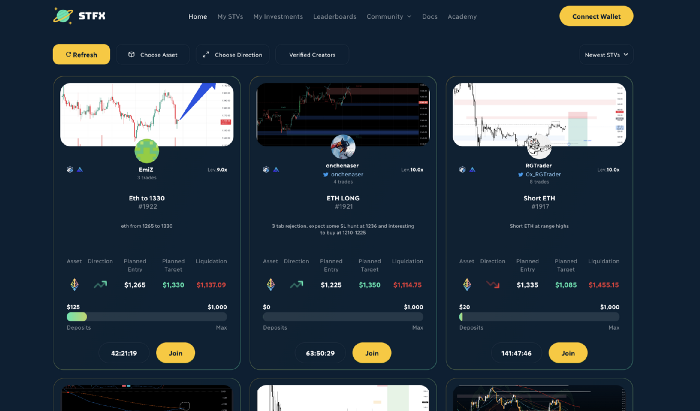
STFX allows you copy trades. You give someone your money to trade for you.
It's a marketplace. Traders are everywhere. You put your entry, exit, liquidation point, and trading theory. Twitter has a verification system for socials. Leaderboards display your trading skill.
This service could be popular. Staying disciplined is the hardest part of trading. Sometimes you take-profit too early or too late, or sell at a loss when an asset dumps, then it soon recovers (often happens in crypto.) It's hard to stick to entry-exit and liquidation plans.
What if you could hire someone to run your trade for a little commission? Set-and-forget.
Trading money isn't easy. Trust how? How do you know they won't steal your money?
Smart contracts.
STFX's trader is a vault maker/manager. One trade=one vault. User sets long/short, entrance, exit, and liquidation point. Anyone who agrees can exchange instantly. The smart contract will keep the fund during the trade and limit the manager's actions.
Here's STFX's transaction flow.
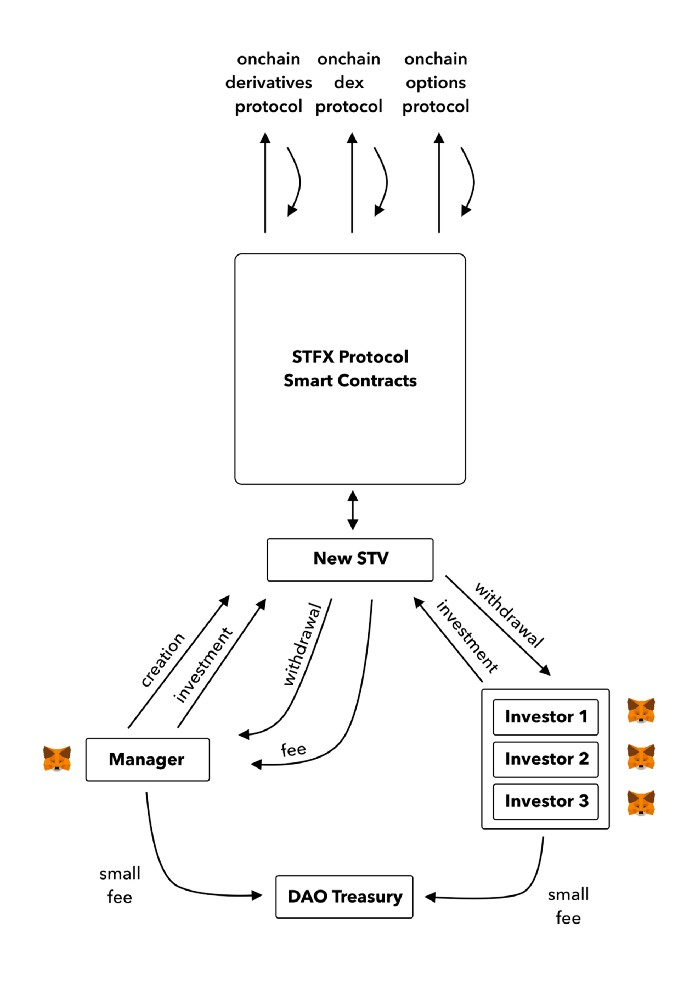
Managers and the treasury receive fees. It's a sustainable business strategy that benefits everyone.
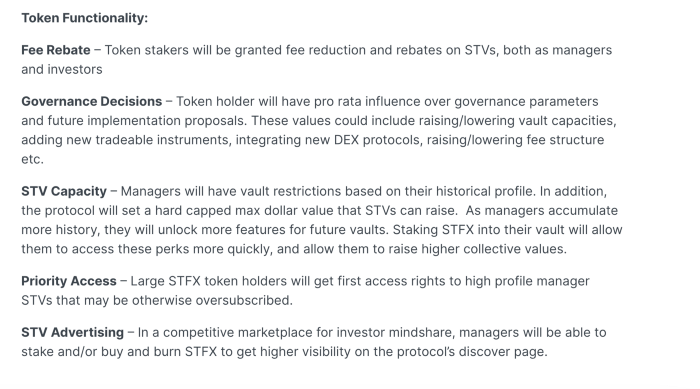
I'm impressed by $STFX's planned use. Brilliant priority access. A crypto dealer opens a vault here. Many would join. STFX tokens offer VIP access over those without tokens.
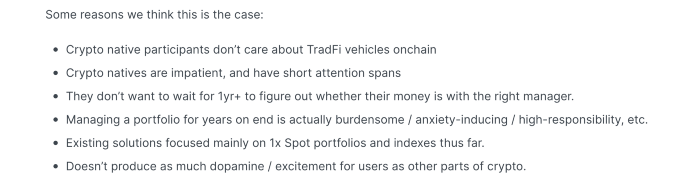
STFX provides short-term trading, which is mind-blowing to me. I agree with their platform's purpose. Crypto market pricing actions foster short-termism. When you trade, the turnover could be larger than long-term holding or trading. 2017 BTC buyers waited 5 years to complete their holdings.
STFX teams simply adapted. Volatility aids trading.
All things about STFX scream Degen. The protocol fully embraces the degen nature of some, if not most, crypto natives.
An enjoyable dApp. Leaderboards are fun for reputation-building. FLEXING COMPETITIONS. You can join for as low as $10. STFX uses Arbitrum, therefore gas costs are low. Alpha procedure completes the degen feeling.
Despite looking like they don't take themselves seriously, I sense a strong business plan below. There is a real demand for the solution STFX offers.
You might also like

Will Lockett
3 years ago
Thanks to a recent development, solar energy may prove to be the best energy source.

Perovskite solar cells will revolutionize everything.
Humanity is in a climatic Armageddon. Our widespread ecological crimes of the previous century are catching up with us, and planet-scale karma threatens everyone. We must adjust to new technologies and lifestyles to avoid this fate. Even solar power, a renewable energy source, has climate problems. A recent discovery could boost solar power's eco-friendliness and affordability. Perovskite solar cells are amazing.
Perovskite is a silicon-like semiconductor. Semiconductors are used to make computer chips, LEDs, camera sensors, and solar cells. Silicon makes sturdy and long-lasting solar cells, thus it's used in most modern solar panels.
Perovskite solar cells are far better. First, they're easy to make at room temperature, unlike silicon cells, which require long, intricate baking processes. This makes perovskite cells cheaper to make and reduces their carbon footprint. Perovskite cells are efficient. Most silicon panel solar farms are 18% efficient, meaning 18% of solar radiation energy is transformed into electricity. Perovskite cells are 25% efficient, making them 38% more efficient than silicon.
However, perovskite cells are nowhere near as durable. A normal silicon panel will lose efficiency after 20 years. The first perovskite cells were ineffective since they lasted barely minutes.
Recent research from Princeton shows that perovskite cells can endure 30 years. The cells kept their efficiency, therefore no sacrifices were made.
No electrical or chemical engineer here, thus I can't explain how they did it. But strangely, the team said longevity isn't the big deal. In the next years, perovskite panels will become longer-lasting. How do you test a panel if you only have a month or two? This breakthrough technique needs a uniform method to estimate perovskite life expectancy fast. The study's key milestone was establishing a standard procedure.
Lab-based advanced aging tests are their solution. Perovskite cells decay faster at higher temperatures, so scientists can extrapolate from that. The test heated the panel to 110 degrees and waited for its output to reduce by 20%. Their panel lasted 2,100 hours (87.5 days) before a 20% decline.
They did some math to extrapolate this data and figure out how long the panel would have lasted in different climates, and were shocked to find it would last 30 years in Princeton. This made perovskite panels as durable as silicon panels. This panel could theoretically be sold today.
This technology will soon allow these brilliant panels to be released into the wild. This technology could be commercially viable in ten, maybe five years.
Solar power will be the best once it does. Solar power is cheap and low-carbon. Perovskite is the cheapest renewable energy source if we switch to it. Solar panel manufacturing's carbon footprint will also drop.
Perovskites' impact goes beyond cost and carbon. Silicon panels require harmful mining and contain toxic elements (cadmium). Perovskite panels don't require intense mining or horrible materials, making their production and expiration more eco-friendly.
Solar power destroys habitat. Massive solar farms could reduce biodiversity and disrupt local ecology by destroying vital habitats. Perovskite cells are more efficient, so they can shrink a solar farm while maintaining energy output. This reduces land requirements, making perovskite solar power cheaper, and could reduce solar's environmental impact.
Perovskite solar power is scalable and environmentally friendly. Princeton scientists will speed up the development and rollout of this energy.
Why bother with fusion, fast reactors, SMRs, or traditional nuclear power? We're close to developing a nearly perfect environmentally friendly power source, and we have the tools and systems to do so quickly. It's also affordable, so we can adopt it quickly and let the developing world use it to grow. Even I struggle to justify spending billions on fusion when a great, cheap technology outperforms it. Perovskite's eco-credentials and cost advantages could save the world and power humanity's future.

Alex Mathers
3 years ago Draft
12 practices of the zenith individuals I know

Calmness is a vital life skill.
It aids communication. It boosts creativity and performance.
I've studied calm people's habits for years. Commonalities:
Have learned to laugh at themselves.
Those who have something to protect can’t help but make it a very serious business, which drains the energy out of the room.
They are fixated on positive pursuits like making cool things, building a strong physique, and having fun with others rather than on depressing influences like the news and gossip.
Every day, spend at least 20 minutes moving, whether it's walking, yoga, or lifting weights.
Discover ways to take pleasure in life's challenges.
Since perspective is malleable, they change their view.
Set your own needs first.
Stressed people neglect themselves and wonder why they struggle.
Prioritize self-care.
Don't ruin your life to please others.
Make something.
Calm people create more than react.
They love creating beautiful things—paintings, children, relationships, and projects.
Hold your breath, please.
If you're stressed or angry, you may be surprised how much time you spend holding your breath and tightening your belly.
Release, breathe, and relax to find calm.
Stopped rushing.
Rushing is disadvantageous.
Calm people handle life better.
Are attuned to their personal dietary needs.
They avoid junk food and eat foods that keep them healthy, happy, and calm.
Don’t take anything personally.
Stressed people control everything.
Self-conscious.
Calm people put others and their work first.
Keep their surroundings neat.
Maintaining an uplifting and clutter-free environment daily calms the mind.
Minimise negative people.
Calm people are ruthless with their boundaries and avoid negative and drama-prone people.

Jerry Keszka
3 years ago
10 Crazy Useful Free Websites No One Told You About But You Needed
The internet is a massive information resource. With so much stuff, it's easy to forget about useful websites. Here are five essential websites you may not have known about.

1. Companies.tools
Companies.tools are what successful startups employ. This website offers a curated selection of design, research, coding, support, and feedback resources. Ct has the latest app development platform and greatest client feedback method.
2. Excel Formula Bot
Excel Formula Bot can help if you forget a formula. Formula Bot uses AI to convert text instructions into Excel formulas, so you don't have to remember them.
Just tell the Bot what to do, and it will do it. Excel Formula Bot can calculate sales tax and vacation days. When you're stuck, let the Bot help.
3.TypeLit
TypeLit helps you improve your typing abilities while reading great literature.
TypeLit.io lets you type any book or dozens of preset classics. TypeLit provides real-time feedback on accuracy and speed.
Goals and progress can be tracked. Why not improve your typing and learn great literature with TypeLit?
4. Calm Schedule
Finding a meeting time that works for everyone is difficult. Personal and business calendars might be difficult to coordinate.
Synchronize your two calendars to save time and avoid problems. You may avoid searching through many calendars for conflicts and keep your personal information secret. Having one source of truth for personal and work occasions will help you never miss another appointment.
https://calmcalendar.com/
5. myNoise
myNoise makes the outside world quieter. myNoise is the right noise for a noisy office or busy street.
If you can't locate the right noise, make it. MyNoise unlocks the world. Shut out distractions. Thank your ears.
6. Synthesia
Professional videos require directors, filmmakers, editors, and animators. Now, thanks to AI, you can generate high-quality videos without video editing experience.
AI avatars are crucial. You can design a personalized avatar using a web-based software like synthesia.io. Our avatars can lip-sync in over 60 languages, so you can make worldwide videos. There's an AI avatar for every video goal.
Not free. Amazing service, though.
7. Cleaning-up-images
Have you shot a wonderful photo just to notice something in the background? You may have a beautiful headshot but wish to erase an imperfection.
Cleanup.pictures removes undesirable objects from photos. Our algorithms will eliminate the selected object.
Cleanup.pictures can help you obtain the ideal shot every time. Next time you take images, let Cleanup.pictures fix any flaws.
8. PDF24 Tools
Editing a PDF can be a pain. Most of us don't know Adobe Acrobat's functionalities. Why buy something you'll rarely use? Better options exist.
PDF24 is an online PDF editor that's free and subscription-free. Rotate, merge, split, compress, and convert PDFs in your browser. PDF24 makes document signing easy.
Upload your document, sign it (or generate a digital signature), and download it. It's easy and free. PDF24 is a free alternative to pricey PDF editing software.
9. Class Central
Finding online classes is much easier. Class Central has classes from Harvard, Stanford, Coursera, Udemy, and Google, Amazon, etc. in one spot.
Whether you want to acquire a new skill or increase your knowledge, you'll find something. New courses bring variety.
10. Rome2rio
Foreign travel offers countless transport alternatives. How do you get from A to B? It’s easy!
Rome2rio will show you the best method to get there, including which mode of transport is ideal.
Plane
Car
Train
Bus
Ferry
Driving
Shared bikes
Walking
Do you know any free, useful websites?