


More on Entrepreneurship/Creators

Ben Chino
3 years ago
100-day SaaS buildout.
We're opening up Maki through a series of Medium posts. We'll describe what Maki is building and how. We'll explain how we built a SaaS in 100 days. This isn't a step-by-step guide to starting a business, but a product philosophy to help you build quickly.

Focus on end-users.
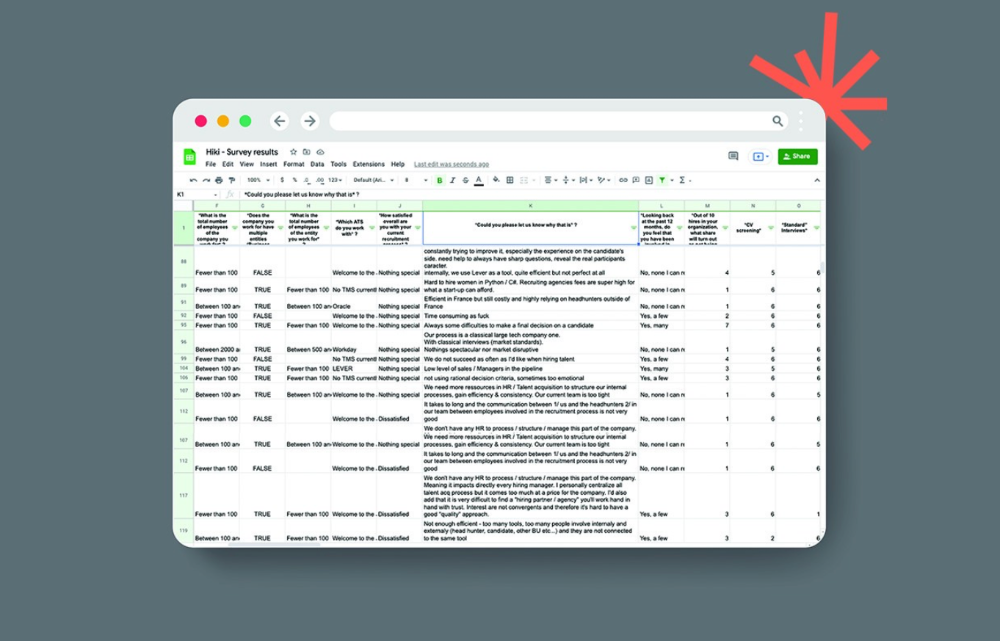
This may seem obvious, but it's important to talk to users first. When we started thinking about Maki, we interviewed 100 HR directors from SMBs, Next40 scale-ups, and major Enterprises to understand their concerns. We initially thought about the future of employment, but most of their worries centered on Recruitment. We don't have a clear recruiting process, it's time-consuming, we recruit clones, we don't support diversity, etc. And as hiring managers, we couldn't help but agree.
Co-create your product with your end-users.
We went to the drawing board, read as many books as possible (here, here, and here), and when we started getting a sense for a solution, we questioned 100 more operational HR specialists to corroborate the idea and get a feel for our potential answer. This confirmed our direction to help hire more objectively and efficiently.
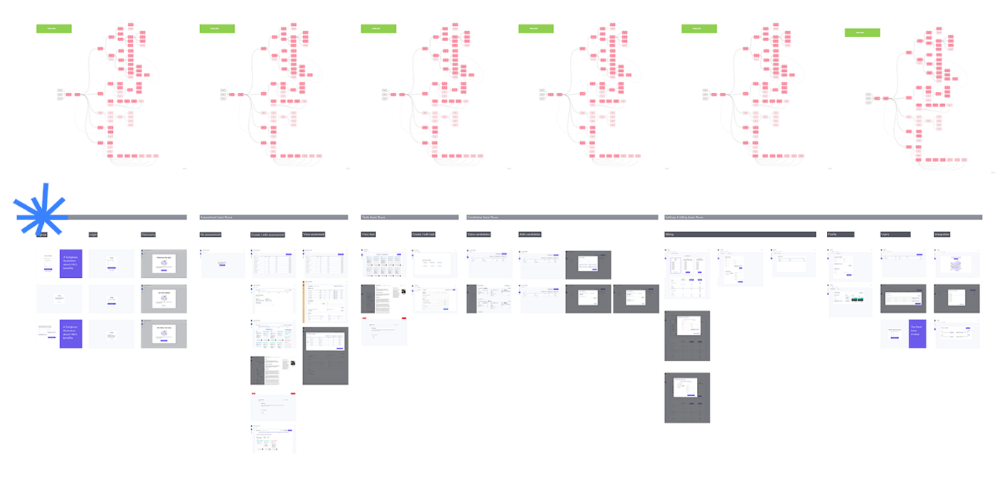
Back to the drawing board, we designed our first flows and screens. We organized sessions with certain survey respondents to show them our early work and get comments. We got great input that helped us build Maki, and we met some consumers. Obsess about users and execute alongside them.
Don’t shoot for the moon, yet. Make pragmatic choices first.
Once we were convinced, we began building. To launch a SaaS in 100 days, we needed an operating principle that allowed us to accelerate while still providing a reliable, secure, scalable experience. We focused on adding value and outsourced everything else. Example:
Concentrate on adding value. Reuse existing bricks.
When determining which technology to use, we looked at our strengths and the future to see what would last. Node.js for backend, React for frontend, both with typescript. We thought this technique would scale well since it would attract more talent and the surrounding mature ecosystem would help us go quicker.

We explored for ways to bootstrap services while setting down strong foundations that might support millions of users. We built our backend services on NestJS so we could extend into microservices later. Hasura, a GraphQL APIs engine, automates Postgres data exposing through a graphQL layer. MUI's ready-to-use components powered our design-system. We used well-maintained open-source projects to speed up certain tasks.
We outsourced important components of our platform (Auth0 for authentication, Stripe for billing, SendGrid for notifications) because, let's face it, we couldn't do better. We choose to host our complete infrastructure (SQL, Cloud run, Logs, Monitoring) on GCP to simplify our work between numerous providers.
Focus on your business, use existing bricks for the rest. For the curious, we'll shortly publish articles detailing each stage.
Most importantly, empower people and step back.
We couldn't have done this without the incredible people who have supported us from the start. Since Powership is one of our key values, we provided our staff the power to make autonomous decisions from day one. Because we believe our firm is its people, we hired smart builders and let them build.

Nicolas left Spendesk to create scalable interfaces using react-router, react-queries, and MUI. JD joined Swile and chose Hasura as our GraphQL engine. Jérôme chose NestJS to build our backend services. Since then, Justin, Ben, Anas, Yann, Benoit, and others have followed suit.
If you consider your team a collective brain, you should let them make decisions instead of directing them what to do. You'll make mistakes, but you'll go faster and learn faster overall.
Invest in great talent and develop a strong culture from the start. Here's how to establish a SaaS in 100 days.

Woo
3 years ago
How To Launch A Business Without Any Risk
> Say Hello To The Lean-Hedge Model
People think starting a business requires significant debt and investment. Like Shark Tank, you need a world-changing idea. I'm not saying to avoid investors or brilliant ideas.
Investing is essential to build a genuinely profitable company. Think Apple or Starbucks.
Entrepreneurship is risky because many people go bankrupt from debt. As starters, we shouldn't do it. Instead, use lean-hedge.
Simply defined, you construct a cash-flow business to hedge against long-term investment-heavy business expenses.
What the “fx!$rench-toast” is the lean-hedge model?
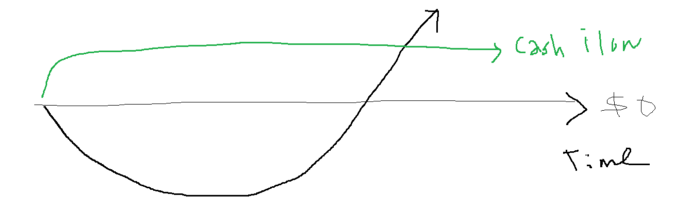
When you start a business, your money should move down, down, down, then up when it becomes profitable.
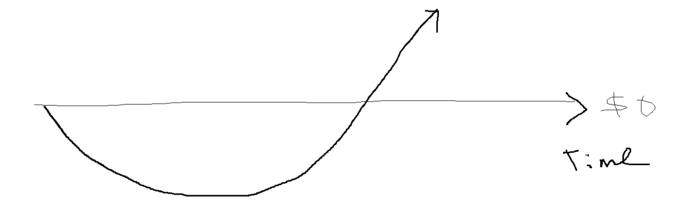
Many people don't survive the business's initial losses and debt. What if, we created a cash-flow business BEFORE we started our Starbucks to hedge against its initial expenses?
Lean-hedge has two sections. Start a cash-flow business. A cash-flow business takes minimal investment and usually involves sweat and time.
Let’s take a look at some examples:
A Translation company
Personal portfolio website (you make a site then you do cold e-mail marketing)
FREELANCE (UpWork, Fiverr).
Educational business.
Infomarketing. (You design a knowledge-based product. You sell the info).
Online fitness/diet/health coaching ($50-$300/month, calls, training plan)
Amazon e-book publishing. (Medium writers do this)
YouTube, cash-flow channel
A web development agency (I'm a dev, but if you're not, a graphic design agency, etc.) (Sell your time.)
Digital Marketing
Online paralegal (A million lawyers work in the U.S).
Some dropshipping (Organic Tik Tok dropshipping, where you create content to drive traffic to your shopify store instead of spend money on ads).
(Disclaimer: My first two cash-flow enterprises, which were language teaching, failed terribly. My translation firm is now booming because B2B e-mail marketing is easy.)
Crossover occurs. Your long-term business starts earning more money than your cash flow business.
My cash-flow business (freelancing, translation) makes $7k+/month.
I’ve decided to start a slightly more investment-heavy digital marketing agency
Here are the anticipated business's time- and money-intensive investments:
($$$) Top Front-End designer's Figma/UI-UX design (in negotiation)
(Time): A little copywriting (I will do this myself)
($$) Creating an animated webpage with HTML (in negotiation)
Backend Development (Duration) (I'll carry out this myself using Laravel.)
Logo Design ($$)
Logo Intro Video for $
Video Intro (I’ll edit this myself with Premiere Pro)
etc.
Then evaluate product, place, price, and promotion. Consider promotion and pricing.
The lean-hedge model's point is:
Don't gamble. Avoid debt. First create a cash-flow project, then grow it steadily.
Check read my previous posts on “Nightmare Mode” (which teaches you how to make work as interesting as video games) and Why most people can't escape a 9-5 to learn how to develop a cash-flow business.

Mircea Iosif
3 years ago
How To Start An Online Business That Will Be Profitable Without Investing A Lot Of Time

Don't know how to start an online business? Here's a guide. By following these recommendations, you can build a lucrative and profitable online business.
What Are Online Businesses Used For?
Most online businesses are websites. A self-created, self-managed website. You may sell things and services online.
To establish an internet business, you must locate a host and set up accounts with numerous companies. Once your accounts are set up, you may start publishing content and selling products or services.
How to Make Money from Your Online Business
Advertising and marketing are the best ways to make money online. You must develop strategies to contact new customers and generate leads. Make sure your website is search engine optimized so people can find you online.
Top 5 Online Business Tips for Startups:
1. Know your target audience's needs.
2. Make your website as appealing as possible.
3. Generate leads and sales with marketing.
4. Track your progress and learn from your mistakes to improve.
5. Be prepared to expand into new markets or regions.
How to Launch a Successful Online Business Without Putting in a Lot of Work
Build with a solid business model to start a profitable online business. By using these tips, you can start your online business without paying much.
First, develop a user-friendly website. You can use an internet marketing platform or create your own website. Once your website is live, optimize it for search engines and add relevant content.
Second, sell online. This can be done through ads or direct sales to website visitors. Finally, use social media to advertise your internet business. By accomplishing these things, you'll draw visitors to your website and make money.
When launching a business, invest long-term. This involves knowing your goals and how you'll pay for them. Volatility can have several effects on your business. If you offer things online, you may need to examine if the market is ready for them.
Invest wisely
Investing all your money in one endeavor can lead to too much risk and little ROI. Diversify your investments to take advantage of all available chances. So, your investments won't encounter unexpected price swings and you'll be immune to economic upheavals.
Financial news updates
When launching or running a thriving online business, financial news is crucial. By knowing current trends and upcoming developments, you can keep your business lucrative.
Keeping up with financial news can also help you avoid potential traps that could harm your bottom line. If you don't know about new legislation that could affect your industry, potential customers may choose another store when they learn about your business's problems.
Volatility ahead
You should expect volatility in the financial sector. Without a plan for coping with volatility, you could run into difficulty. If your organization relies on client input, you may not be able to exploit customer behavior shifts.
Your company could go bankrupt if you don't understand how fickle the stock market can be. By preparing for volatility, you can ensure your organization survives difficult times and market crashes.
Conclusion
Many internet businesses can be profitable. Start quickly with a few straightforward steps. Diversify your investments, follow financial news, and be prepared for volatility to develop a successful business.
Thanks for reading!
You might also like

Sofien Kaabar, CFA
3 years ago
Innovative Trading Methods: The Catapult Indicator
Python Volatility-Based Catapult Indicator

As a catapult, this technical indicator uses three systems: Volatility (the fulcrum), Momentum (the propeller), and a Directional Filter (Acting as the support). The goal is to get a signal that predicts volatility acceleration and direction based on historical patterns. We want to know when the market will move. and where. This indicator outperforms standard indicators.
Knowledge must be accessible to everyone. This is why my new publications Contrarian Trading Strategies in Python and Trend Following Strategies in Python now include free PDF copies of my first three books (Therefore, purchasing one of the new books gets you 4 books in total). GitHub-hosted advanced indications and techniques are in the two new books above.
The Foundation: Volatility
The Catapult predicts significant changes with the 21-period Relative Volatility Index.
The Average True Range, Mean Absolute Deviation, and Standard Deviation all assess volatility. Standard Deviation will construct the Relative Volatility Index.
Standard Deviation is the most basic volatility. It underpins descriptive statistics and technical indicators like Bollinger Bands. Before calculating Standard Deviation, let's define Variance.
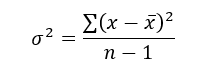
Variance is the squared deviations from the mean (a dispersion measure). We take the square deviations to compel the distance from the mean to be non-negative, then we take the square root to make the measure have the same units as the mean, comparing apples to apples (mean to standard deviation standard deviation). Variance formula:
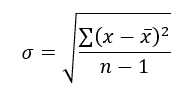
As stated, standard deviation is:
# The function to add a number of columns inside an array
def adder(Data, times):

    for i in range(1, times + 1):

        new_col = np.zeros((len(Data), 1), dtype = float)
        Data = np.append(Data, new_col, axis = 1)

    return Data

# The function to delete a number of columns starting from an index
def deleter(Data, index, times):

    for i in range(1, times + 1):

        Data = np.delete(Data, index, axis = 1)

    return Data

# The function to delete a number of rows from the beginning
def jump(Data, jump):

    Data = Data[jump:, ]

    return Data

# Example of adding 3 empty columns to an array
my_ohlc_array = adder(my_ohlc_array, 3)

# Example of deleting the 2 columns after the column indexed at 3
my_ohlc_array = deleter(my_ohlc_array, 3, 2)

# Example of deleting the first 20 rows
my_ohlc_array = jump(my_ohlc_array, 20)

# Remember, OHLC is an abbreviation of Open, High, Low, and Close and it refers to the standard historical data file

def volatility(Data, lookback, what, where):

  for i in range(len(Data)):

     try:

        Data[i, where] = (Data[i - lookback + 1:i + 1, what].std())
     except IndexError:
        pass

  return Data
The RSI is the most popular momentum indicator, and for good reason—it excels in range markets. Its 0–100 range simplifies interpretation. Fame boosts its potential.
The more traders and portfolio managers look at the RSI, the more people will react to its signals, pushing market prices. Technical Analysis is self-fulfilling, therefore this theory is obvious yet unproven.
RSI is determined simply. Start with one-period pricing discrepancies. We must remove each closing price from the previous one. We then divide the smoothed average of positive differences by the smoothed average of negative differences. The RSI algorithm converts the Relative Strength from the last calculation into a value between 0 and 100.
def ma(Data, lookback, close, where):

    Data = adder(Data, 1)

    for i in range(len(Data)):

            try:
                Data[i, where] = (Data[i - lookback + 1:i + 1, close].mean())

            except IndexError:
                pass

    # Cleaning
    Data = jump(Data, lookback)

    return Data
def ema(Data, alpha, lookback, what, where):

    alpha = alpha / (lookback + 1.0)
    beta  = 1 - alpha

    # First value is a simple SMA
    Data = ma(Data, lookback, what, where)

    # Calculating first EMA
    Data[lookback + 1, where] = (Data[lookback + 1, what] * alpha) + (Data[lookback, where] * beta)

    # Calculating the rest of EMA
    for i in range(lookback + 2, len(Data)):
            try:
                Data[i, where] = (Data[i, what] * alpha) + (Data[i - 1, where] * beta)

            except IndexError:
                pass

    return Datadef rsi(Data, lookback, close, where, width = 1, genre = 'Smoothed'):

    # Adding a few columns
    Data = adder(Data, 7)

    # Calculating Differences
    for i in range(len(Data)):

        Data[i, where] = Data[i, close] - Data[i - width, close]

    # Calculating the Up and Down absolute values
    for i in range(len(Data)):

        if Data[i, where] > 0:

            Data[i, where + 1] = Data[i, where]

        elif Data[i, where] < 0:

            Data[i, where + 2] = abs(Data[i, where])

    # Calculating the Smoothed Moving Average on Up and Down
    absolute values

    lookback = (lookback * 2) - 1 # From exponential to smoothed
    Data = ema(Data, 2, lookback, where + 1, where + 3)
    Data = ema(Data, 2, lookback, where + 2, where + 4)

    # Calculating the Relative Strength
    Data[:, where + 5] = Data[:, where + 3] / Data[:, where + 4]

    # Calculate the Relative Strength Index
    Data[:, where + 6] = (100 - (100 / (1 + Data[:, where + 5])))

    # Cleaning
    Data = deleter(Data, where, 6)
    Data = jump(Data, lookback)

    return Data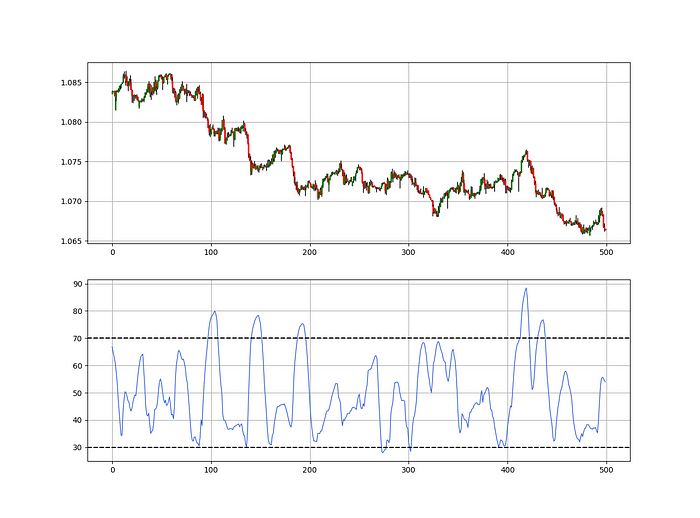
def relative_volatility_index(Data, lookback, close, where):

    # Calculating Volatility
    Data = volatility(Data, lookback, close, where)

    # Calculating the RSI on Volatility
    Data = rsi(Data, lookback, where, where + 1)

    # Cleaning
    Data = deleter(Data, where, 1)

    return Data
The Arm Section: Speed
The Catapult predicts momentum direction using the 14-period Relative Strength Index.
As a reminder, the RSI ranges from 0 to 100. Two levels give contrarian signals:
A positive response is anticipated when the market is deemed to have gone too far down at the oversold level 30, which is 30.
When the market is deemed to have gone up too much, at overbought level 70, a bearish reaction is to be expected.
Comparing the RSI to 50 is another intriguing use. RSI above 50 indicates bullish momentum, while below 50 indicates negative momentum.
The direction-finding filter in the frame
The Catapult's directional filter uses the 200-period simple moving average to keep us trending. This keeps us sane and increases our odds.
Moving averages confirm and ride trends. Its simplicity and track record of delivering value to analysis make them the most popular technical indicator. They help us locate support and resistance, stops and targets, and the trend. Its versatility makes them essential trading tools.
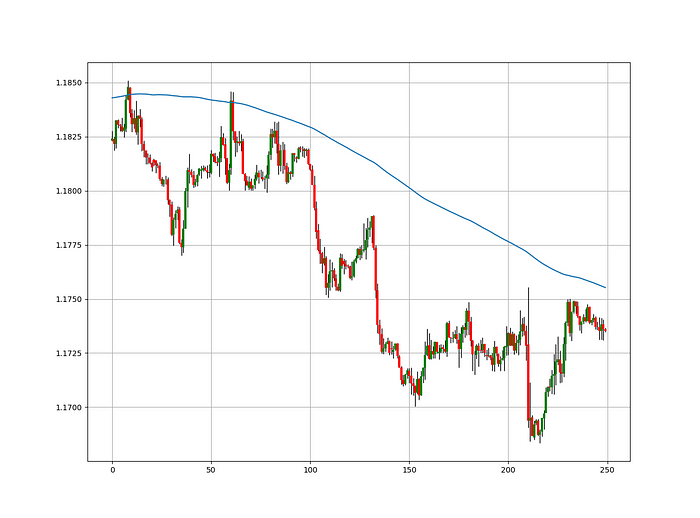
This is the plain mean, employed in statistics and everywhere else in life. Simply divide the number of observations by their total values. Mathematically, it's:
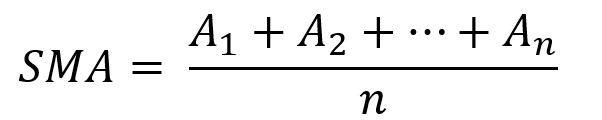
We defined the moving average function above. Create the Catapult indication now.
Indicator of the Catapult
The indicator is a healthy mix of the three indicators:
The first trigger will be provided by the 21-period Relative Volatility Index, which indicates that there will now be above average volatility and, as a result, it is possible for a directional shift.
If the reading is above 50, the move is likely bullish, and if it is below 50, the move is likely bearish, according to the 14-period Relative Strength Index, which indicates the likelihood of the direction of the move.
The likelihood of the move's direction will be strengthened by the 200-period simple moving average. When the market is above the 200-period moving average, we can infer that bullish pressure is there and that the upward trend will likely continue. Similar to this, if the market falls below the 200-period moving average, we recognize that there is negative pressure and that the downside is quite likely to continue.
lookback_rvi = 21
lookback_rsi = 14
lookback_ma = 200
my_data = ma(my_data, lookback_ma, 3, 4)
my_data = rsi(my_data, lookback_rsi, 3, 5)
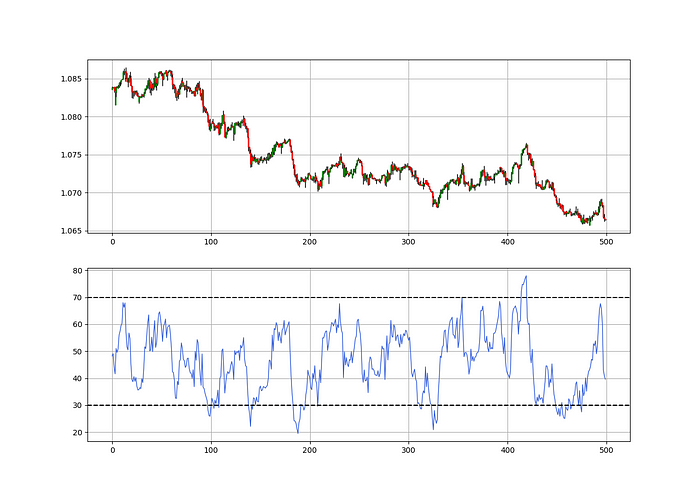
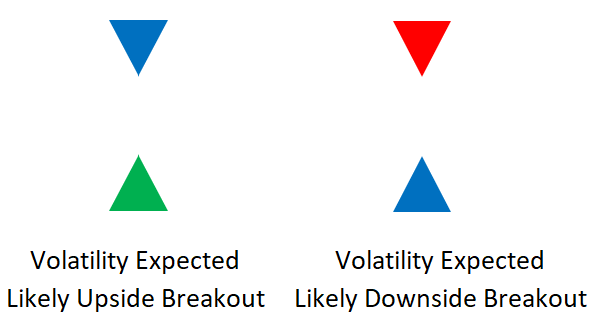
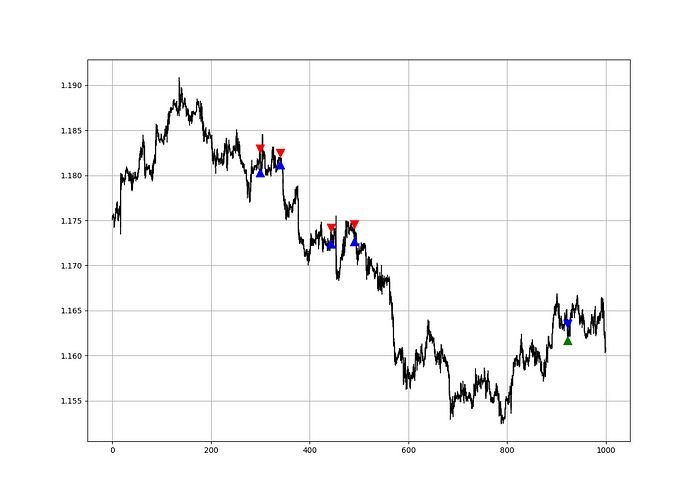
my_data = relative_volatility_index(my_data, lookback_rvi, 3, 6)Two-handled overlay indicator Catapult. The first exhibits blue and green arrows for a buy signal, and the second shows blue and red for a sell signal.
The chart below shows recent EURUSD hourly values.
def signal(Data, rvi_col, signal):

    Data = adder(Data, 10)

    for i in range(len(Data)):

        if Data[i,     rvi_col] < 30 and \
           Data[i - 1, rvi_col] > 30 and \
           Data[i - 2, rvi_col] > 30 and \
           Data[i - 3, rvi_col] > 30 and \
           Data[i - 4, rvi_col] > 30 and \
           Data[i - 5, rvi_col] > 30:

               Data[i, signal] = 1

    return Data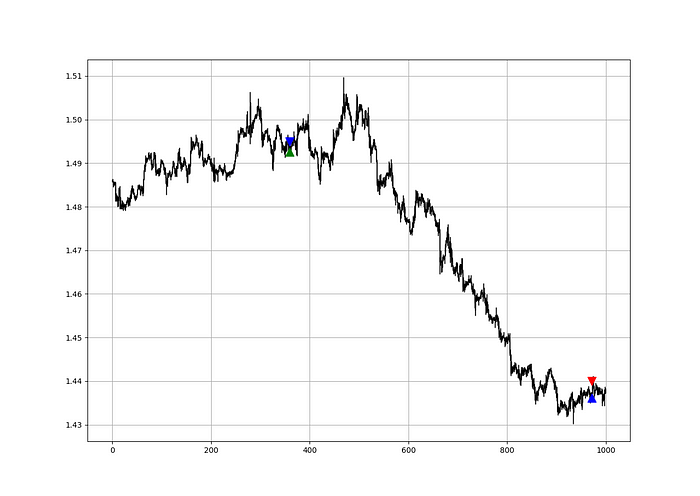
Signals are straightforward. The indicator can be utilized with other methods.
my_data = signal(my_data, 6, 7)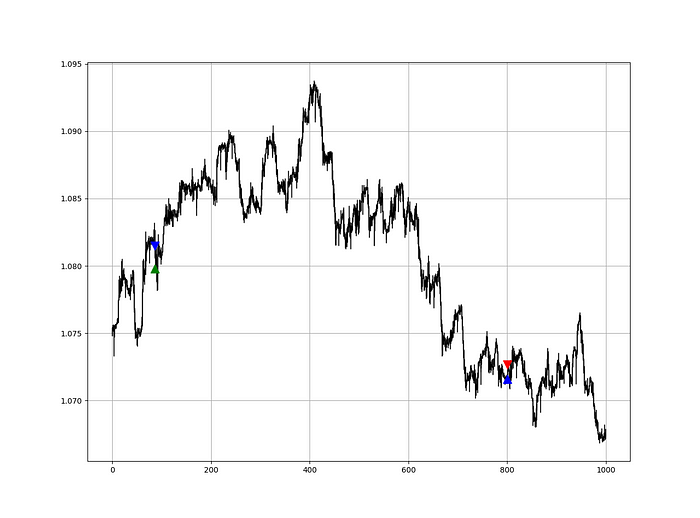
Lumiwealth shows how to develop all kinds of algorithms. I recommend their hands-on courses in algorithmic trading, blockchain, and machine learning.
Summary
To conclude, my goal is to contribute to objective technical analysis, which promotes more transparent methods and strategies that must be back-tested before implementation. Technical analysis will lose its reputation as subjective and unscientific.
After you find a trading method or approach, follow these steps:
Put emotions aside and adopt an analytical perspective.
Test it in the past in conditions and simulations taken from real life.
Try improving it and performing a forward test if you notice any possibility.
Transaction charges and any slippage simulation should always be included in your tests.
Risk management and position sizing should always be included in your tests.
After checking the aforementioned, monitor the plan because market dynamics may change and render it unprofitable.

CyberPunkMetalHead
3 years ago
Why Bitcoin NFTs Are Incomprehensible yet Likely Here to Stay

I'm trying to understand why Bitcoin NFTs aren't ready.
Ordinals, a new Bitcoin protocol, has been controversial. NFTs can be added to Bitcoin transactions using the protocol. They are not tokens or fungible. Bitcoin NFTs are transaction metadata. Yes. They're not owned.
In January, the Ordinals protocol allowed data like photos to be directly encoded onto sats, the smallest units of Bitcoin worth 0.00000001 BTC, on the Bitcoin blockchain. Ordinals does not need a sidechain or token like other techniques. The Ordinals protocol has encoded JPEG photos, digital art, new profile picture (PFP) projects, and even 1993 DOOM onto the Bitcoin network.
Ordinals inscriptions are permanent digital artifacts preserved on the Bitcoin blockchain. It differs from Ethereum, Solana, and Stacks NFT technologies that allow smart contract creators to change information. Ordinals store the whole image or content on the blockchain, not just a link to an external server, unlike centralized databases, which can change the linked image, description, category, or contract identifier.
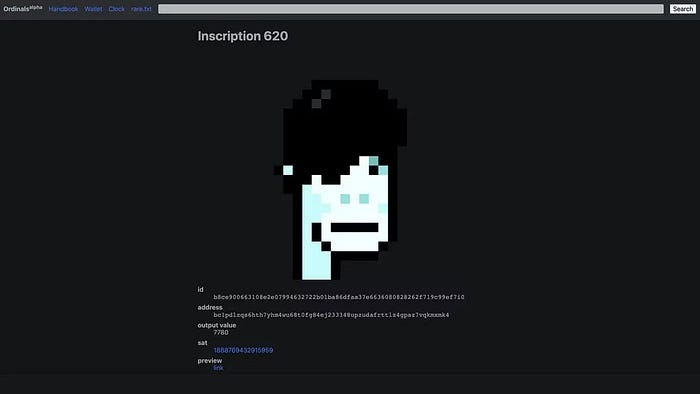
So far, more than 50,000 ordinals have been produced on the Bitcoin blockchain, and some of them have already been sold for astronomical amounts. The Ethereum-based CryptoPunks NFT collection spawned Ordinal Punk. Inscription 620 sold for 9.5 BTC, or $218,000, the most.
Segwit and Taproot, two important Bitcoin blockchain updates, enabled this. These protocols store transaction metadata, unlike Ethereum, where the NFT is the token. Bitcoin's NFT is a sat's transaction details.
What effects do ordinary values and NFTs have on the Bitcoin blockchain?
Ordinals will likely have long-term effects on the Bitcoin Ecosystem since they store, transact, and compute more data.
Charges Ordinals introduce scalability challenges. The Bitcoin network has limited transaction throughput and increased fees during peak demand. NFTs could make network transactions harder and more expensive. Ordinals currently occupy over 50% of block space, according to Glassnode.
One of the protocols that supported Ordinals Taproot has also seen a huge uptick:
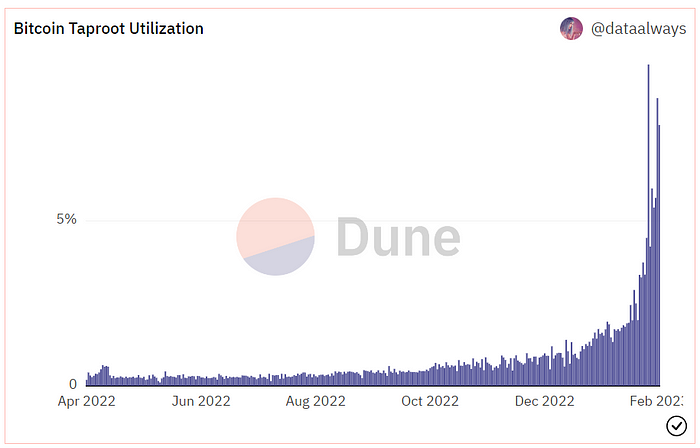
Taproot use increases block size and transaction costs.
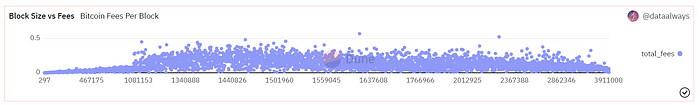
This could cause network congestion but also support more L2s with Ordinals-specific use cases. Dune info here.
Storage Needs The Bitcoin blockchain would need to store more data to store NFT data directly. Since ordinals were introduced, blocksize has tripled from 0.7mb to over 2.2mb, which could increase storage costs and make it harder for nodes to join the network.
Use Case Diversity On the other hand, NFTs on the Bitcoin blockchain could broaden Bitcoin's use cases beyond storage and payment. This could expand Bitcoin's user base. This is two-sided. Bitcoin was designed to be trustless, decentralized, peer-to-peer money.
Chain to permanently store NFTs as ordinals will change everything.
Popularity rise This new use case will boost Bitcoin appeal, according to some. This argument fails since Bitcoin is the most popular cryptocurrency. Popularity doesn't require a new use case. Cryptocurrency adoption boosts Bitcoin. It need not compete with Ethereum or provide extra benefits to crypto investors. If there was a need for another chain that supports NFTs (there isn't), why would anyone choose the slowest and most expensive network? It appears contradictory and unproductive.
Nonetheless, holding an NFT on the Bitcoin blockchain is more secure than any other blockchain, but this has little utility.
Bitcoin NFTs are undoubtedly controversial. NFTs are strange and perhaps harmful to Bitcoin's mission. If Bitcoin NFTs are here to stay, I hope a sidechain or rollup solution will take over and leave the base chain alone.

Tim Smedley
3 years ago
When Investment in New Energy Surpassed That in Fossil Fuels (Forever)
A worldwide energy crisis might have hampered renewable energy and clean tech investment. Nope.
BNEF's 2023 Energy Transition Investment Trends study surprised and encouraged. Global energy transition investment reached $1 trillion for the first time ($1.11t), up 31% from 2021. From 2013, the clean energy transition has come and cannot be reversed.
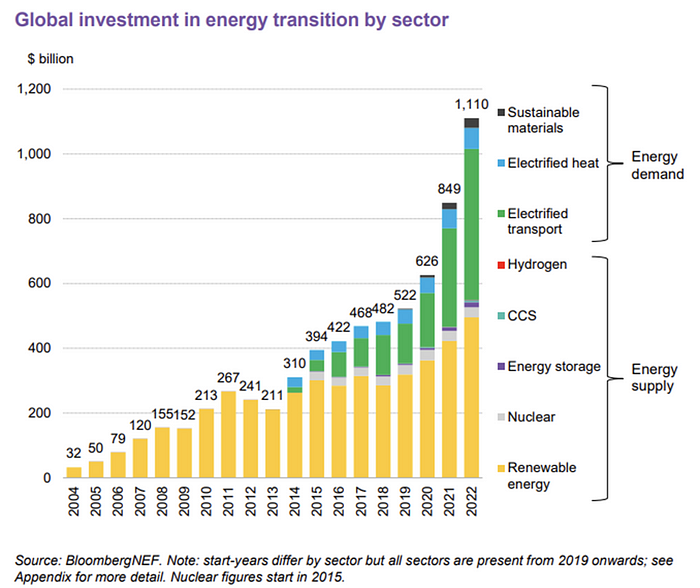
BNEF Head of Global Analysis Albert Cheung said our findings ended the energy crisis's influence on renewable energy deployment. Energy transition investment has reached a record as countries and corporations implement transition strategies. Clean energy investments will soon surpass fossil fuel investments.
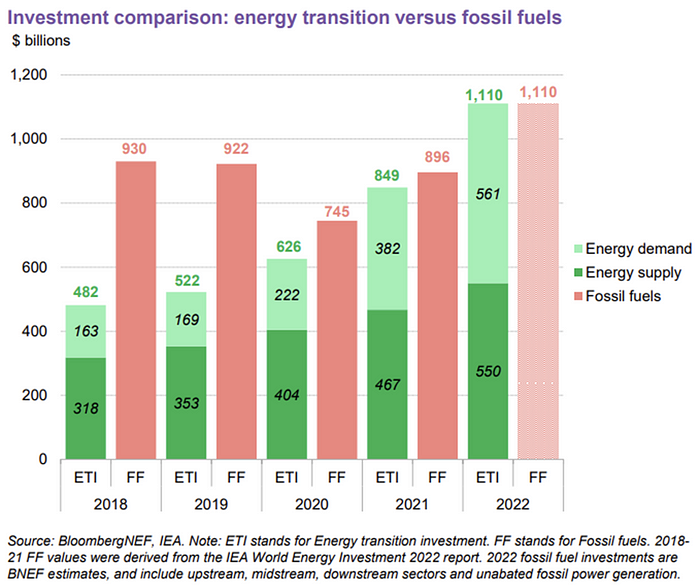
The table below indicates the tripping point, which means the energy shift is occuring today.
BNEF calls money invested on clean technology including electric vehicles, heat pumps, hydrogen, and carbon capture energy transition investment. In 2022, electrified heat received $64b and energy storage $15.7b.
Nonetheless, $495b in renewables (up 17%) and $466b in electrified transport (up 54%) account for most of the investment. Hydrogen and carbon capture are tiny despite the fanfare. Hydrogen received the least funding in 2022 at $1.1 billion (0.1%).
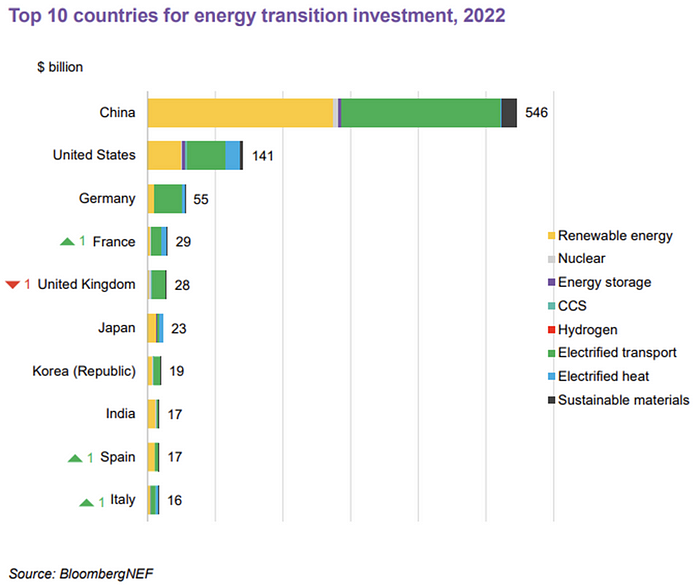
China dominates investment. China spends $546 billion on energy transition, half the global amount. Second, the US total of $141 billion in 2022 was up 11% from 2021. With $180 billion, the EU is unofficially second. China invested 91% in battery technologies.
The 2022 transition tipping point is encouraging, but the BNEF research shows how far we must go to get Net Zero. Energy transition investment must average $4.55 trillion between 2023 and 2030—three times the amount spent in 2022—to reach global Net Zero. Investment must be seven times today's record to reach Net Zero by 2050.
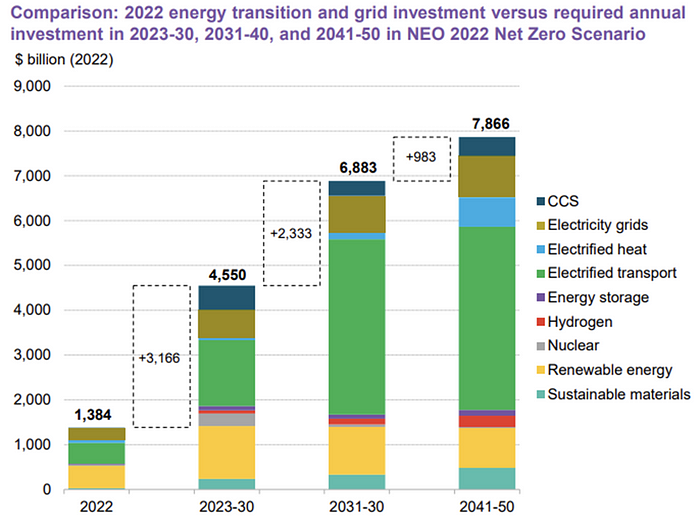
BNEF 2023 Energy Transition Investment Trends.
As shown in the graph above, BNEF experts have been using their crystal balls to determine where that investment should go. CCS and hydrogen are still modest components of the picture. Interestingly, they see nuclear almost fading. Active transport advocates like me may have something to say about the massive $4b in electrified transport. If we focus on walkable 15-minute cities, we may need fewer electric automobiles. Though we need more electric trains and buses.
Albert Cheung of BNEF emphasizes the challenge. This week's figures promise short-term job creation and medium-term energy security, but more investment is needed to reach net zero in the long run.
I expect the BNEF Energy Transition Investment Trends report to show clean tech investment outpacing fossil fuels investment every year. Finally saying that is amazing. It's insufficient. The planet must maintain its electric (not gas) pedal. In response to the research, Christina Karapataki, VC at Breakthrough Energy Ventures, a clean tech investment firm, tweeted: Clean energy investment needs to average more than 3x this level, for the remainder of this decade, to get on track for BNEFs Net Zero Scenario. Go!