


More on Marketing

Francesca Furchtgott
3 years ago
Giving customers what they want or betraying the values of the brand?
A J.Crew collaboration for fashion label Eveliina Vintage is not a paradox; it is a solution.

Eveliina Vintage's capsule collection debuted yesterday at J.Crew. This J.Crew partnership stopped me in my tracks.
Eveliina Vintage sells vintage goods. Eeva Musacchia founded the shop in Finland in the 1970s. It's recognized for its one-of-a-kind slip dresses from the 1930s and 1940s.
I wondered why a vintage brand would partner with a mass shop. Fast fashion against vintage shopping? Will Eveliina Vintages customers be turned off?
But Eveliina Vintages customers don't care about sustainability. They want Eveliina's Instagram look. Eveliina Vintage collaborated with J.Crew to give customers what they wanted: more Eveliina at a lower price.
Vintage: A Fashion Option That Is Eco-Conscious
Secondhand shopping is a trendy response to quick fashion. J.Crew releases hundreds of styles annually. Waste and environmental damage have been criticized. A pair of jeans requires 1,800 gallons of water. J.Crew's limited-time deals promote more purchases. J.Crew items are likely among those Americans wear 7 times before discarding.
Consumers and designers have emphasized sustainability in recent years. Stella McCartney and Eileen Fisher are popular eco-friendly brands. They've also flocked to ThredUp and similar sites.
Gap, Levis, and Allbirds have listened to consumer requests. They promote recycling, ethical sourcing, and secondhand shopping.
Secondhand shoppers feel good about reusing and recycling clothing that might have ended up in a landfill.
Eco-conscious fashionistas shop vintage. These shoppers enjoy the thrill of the hunt (that limited-edition Chanel bag!) and showing off a unique piece (nobody will have my look!). They also reduce their environmental impact.
Is Eveliina Vintage capitalizing on an aesthetic or is it a sustainable brand?
Eveliina Vintage emphasizes environmental responsibility. Vogue's Amanda Musacchia emphasized sustainability. Amanda, founder Eeva's daughter, is a company leader.
But Eveliina's press message doesn't address sustainability, unlike Instagram. Scarcity and fame rule.
Eveliina Vintages Instagram has see-through dresses and lace-trimmed slip dresses. Celebrities and influencers are often photographed in Eveliina's apparel, which has 53,000+ followers. Vogue appreciates Eveliina's style. Multiple publications discuss Alexa Chung's Eveliina dress.
Eveliina Vintage markets its one-of-a-kind goods. It teases future content, encouraging visitors to return. Scarcity drives demand and raises clothing prices. One dress is $1,600+, but most are $500-$1,000.
The catch: Eveliina can't monetize its expanding popularity due to exorbitant prices and limited quantity. Why?
Most people struggle to pay for their clothing. But Eveliina Vintage lacks those more affordable entry-level products, in contrast to other luxury labels that sell accessories or perfume.
Many people have trouble fitting into their clothing. The bodies of most women in the past were different from those for which vintage clothing was designed. Each Eveliina dress's specific measurements are mentioned alongside it. Be careful, you can fall in love with an ill-fitting dress.
No matter how many people can afford it and fit into it, there is only one item to sell. To get the item before someone else does, those people must be on the Eveliina Vintage website as soon as it becomes available.
A Way for Eveliina Vintage to Make Money (and Expand) with J.Crew Its following
Eveliina Vintages' cooperation with J.Crew makes commercial sense.
This partnership spreads Eveliina's style. Slightly better pricing The $390 outfits have multicolored slips and gauzy cotton gowns. Sizes range from 00 to 24, which is wider than vintage racks.
Eveliina Vintage customers like the combination. Excited comments flood the brand's Instagram launch post. Nobody is mocking the 50-year-old vintage brand's fast-fashion partnership.
Vintage may be a sustainable fashion trend, but that's not why Eveliina's clients love the brand. They only care about the old look.
And that is a tale as old as fashion.

Saskia Ketz
3 years ago
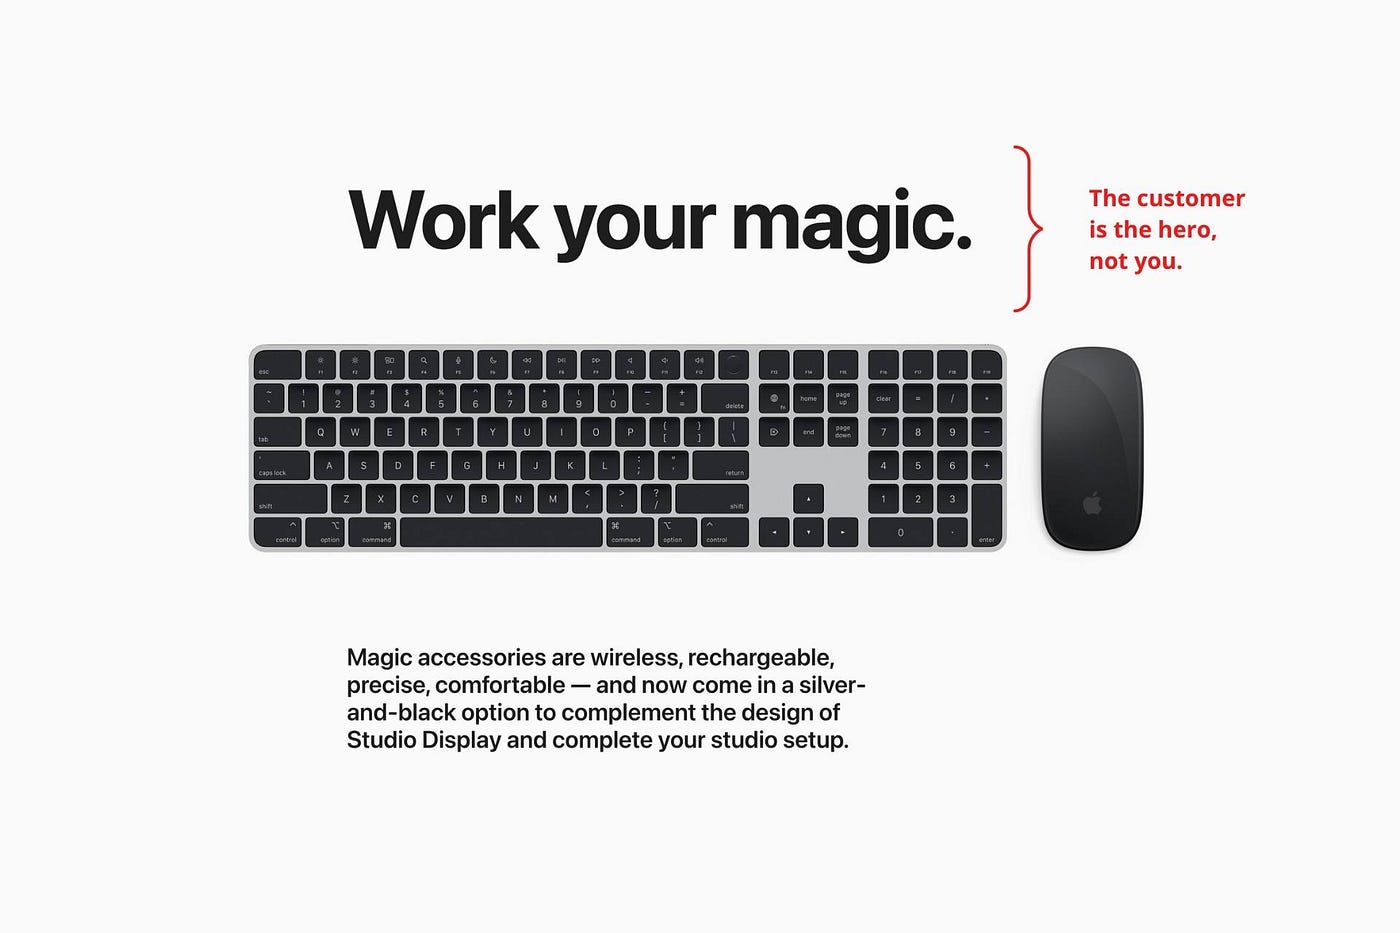
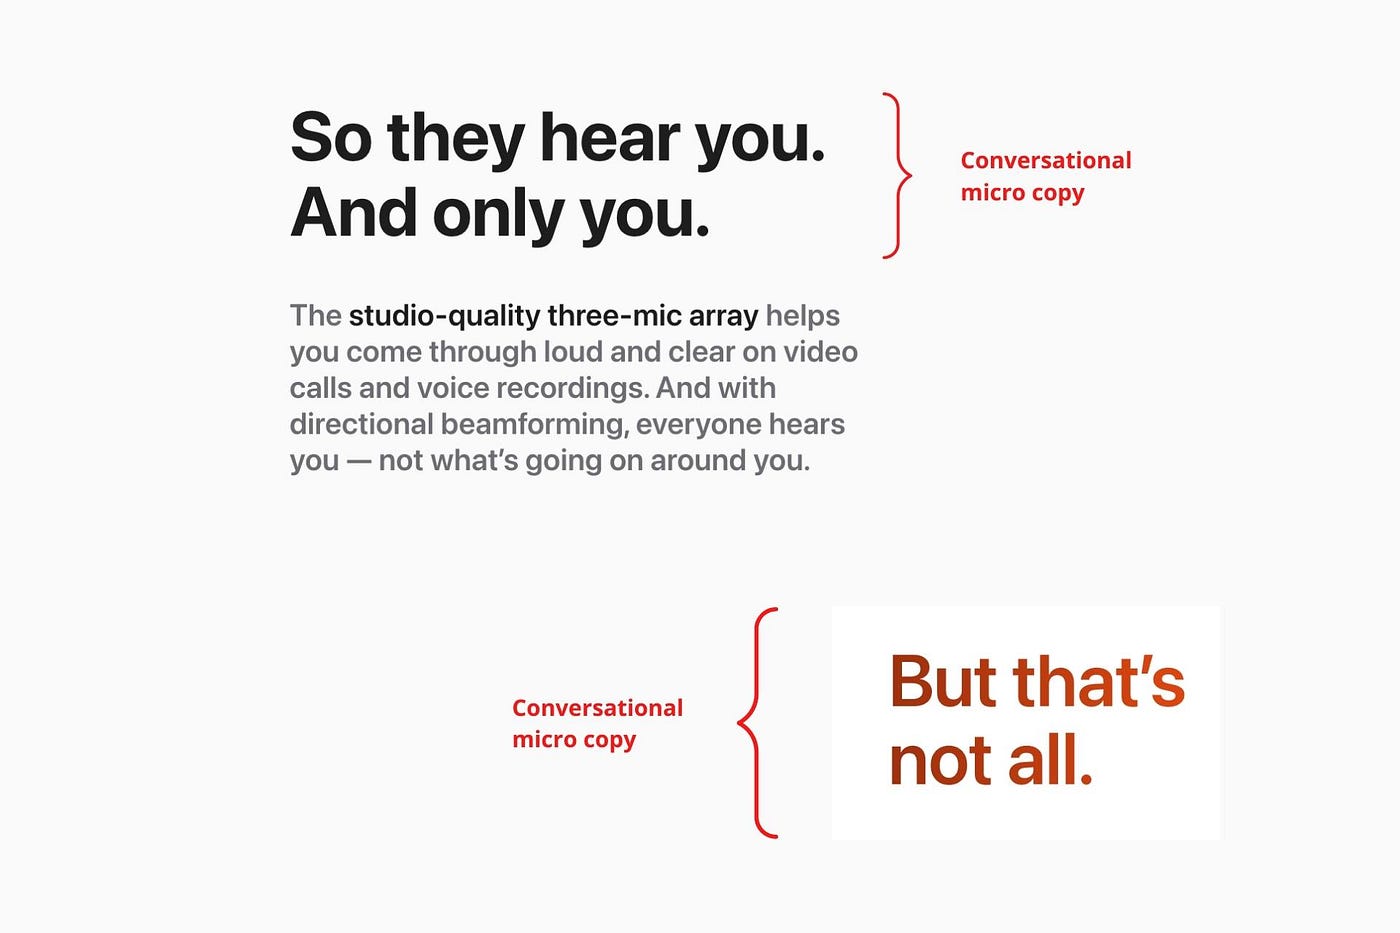
I hate marketing for my business, but here's how I push myself to keep going
Start now.

When it comes to building my business, I’m passionate about a lot of things. I love creating user experiences that simplify branding essentials. I love creating new typefaces and color combinations to inspire logo designers. I love fixing problems to improve my product.
Business marketing isn't my thing.
This is shared by many. Many solopreneurs, like me, struggle to advertise their business and drive themselves to work on it.
Without a lot of promotion, no company will succeed. Marketing is 80% of developing a firm, and when you're starting out, it's even more. Some believe that you shouldn't build anything until you've begun marketing your idea and found enough buyers.
Marketing your business without marketing experience is difficult. There are various outlets and techniques to learn. Instead of figuring out where to start, it's easier to return to your area of expertise, whether that's writing, designing product features, or improving your site's back end. Right?
First, realize that your role as a founder is to market your firm. Being a founder focused on product, I rarely work on it.
Secondly, use these basic methods that have helped me dedicate adequate time and focus to marketing. They're all simple to apply, and they've increased my business's visibility and success.
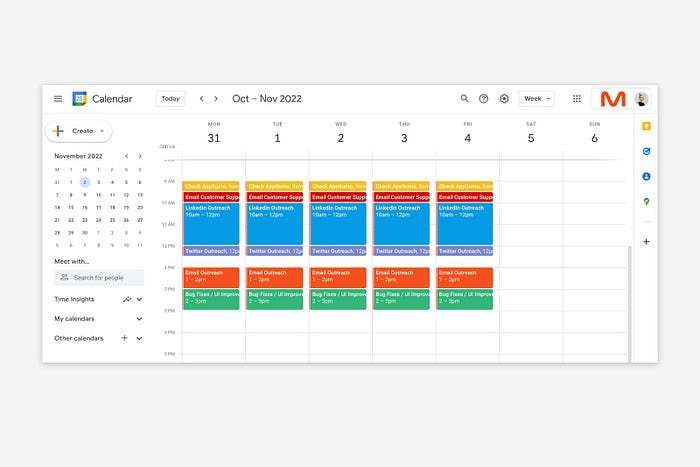
1. Establish buckets for every task.
You've probably heard to schedule tasks you don't like. As simple as it sounds, blocking a substantial piece of my workday for marketing duties like LinkedIn or Twitter outreach, AppSumo customer support, or SEO has forced me to spend time on them.
Giving me lots of room to focus on product development has helped even more. Sure, this means scheduling time to work on product enhancements after my four-hour marketing sprint.
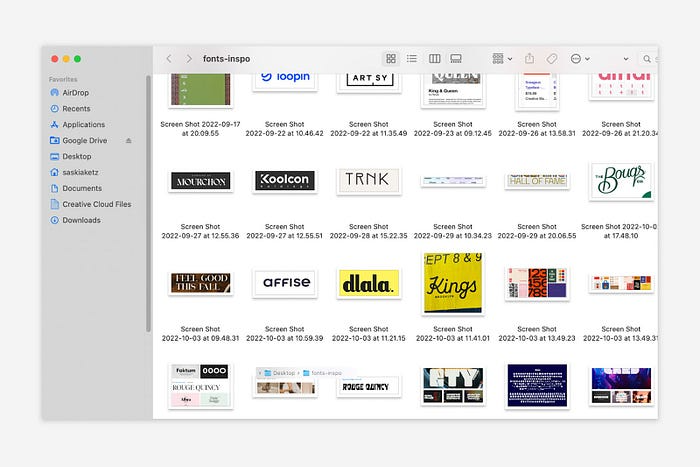
It also involves making space to store product inspiration and ideas throughout the day so I don't get distracted. This is like the advice to keep a notebook beside your bed to write down your insomniac ideas. I keep fonts, color palettes, and product ideas in folders on my desktop. Knowing these concepts won't be lost lets me focus on marketing in the moment. When I have limited time to work on something, I don't have to conduct the research I've been collecting, so I can get more done faster.
2. Look for various accountability systems
Accountability is essential for self-discipline. To keep focused on my marketing tasks, I've needed various streams of accountability, big and little.
Accountability groups are great for bigger things. SaaS Camp, a sales outreach coaching program, is mine. We discuss marketing duties and results every week. This motivates me to do enough each week to be proud of my accomplishments. Yet hearing what works (or doesn't) for others gives me benchmarks for my own marketing outcomes and plenty of fresh techniques to attempt.
… say, I want to DM 50 people on Twitter about my product — I get that many Q-tips and place them in one pen holder on my desk.
The best accountability group can't watch you 24/7. I use a friend's simple method that shouldn't work (but it does). When I have a lot of marketing chores, like DMing 50 Twitter users about my product, That many Q-tips go in my desk pen holder. After each task, I relocate one Q-tip to an empty pen holder. When you have a lot of minor jobs to perform, it helps to see your progress. You might use toothpicks, M&Ms, or anything else you have a lot of.

3. Continue to monitor your feedback loops
Knowing which marketing methods work best requires monitoring results. As an entrepreneur with little go-to-market expertise, every tactic I pursue is an experiment. I need to know how each trial is doing to maximize my time.
I placed Google and Facebook advertisements on hold since they took too much time and money to obtain Return. LinkedIn outreach has been invaluable to me. I feel that talking to potential consumers one-on-one is the fastest method to grasp their problem areas, figure out my messaging, and find product market fit.
Data proximity offers another benefit. Seeing positive results makes it simpler to maintain doing a work you don't like. Why every fitness program tracks progress.
Marketing's goal is to increase customers and revenues, therefore I've found it helpful to track those metrics and celebrate monthly advances. I provide these updates for extra accountability.
Finding faster feedback loops is also motivating. Marketing brings more clients and feedback, in my opinion. Product-focused founders love that feedback. Positive reviews make me proud that my product is benefitting others, while negative ones provide me with suggestions for product changes that can improve my business.
The best advice I can give a lone creator who's afraid of marketing is to just start. Start early to learn by doing and reduce marketing stress. Start early to develop habits and successes that will keep you going. The sooner you start, the sooner you'll have enough consumers to return to your favorite work.

Rachel Greenberg
3 years ago
6 Causes Your Sales Pitch Is Unintentionally Repulsing Customers
Skip this if you don't want to discover why your lively, no-brainer pitch isn't making $10k a month.

You don't want to be repulsive as an entrepreneur or anyone else. Making friends, influencing people, and converting strangers into customers will be difficult if your words evoke disgust, distrust, or disrespect. You may be one of many entrepreneurs who do this obliviously and involuntarily.
I've had to master selling my skills to recruiters (to land 6-figure jobs on Wall Street), selling companies to buyers in M&A transactions, and selling my own companies' products to strangers-turned-customers. I probably committed every cardinal sin of sales repulsion before realizing it was me or my poor salesmanship strategy.
If you're launching a new business, frustrated by low conversion rates, or just curious if you're repelling customers, read on to identify (and avoid) the 6 fatal errors that can kill any sales pitch.
1. The first indication
So many people fumble before they even speak because they assume their role is to convince the buyer. In other words, they expect to pressure, arm-twist, and combat objections until they convert the buyer. Actuality, the approach stinks of disgust, and emotionally-aware buyers would feel "gross" immediately.
Instead of trying to persuade a customer to buy, ask questions that will lead them to do so on their own. When a customer discovers your product or service on their own, they need less outside persuasion. Why not position your offer in a way that leads customers to sell themselves on it?
2. A flawless performance
Are you memorizing a sales script, tweaking video testimonials, and expunging historical blemishes before hitting "publish" on your new campaign? If so, you may be hurting your conversion rate.
Perfection may be a step too far and cause prospects to mistrust your sincerity. Become a great conversationalist to boost your sales. Seriously. Being charismatic is hard without being genuine and showing a little vulnerability.
People like vulnerability, even if it dents your perfect facade. Show the customer's stuttering testimonial. Open up about your or your company's past mistakes (and how you've since improved). Make your sales pitch a two-way conversation. Let the customer talk about themselves to build rapport. Real people sell, not canned scripts and movie-trailer testimonials.
If marketing or sales calls feel like a performance, you may be doing something wrong or leaving money on the table.
3. Your greatest phobia
Three minutes into prospect talks, I'd start sweating. I was talking 100 miles per hour, covering as many bases as possible to avoid the ones I feared. I knew my then-offering was inadequate and my firm had fears I hadn't addressed. So I word-vomited facts, features, and everything else to avoid the customer's concerns.
Do my prospects know I'm insecure? Maybe not, but it added an unnecessary and unhelpful layer of paranoia that kept me stressed, rushed, and on edge instead of connecting with the prospect. Skirting around a company, product, or service's flaws or objections is a poor, temporary, lazy (and cowardly) decision.
How can you project confidence and trust if you're afraid? Before you make another sales call, face your shortcomings, weak points, and objections. Your company won't be everyone's cup of tea, but you should have answers to every question or objection. You should be your business's top spokesperson and defender.
4. The unintentional apologies
Have you ever begged for a sale? I'm going to say no, however you may be unknowingly emitting sorry, inferior, insecure energy.
Young founders, first-time entrepreneurs, and those with severe imposter syndrome may elevate their target customer. This is common when trying to get first customers for obvious reasons.
Since you're truly new at this, you naturally lack experience.
You don't have the self-confidence boost of thousands or hundreds of closed deals or satisfied client results to remind you that your good or service is worthwhile.
Getting those initial few clients seems like the most difficult task, as if doing so will decide the fate of your company as a whole (it probably won't, and you shouldn't actually place that much emphasis on any one transaction).
Customers can smell fear, insecurity, and anxiety just like they can smell B.S. If you believe your product or service improves clients' lives, selling it should feel like a benevolent act of service, not a sleazy money-grab. If you're a sincere entrepreneur, prospects will believe your proposition; if you're apprehensive, they'll notice.
Approach every sale as if you're fine with or without it. This has improved my salesmanship, marketing skills, and mental health. When you put pressure on yourself to close a sale or convince a difficult prospect "or else" (your company will fail, your rent will be late, your electricity will be cut), you emit desperation and lower the quality of your pitch. There's no point.
5. The endless promises
We've all read a million times how to answer or disprove prospects' arguments and add extra incentives to speed or secure the close. Some objections shouldn't be refuted. What if I told you not to offer certain incentives, bonuses, and promises? What if I told you to walk away from some prospects, even if it means losing your sales goal?
If you market to enough people, make enough sales calls, or grow enough companies, you'll encounter prospects who can't be satisfied. These prospects have endless questions, concerns, and requests for more, more, more that you'll never satisfy. These people are a distraction, a resource drain, and a test of your ability to cut losses before they erode your sanity and profit margin.
To appease or convert these insatiably needy, greedy Nellies into customers, you may agree with or acquiesce to every request and demand — even if you can't follow through. Once you overpromise and answer every hole they poke, their trust in you may wane quickly.
Telling a prospect what you can't do takes courage and integrity. If you're honest, upfront, and willing to admit when a product or service isn't right for the customer, you'll gain respect and positive customer experiences. Sometimes honesty is the most refreshing pitch and the deal-closer.
6. No matter what
Have you ever said, "I'll do anything to close this sale"? If so, you've probably already been disqualified. If a prospective customer haggles over a price, requests a discount, or continues to wear you down after you've made three concessions too many, you have a metal hook in your mouth, not them, and it may not end well. Why?
If you're so willing to cut a deal that you cut prices, comp services, extend payment plans, waive fees, etc., you betray your own confidence that your product or service was worth the stated price. They wonder if anyone is paying those prices, if you've ever had a customer (who wasn't a blood relative), and if you're legitimate or worth your rates.
Once a prospect senses that you'll do whatever it takes to get them to buy, their suspicions rise and they wonder why.
Why are you cutting pricing if something is wrong with you or your service?
Why are you so desperate for their sale?
Why aren't more customers waiting in line to pay your pricing, and if they aren't, what on earth are they doing there?
That's what a prospect thinks when you reveal your lack of conviction, desperation, and willingness to give up control. Some prospects will exploit it to drain you dry, while others will be too frightened to buy from you even if you paid them.
Walking down a two-way street. Be casual.
If we track each act of repulsion to an uneasiness, fear, misperception, or impulse, it's evident that these sales and marketing disasters were forced communications. Stiff, imbalanced, divisive, combative, bravado-filled, and desperate. They were unnatural and accepted a power struggle between two sparring, suspicious, unequal warriors, rather than a harmonious oneness of two natural, but opposite parties shaking hands.
Sales should be natural, harmonious. Sales should feel good for both parties, not like one party is having their arm twisted.
You may be doing sales wrong if it feels repulsive, icky, or degrading. If you're thinking cringe-worthy thoughts about yourself, your product, service, or sales pitch, imagine what you're projecting to prospects. Don't make it unpleasant, repulsive, or cringeworthy.
You might also like
Hannah Elliott
3 years ago
Pebble Beach Auto Auctions Set $469M Record
The world's most prestigious vintage vehicle show included amazing autos and record-breaking sums.

This 1932 Duesenberg J Figoni Sports Torpedo earned Best of Show in 2022.
David Paul Morris (DPM)/Bloomberg
2022 Pebble Beach Concours d'Elegance winner was a pre-war roadster.
Lee Anderson's 1932 Duesenberg J Figoni Sports Torpedo won Best of Show at Pebble Beach Golf Links near Carmel, Calif., on Sunday. First American win since 2013.
Sandra Button, chairperson of the annual concours, said the car, whose chassis and body had been separated for years, "marries American force with European style." "Its resurrection story is passionate."

Pebble Beach Concours d'Elegance Auction
Since 1950, the Pebble Beach Concours d'Elegance has welcomed the world's most costly collectable vehicles for a week of parties, auctions, rallies, and high-roller meetings. The cold, dreary weather highlighted the automobiles' stunning lines and hues.
DPM/Bloomberg

A visitor photographs a 1948 Ferrari 166 MM Touring Barchetta. This is one of 25 Ferraris manufactured in the years after World War II. First shown at the 1948 Turin Salon. Others finished Mille Miglia and Le Mans, which set the tone for Ferrari racing for years.
DPM/Bloomberg
This year's frontrunners were ultra-rare pre-war and post-war automobiles with long and difficult titles, such a 1937 Talbot-Lago T150C-SS Figoni & Falaschi Teardrop Coupe and a 1951 Talbot-Lago T26 Grand Sport Stabilimenti Farina Cabriolet.
The hefty, enormous coaches inspire visions of golden pasts when mysterious saloons swept over the road with otherworldly style, speed, and grace. Only the richest and most powerful people, like Indian maharaja and Hollywood stars, owned such vehicles.
Antonio Chopitea, a Peruvian sugar tycoon, ordered a new Duesenberg in Paris. Hemmings says the two-tone blue beauty was moved to the US and dismantled in the 1960s. Body and chassis were sold separately and rejoined decades later in a three-year, prize-winning restoration.
The concours is the highlight of Monterey Car Week, a five-day Super Bowl for car enthusiasts. Early events included Porsche and Ferrari displays, antique automobile races, and new-vehicle debuts. Many auto executives call Monterey Car Week the "new auto show."
Many visitors were drawn to the record-breaking auctions.

A 1969 Porsche 908/02 auctioned for $4.185 million. Flat-eight air-cooled engine, 90.6-inch wheelbase, 1,320-pound weight. Vic Elford, Richard Attwood, Rudi Lins, Gérard Larrousse, Kurt Ahrens Jr., Masten Gregory, and Pedro Rodriguez drove it, according to Gooding.
DPM/Bloomberg
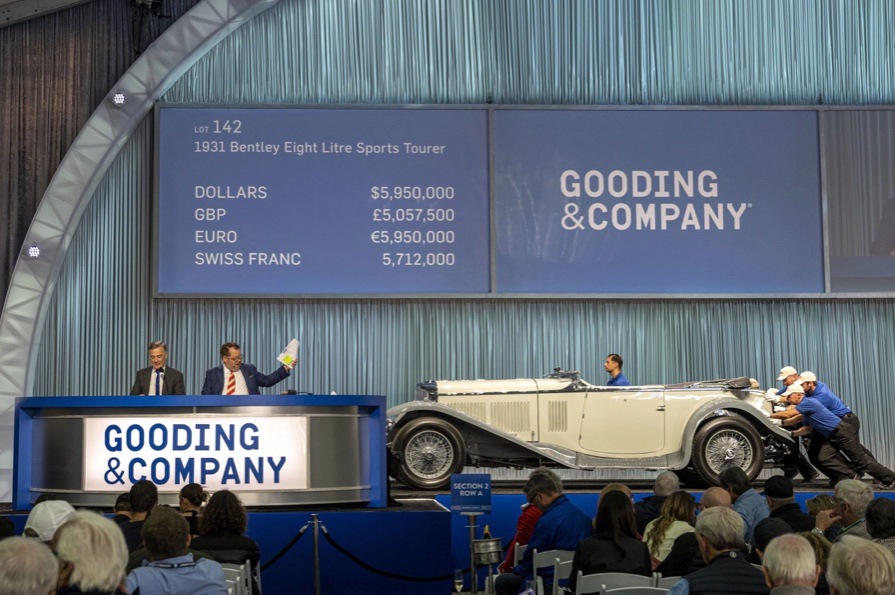
The 1931 Bentley Eight Liter Sports Tourer doesn't meet its reserve. Gooding & Co., the official auction house of the concours, made more than $105 million and had an 82% sell-through rate. This powerful open-top tourer is one of W.O. Bentley's 100 automobiles. Only 80 remain.
DPM/Bloomberg
The final auction on Aug. 21 brought in $456.1 million, breaking the previous high of $394.48 million established in 2015 in Monterey. “The week put an exclamation point on what has been an exceptional year for the collector automobile market,” Hagerty analyst John Wiley said.
Many cars that go unsold at public auction are sold privately in the days after. After-sales pushed the week's haul to $469 million on Aug. 22, up 18.9% from 2015's record.
In today's currencies, 2015's record sales amount to $490 million, Wiley noted. The dollar is degrading faster than old autos.
Still, 113 million-dollar automobiles sold. The average car sale price was $583,211, up from $446,042 last year, while multimillion-dollar hammer prices made up around 75% of total sales.
Industry insiders and market gurus expected that stock market volatility, the crisis in Ukraine, and the dollar-euro exchange rate wouldn't influence the world's biggest spenders.
Classic.com's CEO said there's no hint of a recession in an e-mail. Big sales and crowds.

Ticket-holders wore huge hats, flowery skirts, and other Kentucky Derby-esque attire. Coffee, beverages, and food are extra.
DPM/Bloomberg

Mercedes-Benz 300 SL Gullwing, 1955. Mercedes produced the two-seat gullwing coupe from 1954–1957 and the roadster from 1957–1963. It was once West Germany's fastest and most powerful automobile. You'd be hard-pressed to locate one for less $1 million.
DPM/Bloomberg
1955 Ferrari 410 Sport sold for $22 million at RM Sotheby's. It sold a 1937 Mercedes-Benz 540K Sindelfingen Roadster for $9.9 million and a 1924 Hispano-Suiza H6C Transformable Torpedo for $9.245 million. The family-run mansion sold $221.7 million with a 90% sell-through rate, up from $147 million in 2021. This year, RM Sotheby's cars averaged $1.3 million.
Not everyone saw such great benefits.
Gooding & Co., the official auction house of the concours, made more than $105 million and had an 82% sell-through rate. 1937 Bugatti Type 57SC Atalante, 1990 Ferrari F40, and 1994 Bugatti EB110 Super Sport were top sellers.

The 1969 Autobianchi A112 Bertone. This idea two-seater became a Hot Wheels toy but was never produced. It has a four-speed manual drive and an inline-four mid-engine arrangement like the Lamborghini Miura.
DPM/Bloomberg
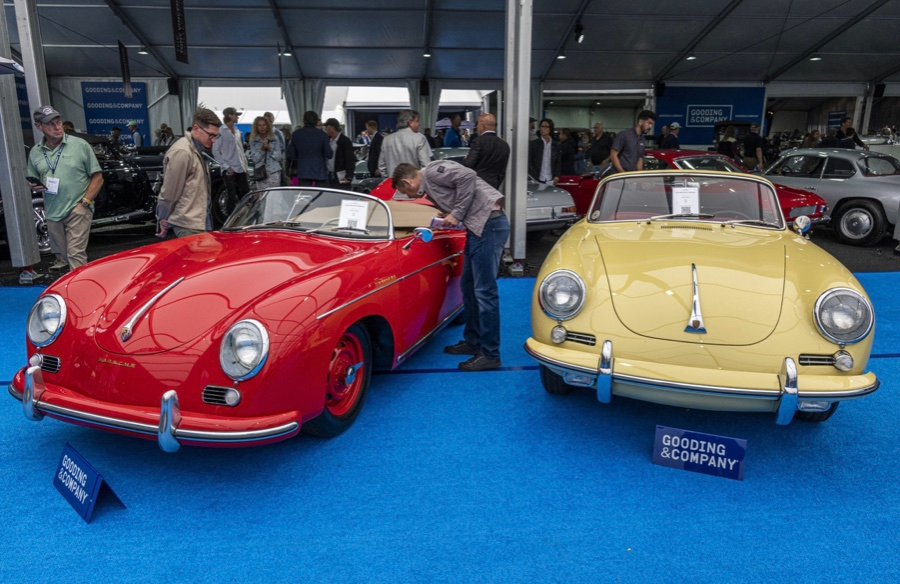
1956 Porsche 356 A Speedster at Gooding & Co. The Porsche 356 is a lightweight, rear-engine, rear-wheel drive vehicle that lacks driving power but is loved for its rounded, Beetle-like hardtop coupé and open-top versions.
DPM/Bloomberg
Mecum sold $50.8 million with a 64% sell-through rate, down from $53.8 million and 77% in 2021. Its top lot, a 1958 Ferrari 250 GT 'Tour de France' Alloy Coupe, sold for $2.86 million, but its average price was $174,016.
Bonhams had $27.8 million in sales with an 88% sell-through rate. The same sell-through generated $35.9 million in 2021.
Gooding & Co. and RM Sotheby's posted all 10 top sales, leaving Bonhams, Mecum, and Hagerty-owned Broad Arrow fighting for leftovers. Six of the top 10 sellers were Ferraris, which remain the gold standard for collectable automobiles. Their prices have grown over decades.
Classic.com's Calle claimed RM Sotheby's "stole the show," but "BroadArrow will be a force to reckon with."
Although pre-war cars were hot, '80s and '90s cars showed the most appreciation and attention. Generational transition and new buyer profile."

2022 Pebble Beach Concours d'Elegance judges inspect 1953 Siata 208. The rounded coupe was introduced at the 1952 Turin Auto Show in Italy and is one of 18 ever produced. It sports a 120hp Fiat engine, five-speed manual transmission, and alloy drum brakes. Owners liked their style, but not their reliability.
DPM/Bloomberg

The Czinger 21 CV Max at Pebble Beach. Monterey Car Week concentrates on historic and classic automobiles, but modern versions like this Czinger hypercar also showed.
DPM/Bloomberg
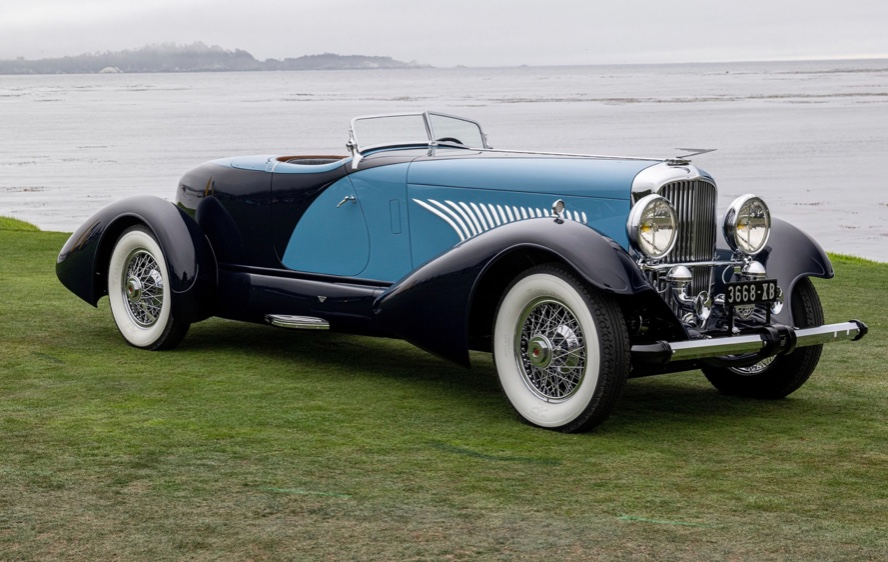
The 1932 Duesenberg J Figoni Sports Torpedo won Best in Show in 2022. Lee and Penny Anderson of Naples, Fla., own the once-separate-chassis-from-body automobile.
DPM/Bloomberg

Steffan Morris Hernandez
3 years ago
10 types of cognitive bias to watch out for in UX research & design
10 biases in 10 visuals
Cognitive biases are crucial for UX research, design, and daily life. Our biases distort reality.
After learning about biases at my UX Research bootcamp, I studied Erika Hall's Just Enough Research and used the Nielsen Norman Group's wealth of information. 10 images show my findings.
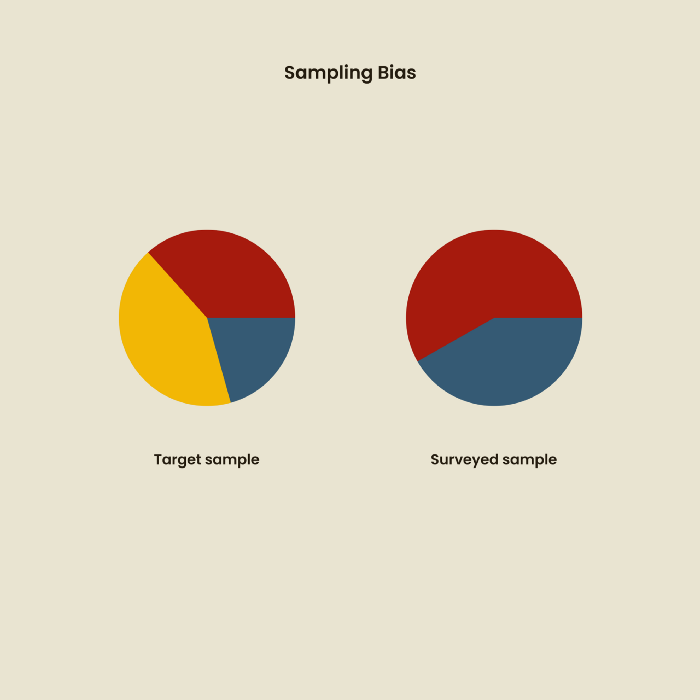
1. Bias in sampling
Misselection of target population members causes sampling bias. For example, you are building an app to help people with food intolerances log their meals and are targeting adult males (years 20-30), adult females (ages 20-30), and teenage males and females (ages 15-19) with food intolerances. However, a sample of only adult males and teenage females is biased and unrepresentative.
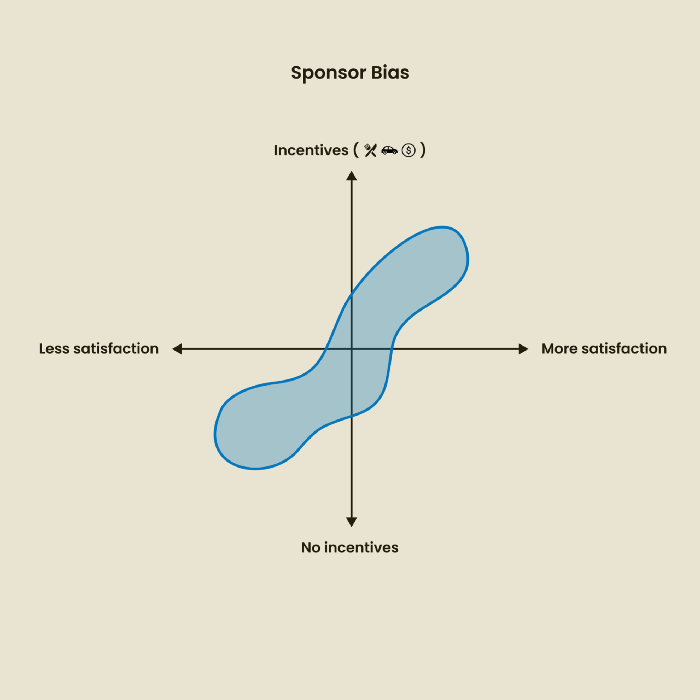
2. Sponsor Disparity
Sponsor bias occurs when a study's findings favor an organization's goals. Beware if X organization promises to drive you to their HQ, compensate you for your time, provide food, beverages, discounts, and warmth. Participants may endeavor to be neutral, but incentives and prizes may bias their evaluations and responses in favor of X organization.
In Just Enough Research, Erika Hall suggests describing the company's aims without naming it.
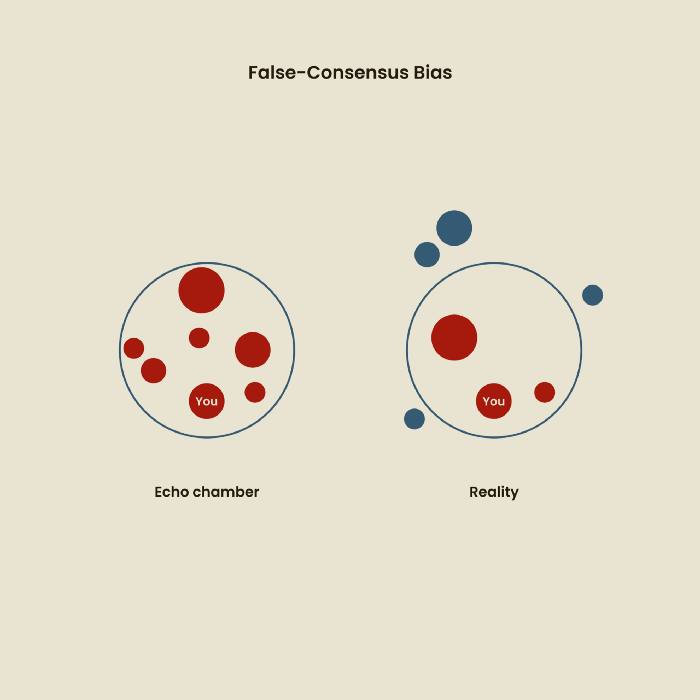
Third, False-Consensus Bias
False-consensus bias is when a person thinks others think and act the same way. For instance, if a start-up designs an app without researching end users' needs, it could fail since end users may have different wants. https://www.nngroup.com/videos/false-consensus-effect/
Working directly with the end user and employing many research methodologies to improve validity helps lessen this prejudice. When analyzing data, triangulation can boost believability.
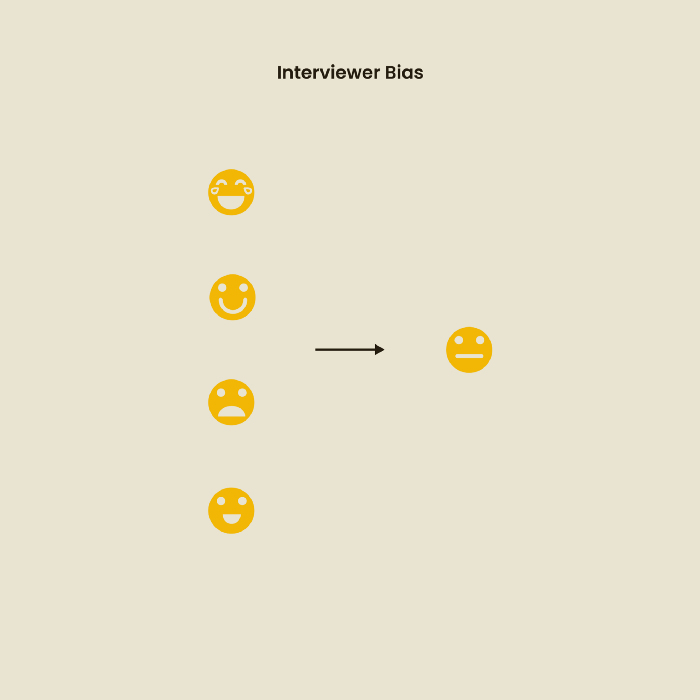
Bias of the interviewer
I struggled with this bias during my UX research bootcamp interviews. Interviewing neutrally takes practice and patience. Avoid leading questions that structure the story since the interviewee must interpret them. Nodding or smiling throughout the interview may subconsciously influence the interviewee's responses.
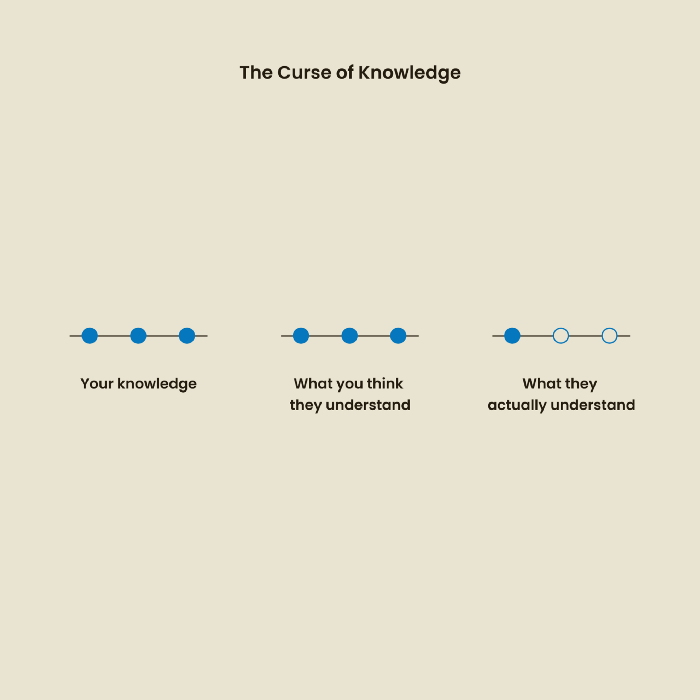
The Curse of Knowledge
The curse of knowledge occurs when someone expects others understand a subject as well as they do. UX research interviews and surveys should reduce this bias because technical language might confuse participants and harm the research. Interviewing participants as though you are new to the topic may help them expand on their replies without being influenced by the researcher's knowledge.
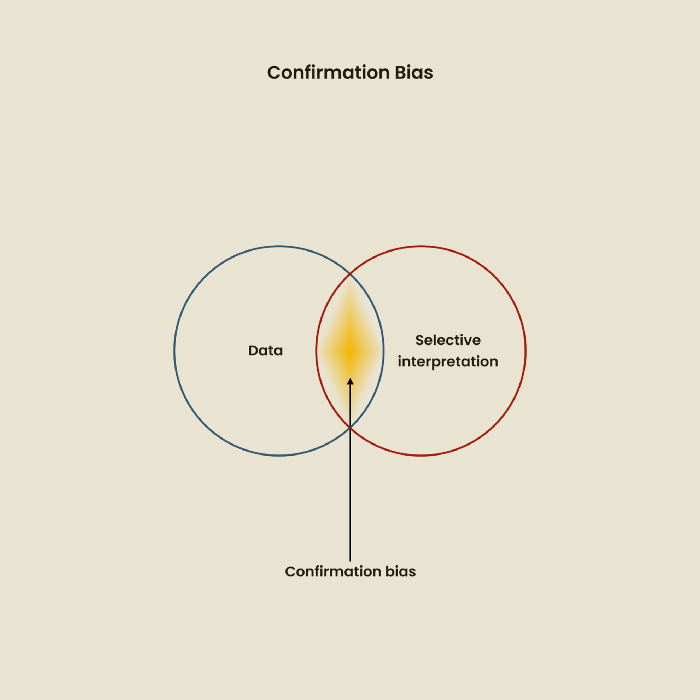
Confirmation Bias
Most prevalent bias. People highlight evidence that supports their ideas and ignore data that doesn't. The echo chamber of social media creates polarization by promoting similar perspectives.
A researcher with confirmation bias may dismiss data that contradicts their research goals. Thus, the research or product may not serve end users.
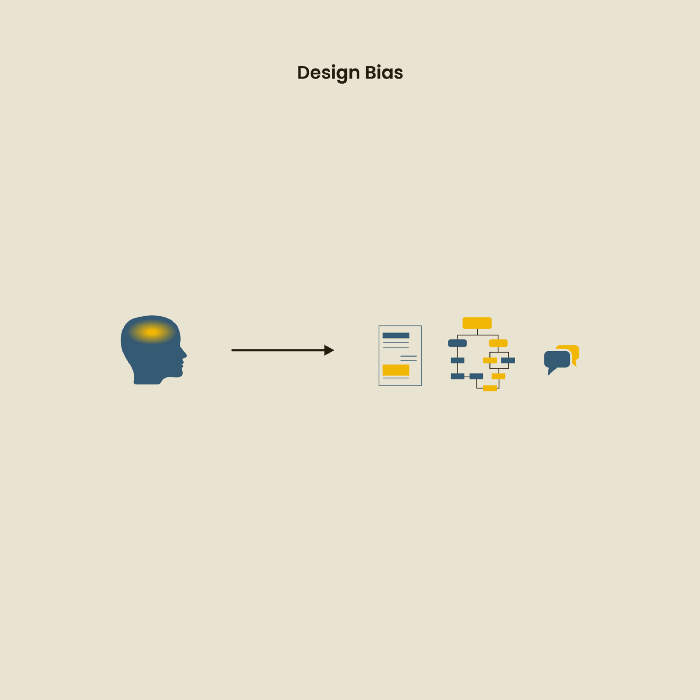
Design biases
UX Research design bias pertains to study construction and execution. Design bias occurs when data is excluded or magnified based on human aims, assumptions, and preferences.
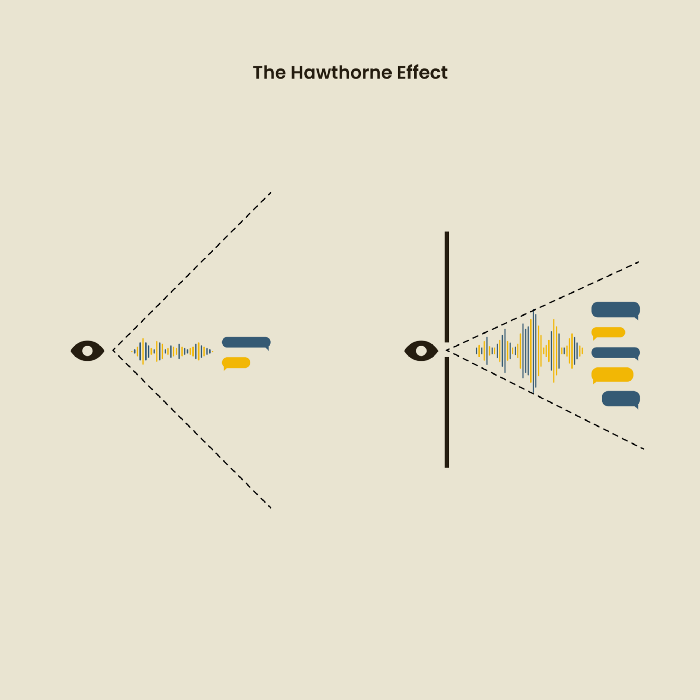
The Hawthorne Impact
Remember when you behaved differently while the teacher wasn't looking? When you behaved differently without your parents watching? A UX research study's Hawthorne Effect occurs when people modify their behavior because you're watching. To escape judgment, participants may act and speak differently.
To avoid this, researchers should blend into the background and urge subjects to act alone.
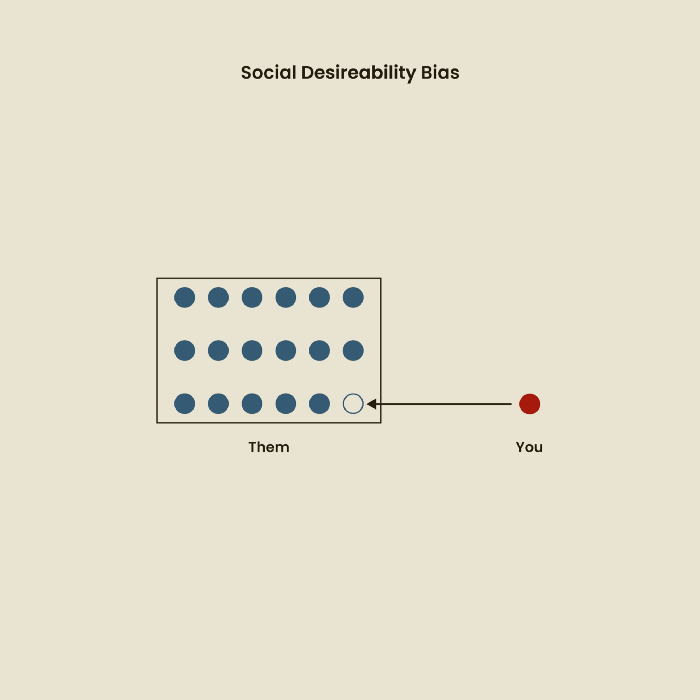
The bias against social desire
People want to belong to escape rejection and hatred. Research interviewees may mislead or slant their answers to avoid embarrassment. Researchers should encourage honesty and confidentiality in studies to address this. Observational research may reduce bias better than interviews because participants behave more organically.
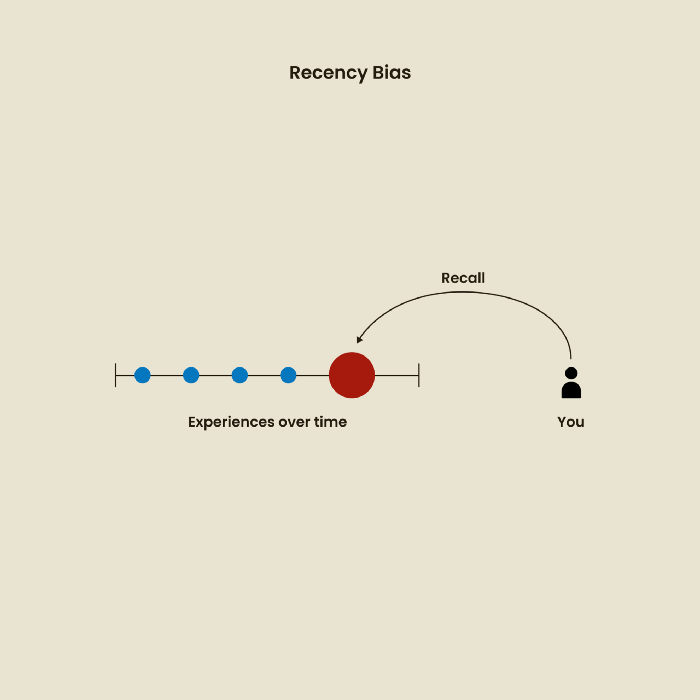
Relative Time Bias
Humans tend to appreciate recent experiences more. Consider school. Say you failed a recent exam but did well in the previous 7 exams. Instead, you may vividly recall the last terrible exam outcome.
If a UX researcher relies their conclusions on the most recent findings instead of all the data and results, recency bias might occur.
I hope you liked learning about UX design, research, and real-world biases.
Thomas Smith
3 years ago
ChatGPT Is Experiencing a Lightbulb Moment
Why breakthrough technologies must be accessible

ChatGPT has exploded. Over 1 million people have used the app, and coding sites like Stack Overflow have banned its answers. It's huge.
I wouldn't have called that as an AI researcher. ChatGPT uses the same GPT-3 technology that's been around for over two years.
More than impressive technology, ChatGPT 3 shows how access makes breakthroughs usable. OpenAI has finally made people realize the power of AI by packaging GPT-3 for normal users.
We think of Thomas Edison as the inventor of the lightbulb, not because he invented it, but because he popularized it.
Going forward, AI companies that make using AI easy will thrive.
Use-case importance
Most modern AI systems use massive language models. These language models are trained on 6,000+ years of human text.
GPT-3 ate 8 billion pages, almost every book, and Wikipedia. It created an AI that can write sea shanties and solve coding problems.
Nothing new. I began beta testing GPT-3 in 2020, but the system's basics date back further.
Tools like GPT-3 are hidden in many apps. Many of the AI writing assistants on this platform are just wrappers around GPT-3.
Lots of online utilitarian text, like restaurant menu summaries or city guides, is written by AI systems like GPT-3. You've probably read GPT-3 without knowing it.
Accessibility
Why is ChatGPT so popular if the technology is old?
ChatGPT makes the technology accessible. Free to use, people can sign up and text with the chatbot daily. ChatGPT isn't revolutionary. It does it in a way normal people can access and be amazed by.
Accessibility isn't easy. OpenAI's Sam Altman tweeted that opening ChatGPT to the public increased computing costs.
Each chat costs "low-digit cents" to process. OpenAI probably spends several hundred thousand dollars a day to keep ChatGPT running, with no immediate business case.
Academic researchers and others who developed GPT-3 couldn't afford it. Without resources to make technology accessible, it can't be used.
Retrospective
This dynamic is old. In the history of science, a researcher with a breakthrough idea was often overshadowed by an entrepreneur or visionary who made it accessible to the public.
We think of Thomas Edison as the inventor of the lightbulb. But really, Vasilij Petrov, Thomas Wright, and Joseph Swan invented the lightbulb. Edison made technology visible and accessible by electrifying public buildings, building power plants, and wiring.
Edison probably lost a ton of money on stunts like building a power plant to light JP Morgan's home, the NYSE, and several newspaper headquarters.
People wanted electric lights once they saw their benefits. By making the technology accessible and visible, Edison unlocked a hugely profitable market.
Similar things are happening in AI. ChatGPT shows that developing breakthrough technology in the lab or on B2B servers won't change the culture.
AI must engage people's imaginations to become mainstream. Before the tech impacts the world, people must play with it and see its revolutionary power.
As the field evolves, companies that make the technology widely available, even at great cost, will succeed.
OpenAI's compute fees are eye-watering. Revolutions are costly.