


More on Entrepreneurship/Creators

Mangu Solutions
3 years ago
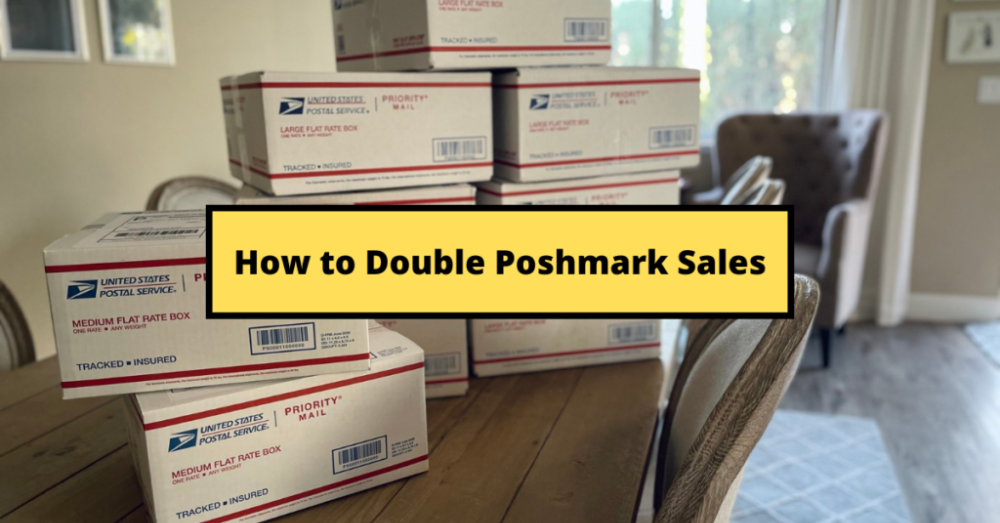
Growing a New App to $15K/mo in 6 Months [SaaS Case Study]
Discover How We Used Facebook Ads to Grow a New Mobile App from $0 to $15K MRR in Just 6 Months and Our Strategy to Hit $100K a Month.
Our client introduced a mobile app for Poshmark resellers in December and wanted as many to experience it and subscribe to the monthly plan.
An Error We Committed
We initiated a Facebook ad campaign with a "awareness" goal, not "installs." This sent them to a landing page that linked to the iPhone App Store and Android Play Store. Smart, right?
We got some installs, but we couldn't tell how many came from the ad versus organic/other channels because the objective we chose only reported landing page clicks, not app installs.
We didn't know which interest groups/audiences had the best cost per install (CPI) to optimize and scale our budget.
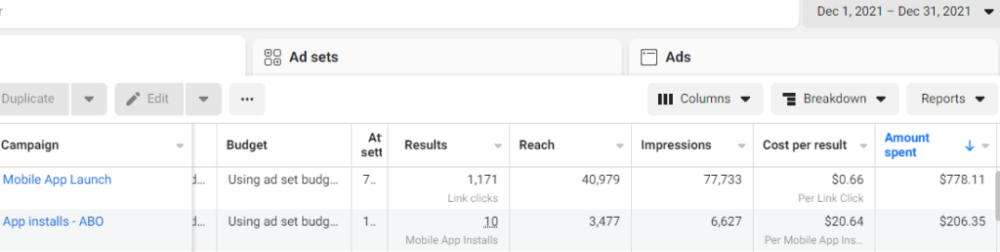
After spending $700 without adequate data (installs and trials report), we stopped the campaign and worked with our client's app developer to set up app events tracking.
This allowed us to create an installs campaign and track installs, trials, and purchases (in some cases).
Finding a Successful Audience
Once we knew what ad sets brought in what installs at what cost, we began optimizing and testing other interest groups and audiences, growing the profitable low CPI ones and eliminating the high CPI ones.
We did all our audience testing using an ABO campaign (Ad Set Budget Optimization), spending $10 to $30 on each ad set for three days and optimizing afterward. All ad sets under $30 were moved to a CBO campaign (Campaign Budget Optimization).
We let Facebook's AI decide how much to spend on each ad set, usually the one most likely to convert at the lowest cost.
If the CBO campaign maintains a nice CPI, we keep increasing the budget by $50 every few days or duplicating it sometimes in order to double the budget. This is how we've scaled to $400/day profitably.
Finding Successful Creatives
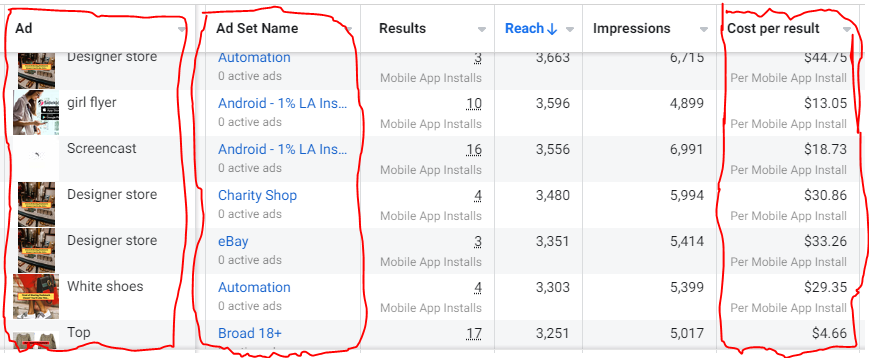
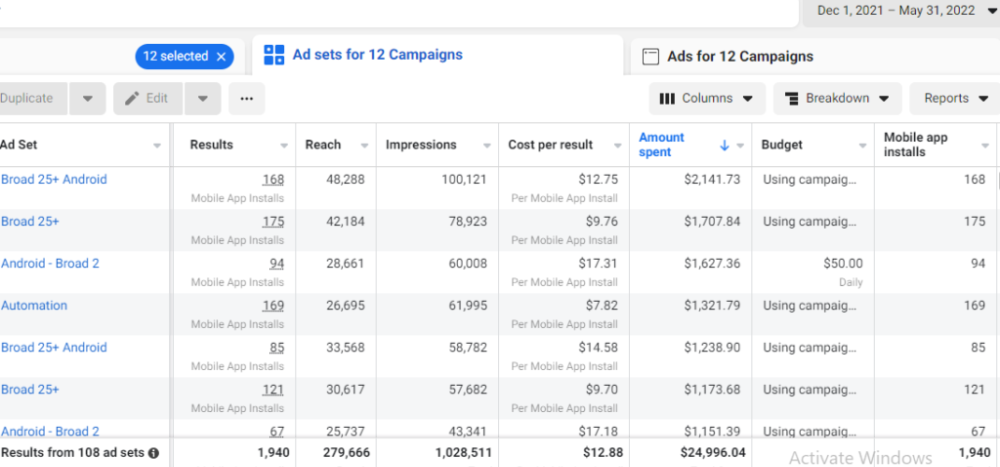
Per campaign, we tested 2-6 images/videos. Same ad copy and CTA. There was no clear winner because some images did better with some interest groups.
The image above with mail packages, for example, got us a cheap CPI of $9.71 from our Goodwill Stores interest group but, a high $48 CPI from our lookalike audience. Once we had statistically significant data, we turned off the high-cost ad.
New marketers who are just discovering A/B testing may assume it's black and white — winner and loser. However, Facebook ads' machine learning and reporting has gotten so sophisticated that it's hard to call a creative a flat-out loser, but rather a 'bad fit' for some audiences, and perfect for others.
You can see how each creative performs across age groups and optimize.
How Many Installs Did It Take Us to Earn $15K Per Month?
Six months after paying $25K, we got 1,940 app installs, 681 free trials, and 522 $30 monthly subscriptions. 522 * $30 gives us $15,660 in monthly recurring revenue (MRR).
Next, what? $100K per month
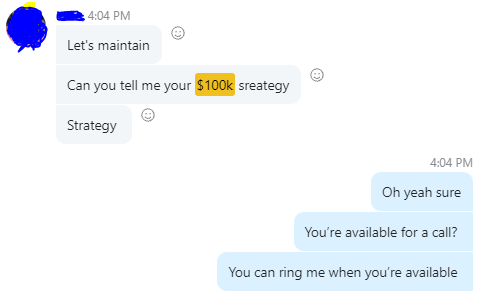
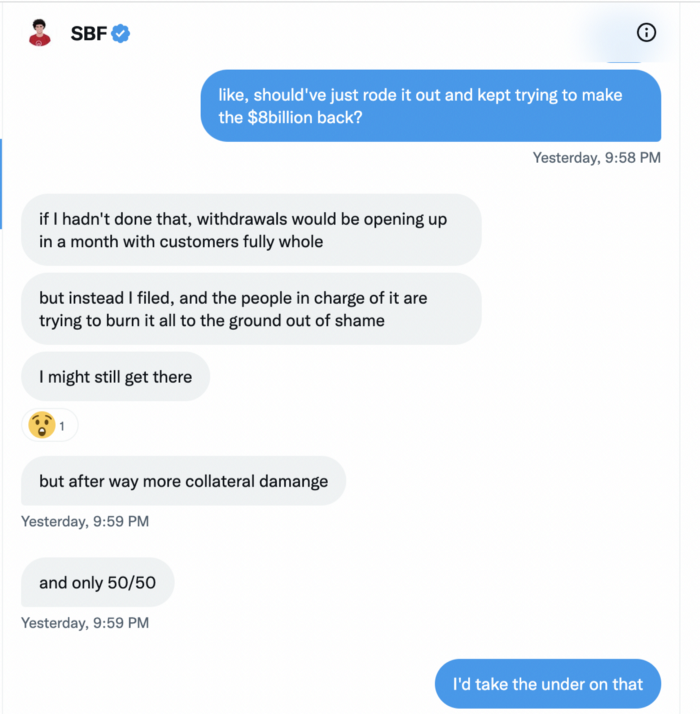
The conversation above is with the app's owner. We got on a 30-minute call where I shared how I plan to get the app to be making $100K a month like I’ve done for other businesses.
Reverse Engineering $100K
Formula:
For $100K/month, we need 3,334 people to pay $30/month. 522 people pay that. We need 2,812 more paid users.
522 paid users from 1,940 installs is a 27% conversion rate. To hit $100K/month, we need 10,415 more installs. Assuming...
With a $400 daily ad spend, we average 40 installs per day. This means that if everything stays the same, it would take us 260 days (around 9 months) to get to $100K a month (MRR).
Conclusion
You must market your goods to reach your income objective (without waiting forever). Paid ads is the way to go if you hate knocking on doors or irritating friends and family (who aren’t scalable anyways).
You must also test and optimize different angles, audiences, interest groups, and creatives.

Jayden Levitt
3 years ago
Billionaire who was disgraced lost his wealth more quickly than anyone in history
If you're not genuine, you'll be revealed.
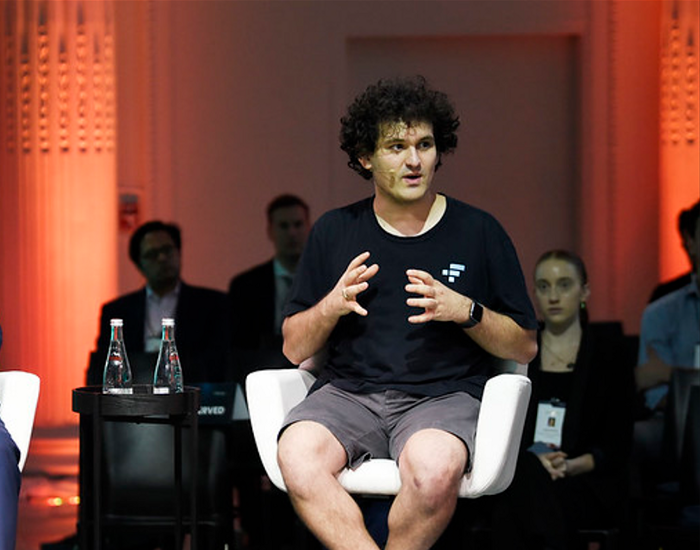
Sam Bankman-Fried (SBF) was called the Cryptocurrency Warren Buffet.
No wonder.
SBF's trading expertise, Blockchain knowledge, and ability to construct FTX attracted mainstream investors.
He had a fantastic worldview, donating much of his riches to charity.
As the onion layers peel back, it's clear he wasn't the altruistic media figure he portrayed.
SBF's mistakes were disastrous.
Customer deposits were traded and borrowed by him.
With ten other employees, he shared a $40 million mansion where they all had polyamorous relationships.
Tone-deaf and wasteful marketing expenditures, such as the $200 million spent to change the name of the Miami Heat stadium to the FTX Arena
Democrats received a $40 million campaign gift.
And now there seems to be no regret.
FTX was a 32-billion-dollar cryptocurrency exchange.
It went bankrupt practically overnight.
SBF, FTX's creator, exploited client funds to leverage trade.
FTX had $1 billion in customer withdrawal reserves against $9 billion in liabilities in sister business Alameda Research.
Bloomberg Billionaire Index says it's the largest and fastest net worth loss in history.
It gets worse.
SBF's net worth is $900 Million, however he must still finalize FTX's bankruptcy.
SBF's arrest in the Bahamas and SEC inquiry followed news that his cryptocurrency exchange had crashed, losing billions in customer deposits.
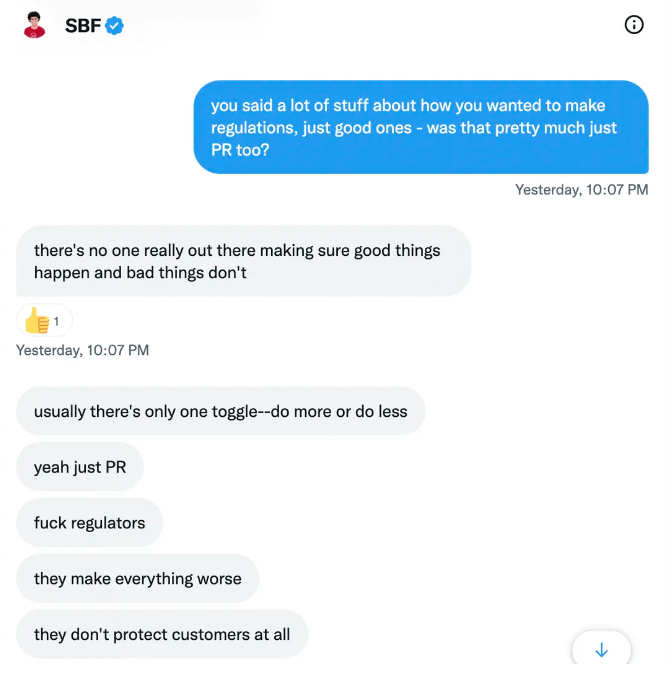
A journalist contacted him on Twitter D.M., and their exchange is telling.
His ideas are revealed.
Kelsey Piper says they didn't expect him to answer because people under investigation don't comment.
Bankman-Fried wanted to communicate, and the interaction shows he has little remorse.
SBF talks honestly about FTX gaming customers' money and insults his competition.
Reporter Kelsey Piper was outraged by what he said and felt the mistakes SBF says plague him didn't evident in the messages.
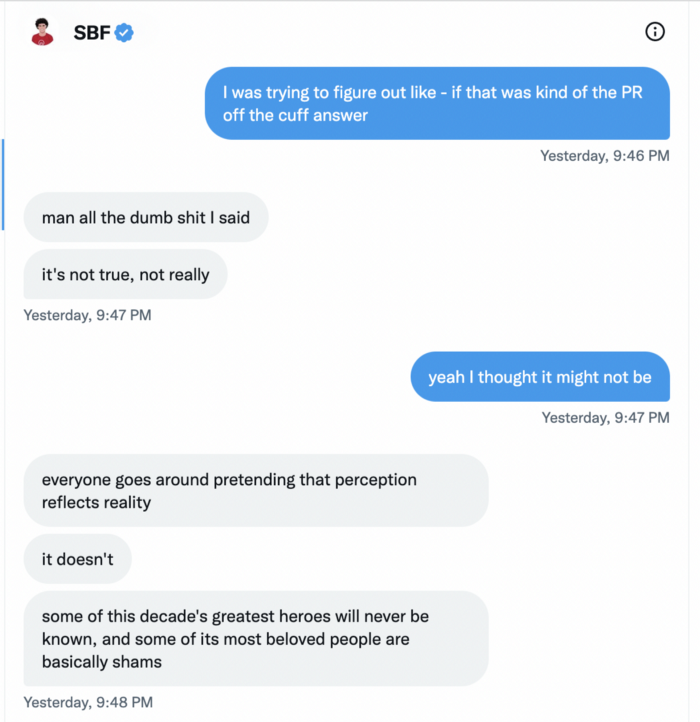
Before FTX's crash, SBF was a poster child for Cryptocurrency regulation and avoided criticizing U.S. regulators.
He tells Piper that his lobbying is just excellent PR.
It shows his genuine views and supports cynics' opinions that his attempts to win over U.S. authorities were good for his image rather than Crypto.
SBF’s responses are in Grey, and Pipers are in Blue.
It's unclear if SBF cut corners for his gain. In their Twitter exchange, Piper revisits an interview question about ethics.
SBF says, "All the foolish sh*t I said"
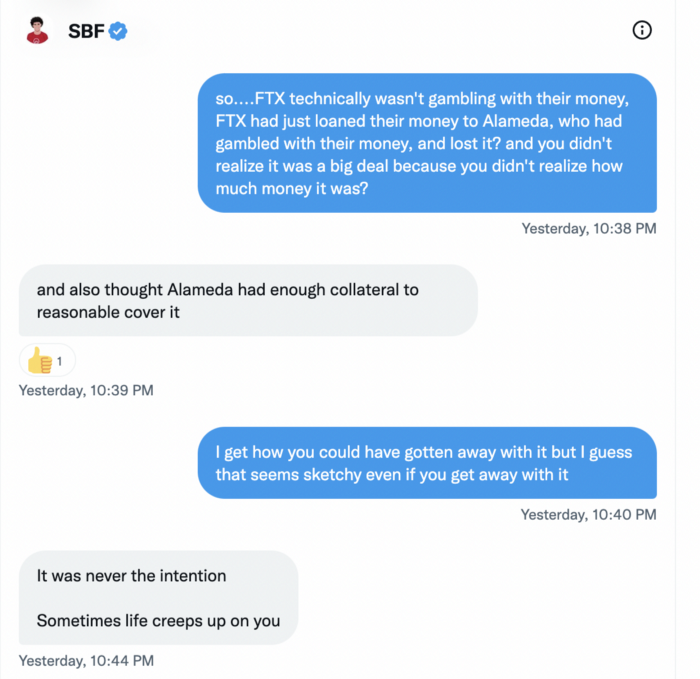
SBF claims FTX has never invested customer monies.
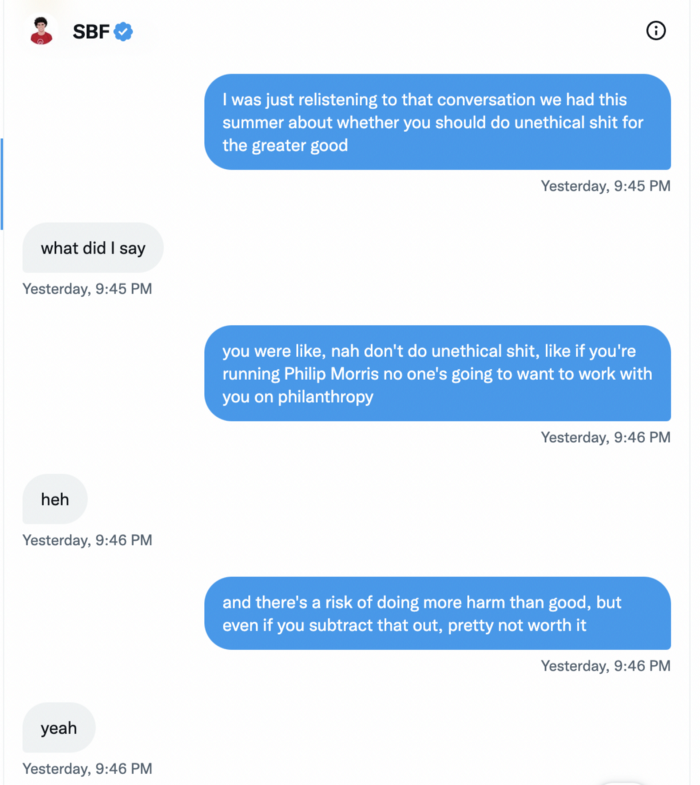
Piper challenged him on Twitter.
While he insisted FTX didn't use customer deposits, he said sibling business Alameda borrowed too much from FTX's balance sheet.
He did, basically.
When consumers tried to withdraw money, FTX was short.
SBF thought Alameda had enough money to cover FTX customers' withdrawals, but life sneaks up on you.
SBF believes most exchanges have done something similar to FTX, but they haven't had a bank run (a bunch of people all wanting to get their deposits out at the same time).
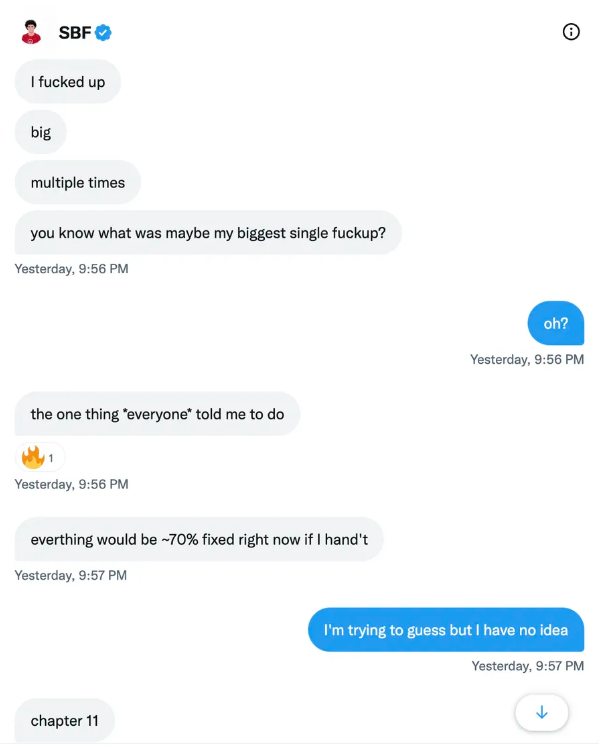
SBF believes he shouldn't have consented to the bankruptcy and kept attempting to raise more money because withdrawals would be open in a month with clients whole.
If additional money came in, he needed $8 billion to bridge the creditors' deficit, and there aren't many corporations with $8 billion to spare.
Once clients feel protected, they will continue to leave their assets on the exchange, according to one idea.
Kevin OLeary, a world-renowned hedge fund manager, says not all investors will walk through the open gate once the company is safe, therefore the $8 Billion wasn't needed immediately.
SBF claims the bankruptcy was his biggest error because he could have accumulated more capital.
Final Reflections
Sam Bankman-Fried, 30, became the world's youngest billionaire in four years.
Never listen to what people say about investing; watch what they do.
SBF is a trader who gets wrecked occasionally.
Ten first-time entrepreneurs ran FTX, screwing each other with no risk management.
It prevents opposing or challenging perspectives and echo chamber highs.
Twitter D.M. conversation with a journalist is the final nail.
He lacks an experienced crew.
This event will surely speed up much-needed regulation.
It's also prompted cryptocurrency exchanges to offer proof of reserves to calm customers.

Thomas Tcheudjio
3 years ago
If you don't crush these 3 metrics, skip the Series A.
I recently wrote about getting VCs excited about Marketplace start-ups. SaaS founders became envious!
Understanding how people wire tens of millions is the only Series A hack I recommend.
Few people understand the intellectual process behind investing.
VC is risk management.
Series A-focused VCs must cover two risks.
1. Market risk
You need a large market to cross a threshold beyond which you can build defensibilities. Series A VCs underwrite market risk.
They must see you have reached product-market fit (PMF) in a large total addressable market (TAM).
2. Execution risk
When evaluating your growth engine's blitzscaling ability, execution risk arises.
When investors remove operational uncertainty, they profit.
Series A VCs like businesses with derisked revenue streams. Don't raise unless you have a predictable model, pipeline, and growth.
Please beat these 3 metrics before Series A:
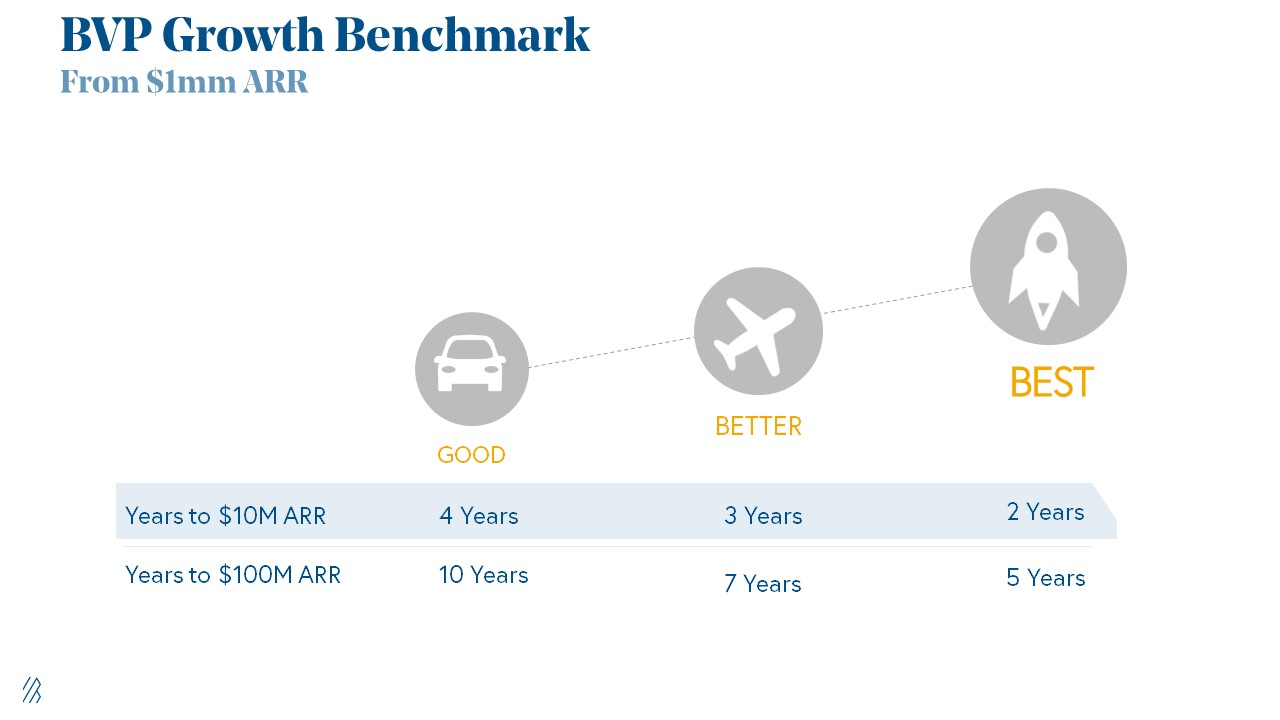
Achieve $1.5m ARR in 12-24 months (Market risk)
Above 100% Net Dollar Retention. (Market danger)
Lead Velocity Rate supporting $10m ARR in 2–4 years (Execution risk)
Hit the 3 and you'll raise $10M in 4 months. Discussing 2/3 may take 6–7 months.
If none, don't bother raising and focus on becoming a capital-efficient business (Topics for other posts).
Let's examine these 3 metrics for the brave ones.
1. Lead Velocity Rate supporting €$10m ARR in 2 to 4 years
Last because it's the least discussed. LVR is the most reliable data when evaluating a growth engine, in my opinion.
SaaS allows you to see the future.
Monthly Sales and Sales Pipelines, two predictive KPIs, have poor data quality. Both are lagging indicators, and minor changes can cause huge modeling differences.
Analysts and Associates will trash your forecasts if they're based only on Monthly Sales and Sales Pipeline.
LVR, defined as month-over-month growth in qualified leads, is rock-solid. There's no lag. You can See The Future if you use Qualified Leads and a consistent formula and process to qualify them.
With this metric in your hand, scaling your company turns into an execution play on which VCs are able to perform calculations risk.
2. Above-100% Net Dollar Retention.
Net Dollar Retention is a better-known SaaS health metric than LVR.
Net Dollar Retention measures a SaaS company's ability to retain and upsell customers. Ask what $1 of net new customer spend will be worth in years n+1, n+2, etc.
Depending on the business model, SaaS businesses can increase their share of customers' wallets by increasing users, selling them more products in SaaS-enabled marketplaces, other add-ons, and renewing them at higher price tiers.
If a SaaS company's annualized Net Dollar Retention is less than 75%, there's a problem with the business.
Slack's ARR chart (below) shows how powerful Net Retention is. Layer chart shows how existing customer revenue grows. Slack's S1 shows 171% Net Dollar Retention for 2017–2019.

Slack S-1
3. $1.5m ARR in the last 12-24 months.
According to Point 9, $0.5m-4m in ARR is needed to raise a $5–12m Series A round.
Target at least what you raised in Pre-Seed/Seed. If you've raised $1.5m since launch, don't raise before $1.5m ARR.
Capital efficiency has returned since Covid19. After raising $2m since inception, it's harder to raise $1m in ARR.

P9's 2016-2021 SaaS Funding Napkin
In summary, less than 1% of companies VCs meet get funded. These metrics can help you win.
If there’s demand for it, I’ll do one on direct-to-consumer.
Cheers!
You might also like

Vitalik
4 years ago
An approximate introduction to how zk-SNARKs are possible (part 1)
You can make a proof for the statement "I know a secret number such that if you take the word ‘cow', add the number to the end, and SHA256 hash it 100 million times, the output starts with 0x57d00485aa". The verifier can verify the proof far more quickly than it would take for them to run 100 million hashes themselves, and the proof would also not reveal what the secret number is.
In the context of blockchains, this has 2 very powerful applications: Perhaps the most powerful cryptographic technology to come out of the last decade is general-purpose succinct zero knowledge proofs, usually called zk-SNARKs ("zero knowledge succinct arguments of knowledge"). A zk-SNARK allows you to generate a proof that some computation has some particular output, in such a way that the proof can be verified extremely quickly even if the underlying computation takes a very long time to run. The "ZK" part adds an additional feature: the proof can keep some of the inputs to the computation hidden.
You can make a proof for the statement "I know a secret number such that if you take the word ‘cow', add the number to the end, and SHA256 hash it 100 million times, the output starts with 0x57d00485aa". The verifier can verify the proof far more quickly than it would take for them to run 100 million hashes themselves, and the proof would also not reveal what the secret number is.
In the context of blockchains, this has two very powerful applications:
- Scalability: if a block takes a long time to verify, one person can verify it and generate a proof, and everyone else can just quickly verify the proof instead
- Privacy: you can prove that you have the right to transfer some asset (you received it, and you didn't already transfer it) without revealing the link to which asset you received. This ensures security without unduly leaking information about who is transacting with whom to the public.
But zk-SNARKs are quite complex; indeed, as recently as in 2014-17 they were still frequently called "moon math". The good news is that since then, the protocols have become simpler and our understanding of them has become much better. This post will try to explain how ZK-SNARKs work, in a way that should be understandable to someone with a medium level of understanding of mathematics.
Why ZK-SNARKs "should" be hard
Let us take the example that we started with: we have a number (we can encode "cow" followed by the secret input as an integer), we take the SHA256 hash of that number, then we do that again another 99,999,999 times, we get the output, and we check what its starting digits are. This is a huge computation.
A "succinct" proof is one where both the size of the proof and the time required to verify it grow much more slowly than the computation to be verified. If we want a "succinct" proof, we cannot require the verifier to do some work per round of hashing (because then the verification time would be proportional to the computation). Instead, the verifier must somehow check the whole computation without peeking into each individual piece of the computation.
One natural technique is random sampling: how about we just have the verifier peek into the computation in 500 different places, check that those parts are correct, and if all 500 checks pass then assume that the rest of the computation must with high probability be fine, too?
Such a procedure could even be turned into a non-interactive proof using the Fiat-Shamir heuristic: the prover computes a Merkle root of the computation, uses the Merkle root to pseudorandomly choose 500 indices, and provides the 500 corresponding Merkle branches of the data. The key idea is that the prover does not know which branches they will need to reveal until they have already "committed to" the data. If a malicious prover tries to fudge the data after learning which indices are going to be checked, that would change the Merkle root, which would result in a new set of random indices, which would require fudging the data again... trapping the malicious prover in an endless cycle.
But unfortunately there is a fatal flaw in naively applying random sampling to spot-check a computation in this way: computation is inherently fragile. If a malicious prover flips one bit somewhere in the middle of a computation, they can make it give a completely different result, and a random sampling verifier would almost never find out.
It only takes one deliberately inserted error, that a random check would almost never catch, to make a computation give a completely incorrect result.
If tasked with the problem of coming up with a zk-SNARK protocol, many people would make their way to this point and then get stuck and give up. How can a verifier possibly check every single piece of the computation, without looking at each piece of the computation individually? There is a clever solution.
see part 2

Enrique Dans
3 years ago
When we want to return anything, why on earth do stores still require a receipt?
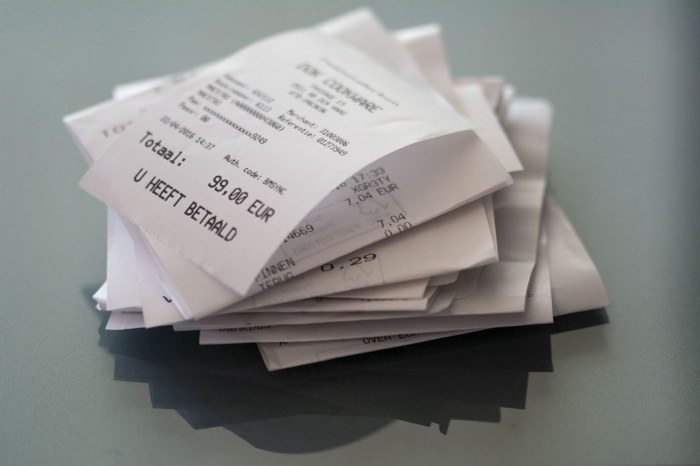
A friend told me of an incident she found particularly irritating: a retailer where she is a frequent client, with an account and loyalty card, asked for the item's receipt.
We all know that stores collect every bit of data they can on us, including our socio-demographic profile, address, shopping habits, and everything we've ever bought, so why would they need a fading receipt? Who knows? That their consumers try to pass off other goods? It's easy to verify past transactions to see when the item was purchased.
That's it. Why require receipts? Companies send us incentives, discounts, and other marketing, yet when we need something, we have to prove we're not cheating.
Why require us to preserve data and documents when our governments and governmental institutions already have them? Why do I need to carry documents like my driver's license if the authorities can check if I have one and what state it's in once I prove my identity?
We shouldn't be required to give someone data or documents they already have. The days of waiting up with our paperwork for a stern official to inform us something is missing are over.
How can retailers still ask if you have a receipt if we've made our slow, bureaucratic, and all-powerful government sensible? Then what? The shop may not accept your return (which has a two-year window, longer than most purchase tickets last) or they may just let you replace the item.
Isn't this an anachronism in the age of CRMs, customer files that know what we ate for breakfast, and loyalty programs? If government and bureaucracies have learnt to use its own files and make life easier for the consumer, why do retailers ask for a receipt?
They're adding friction to the system. They know we can obtain a refund, use our warranty, or get our money back. But if I ask for ludicrous criteria, like keeping the purchase receipt in your wallet (wallet? another anachronism, if I leave the house with only my smartphone! ), it will dissuade some individuals and tip the scales in their favor when it comes to limiting returns. Some manager will take credit for lowering returns and collect her annual bonus. Having the wrong metrics is common in management.
To slow things down, asking for a receipt is like asking us to perform a handstand and leap 20 times on one foot. You have my information, use it to send me everything, and know everything I've bought, yet when I need a two-way service, you refuse to utilize it and require that I keep it and prove it.
Refuse as customers. If retailers want our business, they should treat us well, not just when we spend money. If I come to return a product, claim its use or warranty, or be taught how to use it, I am the same person you treated wonderfully when I bought it. Remember that, and act accordingly.
A store should use my information for everything, not just what it wants. Keep my info, but don't sell me anything.

Jay Peters
3 years ago
Apple AR/VR heaset
Apple is said to have opted for a standalone AR/VR headset over a more powerful tethered model.
It has had a tumultuous history.
Apple's alleged mixed reality headset appears to be the worst-kept secret in tech, and a fresh story from The Information is jam-packed with details regarding the device's rocky development.
Apple's decision to use a separate headgear is one of the most notable aspects of the story. Apple had yet to determine whether to pursue a more powerful VR headset that would be linked with a base station or a standalone headset. According to The Information, Apple officials chose the standalone product over the version with the base station, which had a processor that later arrived as the M1 Ultra. In 2020, Bloomberg published similar information.
That decision appears to have had a long-term impact on the headset's development. "The device's many processors had already been in development for several years by the time the choice was taken, making it impossible to go back to the drawing board and construct, say, a single chip to handle all the headset's responsibilities," The Information stated. "Other difficulties, such as putting 14 cameras on the headset, have given hardware and algorithm engineers stress."
Jony Ive remained to consult on the project's design even after his official departure from Apple, according to the story. Ive "prefers" a wearable battery, such as that offered by Magic Leap. Other prototypes, according to The Information, placed the battery in the headset's headband, and it's unknown which will be used in the final design.
The headset was purportedly shown to Apple's board of directors last week, indicating that a public unveiling is imminent. However, it is possible that it will not be introduced until later this year, and it may not hit shop shelves until 2023, so we may have to wait a bit to try it.
For further down the line, Apple is working on a pair of AR spectacles that appear like Ray-Ban wayfarer sunglasses, but according to The Information, they're "still several years away from release." (I'm interested to see how they compare to Meta and Ray-Bans' true wayfarer-style glasses.)