

More on Entrepreneurship/Creators

Grace Huang
3 years ago
I sold 100 copies of my book when I had anticipated selling none.
After a decade in large tech, I know how software engineers were interviewed. I've seen outstanding engineers fail interviews because their responses were too vague.
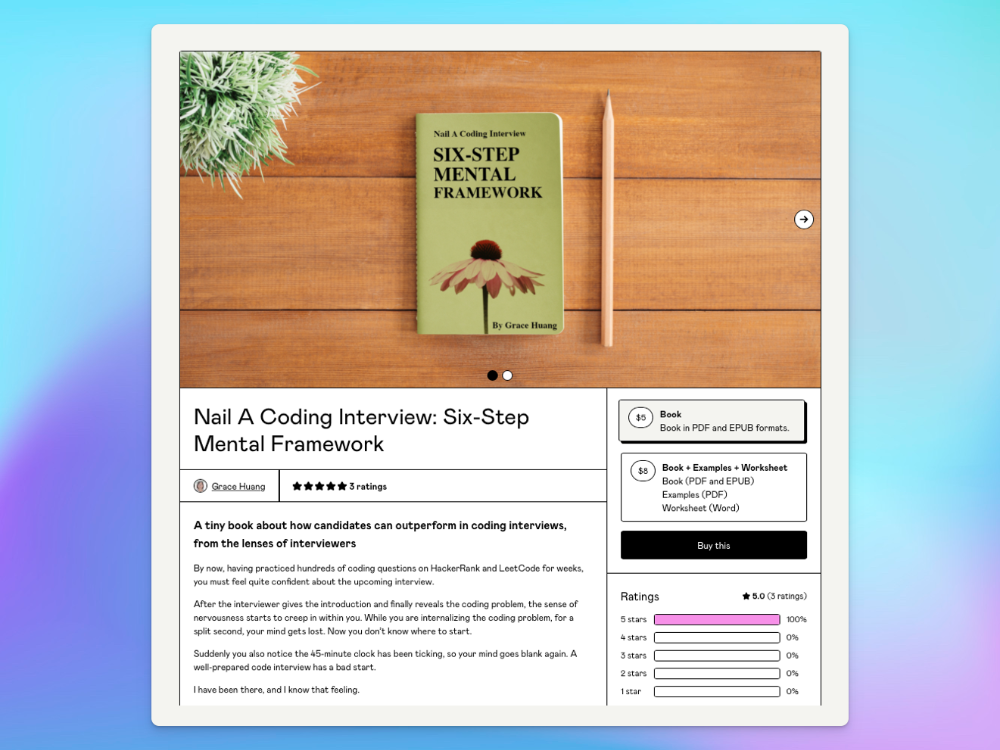
So I wrote Nail A Coding Interview: Six-Step Mental Framework. Give candidates a mental framework for coding questions; help organizations better prepare candidates so they can calibrate traits.
Recently, I sold more than 100 books, something I never expected.
In this essay, I'll describe my publication journey, which included self-doubt and little triumphs. I hope this helps if you want to publish.
It was originally a Medium post.
How did I know to develop a coding interview book? Years ago, I posted on Medium.
Six steps to ace a coding interview Inhale. blog.devgenius.io
This story got a lot of attention and still gets a lot of daily traffic. It indicates this domain's value.
Converted the Medium article into an ebook
The Medium post contains strong bullet points, but it is missing the “flesh”. How to use these strategies in coding interviews, for example. I filled in the blanks and made a book.
I made the book cover for free. It's tidy.
Shared the article with my close friends on my social network WeChat.
I shared the book on Wechat's Friend Circle (朋友圈) after publishing it on Gumroad. Many friends enjoyed my post. It definitely triggered endorphins.
In Friend Circle, I presented a 100% off voucher. No one downloaded the book. Endorphins made my heart sink.
Several days later, my Apple Watch received a Gumroad notification. A friend downloaded it. I majored in finance, he subsequently said. My brother-in-law can get it? He downloaded it to cheer me up.
I liked him, but was disappointed that he didn't read it.
The Tipping Point: Reddit's Free Giving
I trusted the book. It's based on years of interviewing. I felt it might help job-hunting college students. If nobody wants it, it can still have value.
I posted the book's link on /r/leetcode. I told them to DM me for a free promo code.
Momentum shifted everything. Gumroad notifications kept coming when I was out with family. Following orders.
As promised, I sent DMs a promo code. Some consumers ordered without asking for a promo code. Some readers finished the book and posted reviews.
My book was finally on track.
A 5-Star Review, plus More
A reader afterwards DMed me and inquired if I had another book on system design interviewing. I said that was a good idea, but I didn't have one. If you write one, I'll be your first reader.
Later, I asked for a book review. Yes, but how? That's when I learned readers' reviews weren't easy. I built up an email pipeline to solicit customer reviews. Since then, I've gained credibility through ratings.
Learnings
I wouldn't have gotten 100 if I gave up when none of my pals downloaded. Here are some lessons.
Your friends are your allies, but they are not your clients.
Be present where your clients are
Request ratings and testimonials
gain credibility gradually
I did it, so can you. Follow me on Twitter @imgracehuang for my publishing and entrepreneurship adventure.

Pat Vieljeux
3 years ago
Your entrepreneurial experience can either be a beautiful adventure or a living hell with just one decision.
Choose.
DNA makes us distinct.
We act alike. Most people follow the same road, ignoring differences. We remain quiet about our uniqueness for fear of exclusion (family, social background, religion). We live a more or less imposed life.
Off the beaten path, we stand out from the others. We obey without realizing we're sewing a shroud. We're told to do as everyone else and spend 40 years dreaming of a golden retirement and regretting not living.
“One of the greatest regrets in life is being what others would want you to be, rather than being yourself.” - Shannon L. Alder
Others dare. Again, few are creative; most follow the example of those who establish a business for the sake of entrepreneurship. To live.
They pick a potential market and model their MVP on an existing solution. Most mimic others, alter a few things, appear to be original, and end up with bland products, adding to an already crowded market.
SaaS, PaaS, etc. followed suit. It's reduced pricing, profitability, and product lifespan.
As competitors become more aggressive, their profitability diminishes, making life horrible for them and their employees. They fail to innovate, cut costs, and close their company.
Few of them look happy and fulfilled.
How did they do it?
The answer is unsettlingly simple.
They are themselves.
They start their company, propelled at first by a passion or maybe a calling.
Then, at their own pace, they create it with the intention of resolving a dilemma.
They assess what others are doing and consider how they might improve it.
In contrast to them, they respond to it in their own way by adding a unique personal touch. Therefore, it is obvious.
Originals, like their DNA, can't be copied. Or if they are, they're poorly printed. Originals are unmatched. Artist-like. True collectors only buy Picasso paintings by the master, not forgeries, no matter how good.
Imaginative people are constantly ahead. Copycats fall behind unless they innovate. They watch their competition continuously. Their solution or product isn't sexy. They hope to cash in on their copied product by flooding the market.
They're mostly pirates. They're short-sighted, unlike creators.
Creators see further ahead and have no rivals. They use copiers to confirm a necessity. To maintain their individuality, creators avoid copying others. They find copying boring. It's boring. They oppose plagiarism.
It's thrilling and inspiring.
It will also make them more able to withstand their opponents' tension. Not to mention roadblocks. For creators, impediments are games.
Others fear it. They race against the clock and fear threats that could interrupt their momentum since they lack inventiveness and their product has a short life cycle.
Creators have time on their side. They're dedicated. Clearly. Passionate booksellers will have their own bookstore. Their passion shows in their book choices. Only the ones they love.
The copier wants to display as many as possible, including mediocre authors, and will cut costs. All this to dominate the market. They're digging their own grave.
The bookseller is just one example. I could give you tons of them.
Closing remarks
Entrepreneurs might follow others or be themselves. They risk exhaustion trying to predict what their followers will do.
It's true.
Life offers choices.
Being oneself or doing as others do, with the possibility of regretting not expressing our uniqueness and not having lived.
“Be yourself; everyone else is already taken”. Oscar Wilde
The choice is yours.

ANTHONY P.
3 years ago
Startups are difficult. Streamlining the procedure for creating the following unicorn.
New ventures are exciting. It's fun to imagine yourself rich, successful, and famous (if that's your thing). How you'll help others and make your family proud. This excitement can pull you forward for years, even when you intuitively realize that the path you're on may not lead to your desired success.
Know when to change course. Switching course can mean pivoting or changing direction.
In this not-so-short blog, I'll describe the journey of building your dream. And how the journey might look when you think you're building your dream, but fall short of that vision. Both can feel similar in the beginning, but there are subtle differences.
Let’s dive in.
How an exciting journey to a dead end looks and feels.
You want to help many people. You're business-minded, creative, and ambitious. You jump into entrepreneurship. You're excited, free, and in control.
I'll use tech as an example because that's what I know best, but this applies to any entrepreneurial endeavor.
So you start learning the basics of your field, say coding/software development. You read books, take courses, and may even join a bootcamp. You start practicing, and the journey begins. Once you reach a certain level of skill (which can take months, usually 12-24), you gain the confidence to speak with others in the field and find common ground. You might attract a co-founder this way with time. You and this person embark on a journey (Tip: the idea you start with is rarely the idea you end with).
Amateur mistake #1: You spend months building a product before speaking to customers.
Building something pulls you forward blindly. You make mistakes, avoid customers, and build with your co-founder or small team in the dark for months, usually 6-12 months.
You're excited when the product launches. We'll be billionaires! The market won't believe it. This excites you and the team. Launch.
….
Nothing happens.
Some people may sign up out of pity, only to never use the product or service again.
You and the team are confused, discouraged and in denial. They don't get what we've built yet. We need to market it better, we need to talk to more investors, someone will understand our vision.
This is a hopeless path, and your denial could last another 6 months. If you're lucky, while talking to consumers and investors (which you should have done from the start), someone who has been there before would pity you and give you an idea to pivot into that can create income.
Suppose you get this idea and pivot your business. Again, you've just pivoted into something limited by what you've already built. It may be a revenue-generating idea, but it's rarely new. Now you're playing catch-up, doing something others are doing but you can do better. (Tip #2: Don't be late.) Your chances of winning are slim, and you'll likely never catch up.
You're finally seeing revenue and feel successful. You can compete, but if you're not a first mover, you won't earn enough over time. You'll get by or work harder than ever to earn what a skilled trade could provide. You didn't go into business to stress out and make $100,000 or $200,000 a year. When you can make the same amount by becoming a great software developer, electrician, etc.
You become stuck. Either your firm continues this way for years until you realize there isn't enough growth to recruit a strong team and remove yourself from day-to-day operations due to competition. Or a catastrophic economic event forces you to admit that what you were building wasn't new and unique and wouldn't get you where you wanted to be.
This realization could take 6-10 years. No kidding.
The good news is, you’ve learned a lot along the way and this information can be used towards your next venture (if you have the energy).
Key Lesson: Don’t build something if you aren’t one of the first in the space building it just for the sake of building something.
-
Let's discuss what it's like to build something that can make your dream come true.
Case 2: Building something the market loves is difficult but rewarding.
It starts with a problem that hasn't been adequately solved for a long time but is now solvable due to technology. Or a new problem due to a change in how things are done.
Let's examine each example.
Example #1: Mass communication. The problem is now solvable due to some technological breakthrough.
Twitter — One of the first web 2 companies that became successful with the rise of smart mobile computing.
People can share their real-time activities via mobile device with friends, family, and strangers. Web 2 and smartphones made it easy and fun.
Example #2: A new problem has emerged due to some change in the way things are conducted.
Zoom- A web-conferencing company that reached massive success due to the movement towards “work from home”, remote/hybrid work forces.
Online web conferencing allows for face-to-face communication.
-
These two examples show how to build a unicorn-type company. It's a mix of solving the right problem at the right time, either through a technological breakthrough that opens up new opportunities or by fundamentally changing how people do things.
Let's find these opportunities.
Start by examining problems, such as how the world has changed and how we can help it adapt. It can also be both. Start team brainstorming. Research technologies, current world-trends, use common sense, and make a list. Then, choose the top 3 that you're most excited about and seem most workable based on your skillsets, values, and passion.
Once you have this list, create the simplest MVP you can and test it with customers. The prototype can be as simple as a picture or diagram of user flow and end-user value. No coding required. Market-test. Twitter's version 1 was simple. It was a web form that asked, "What are you doing?" Then publish it from your phone. A global status update, wherever you are. Currently, this company has a $50 billion market cap.
Here's their MVP screenshot.
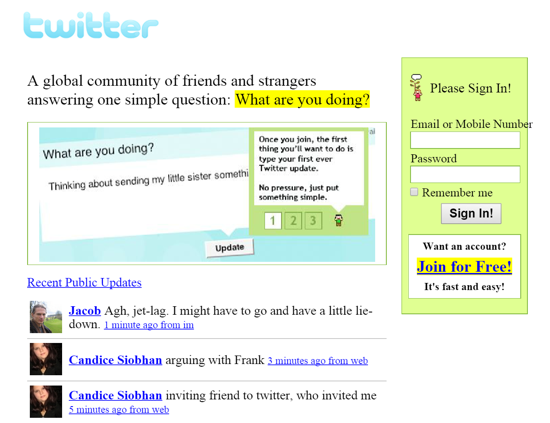
Small things grow. Tiny. Simplify.
Remember Frequency and Value when brainstorming. Your product is high frequency (Twitter, Instagram, Snapchat, TikTok) or high value (Airbnb for renting travel accommodations), or both (Gmail).
Once you've identified product ideas that meet the above criteria, they're simple, have a high frequency of use, or provide deep value. You then bring it to market in the simplest, most cost-effective way. You can sell a half-working prototype with imagination and sales skills. You need just enough of a prototype to convey your vision to a user or customer.
With this, you can approach real people. This will do one of three things: give you a green light to continue on your vision as is, show you that there is no opportunity and people won't use it, or point you in a direction that is a blend of what you've come up with and what the customer / user really wants, and you update the prototype and go back to the maze. Repeat until you have enough yeses and conviction to build an MVP.
You might also like

Kyle Planck
3 years ago
The chronicles of monkeypox.
or, how I spread monkeypox and got it myself.
This story contains nsfw (not safe for wife) stuff and shouldn't be read if you're under 18 or think I'm a newborn angel. After the opening, it's broken into three sections: a chronological explanation of my disease course, my ideas, and what I plan to do next.
Your journey awaits.
As early as mid-may, I was waltzing around the lab talking about monkeypox, a rare tropical disease with an inaccurate name. Monkeys are not its primary animal reservoir. It caused an outbreak among men who have sex with men across Europe, with unprecedented levels of person-to-person transmission. European health authorities speculated that the virus spread at raves and parties and was easily transferred through intimate, mainly sexual, contact. I had already read the nejm article about the first confirmed monkeypox patient in the u.s. and shared the photos on social media so people knew what to look for. The cdc information page only included 4 photographs of monkeypox lesions that looked like they were captured on a motorola razr.
I warned my ex-boyfriend about monkeypox. Monkeypox? responded.
Mom, I'm afraid about monkeypox. What's monkeypox?
My therapist is scared about monkeypox. What's monkeypox?
Was I alone? A few science gays on Twitter didn't make me feel overreacting.
This information got my gay head turning. The incubation period for the sickness is weeks. Many of my social media contacts are traveling to Europe this summer. What is pride? Travel, parties, and sex. Many people may become infected before attending these activities. Monkeypox will affect the lgbtq+ community.
Being right always stinks. My young scientist brain was right, though. Someone who saw this coming is one of the early victims. I'll talk about my feelings publicly, and trust me, I have many concerning what's occurring.
Part 1 is the specifics.
Wednesday nights are never smart but always entertaining. I didn't wake up until noon on june 23 and saw gay twitter blazing. Without warning, the nyc department of health announced a pop-up monkeypox immunization station in chelsea. Some days would be 11am-7pm. Walk-ins were welcome, however appointments were preferred. I tried to arrange an appointment after rubbing my eyes, but they were all taken. I got out of bed, washed my face, brushed my teeth, and put on short shorts because I wanted to get a walk-in dose and show off my legs. I got a 20-oz. cold brew on the way to the train and texted a chelsea-based acquaintance for help.
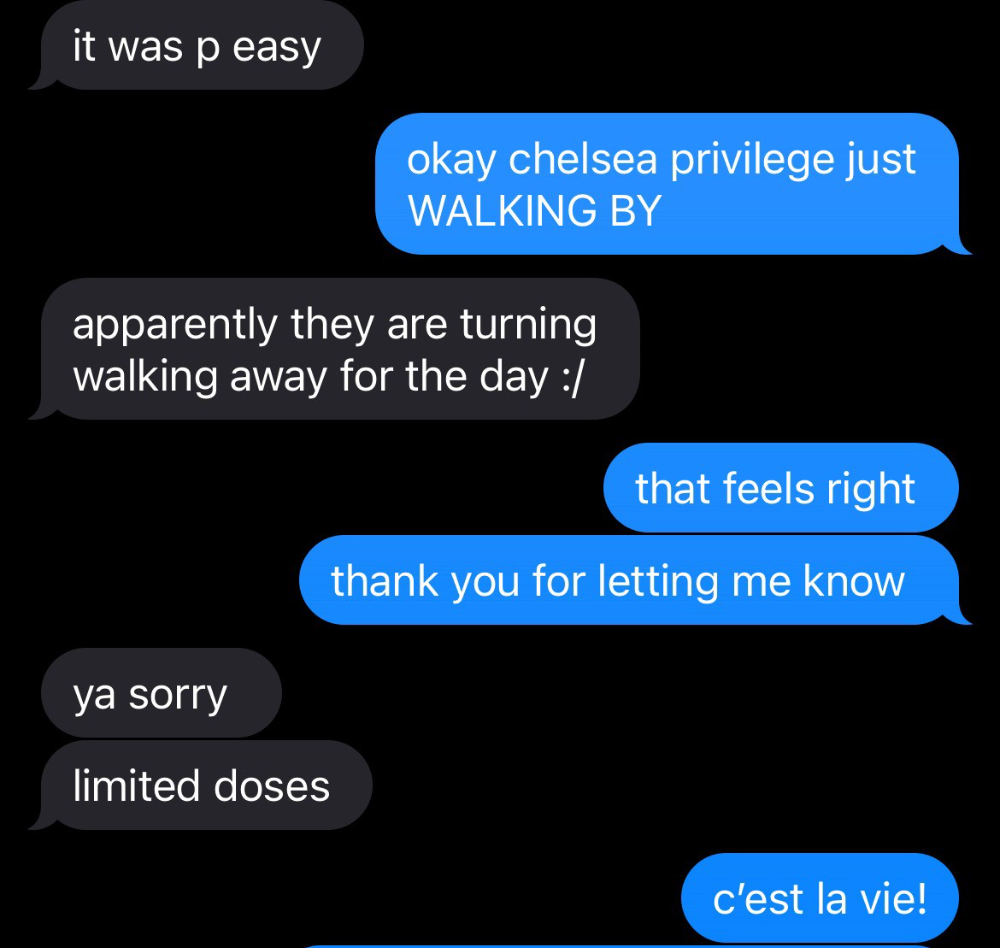
Clinic closed at 2pm. No more doses. Hundreds queued up. The government initially gave them only 1,000 dosages. For a city with 500,000 LGBT people, c'mon. What more could I do? I was upset by how things were handled. The evidence speaks for itself.
I decided to seek an appointment when additional doses were available and continued my weekend. I was celebrating nyc pride with pals. Fun! sex! *
On tuesday after that, I felt a little burn. This wasn't surprising because I'd been sexually active throughout the weekend, so I got a sti panel the next day. I expected to get results in a few days, take antibiotics, and move on.
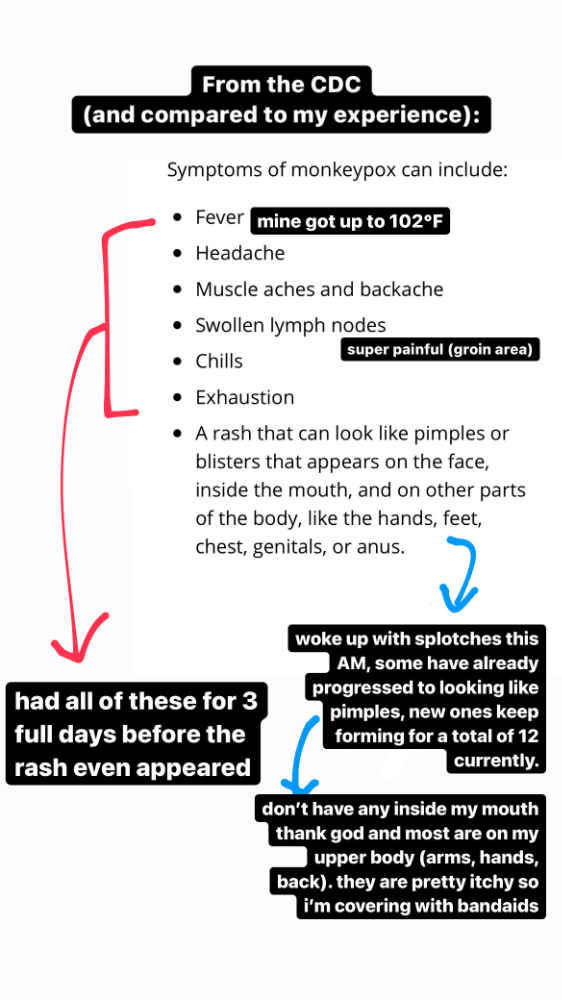
Emerging germs had other intentions. Wednesday night, I felt sore, and thursday morning, I had a blazing temperature and had sweat through my bedding. I had fever, chills, and body-wide aches and pains for three days. I reached 102 degrees. I believed I had covid over pride weekend, but I tested negative for three days straight.
STDs don't induce fevers or other systemic symptoms. If lymphogranuloma venereum advances, it can cause flu-like symptoms and swollen lymph nodes. I was suspicious and desperate for answers, so I researched monkeypox on the cdc website (for healthcare professionals). Much of what I saw on screen about monkeypox prodrome matched my symptoms. Multiple-day fever, headache, muscle aches, chills, tiredness, enlarged lymph nodes. Pox were lacking.
I told my doctor my concerns pre-medically. I'm occasionally annoying.
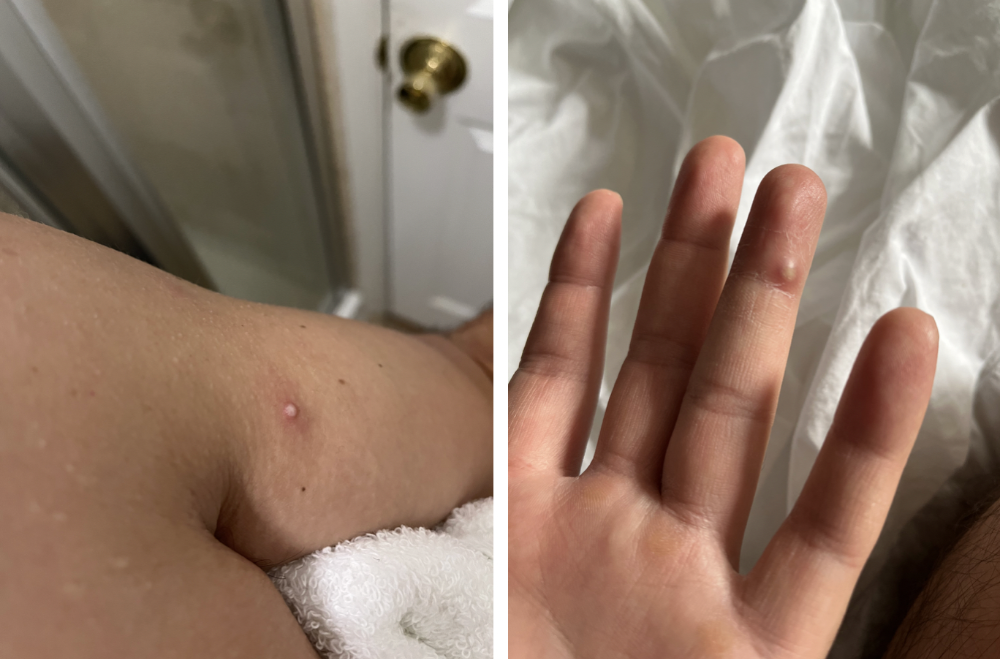
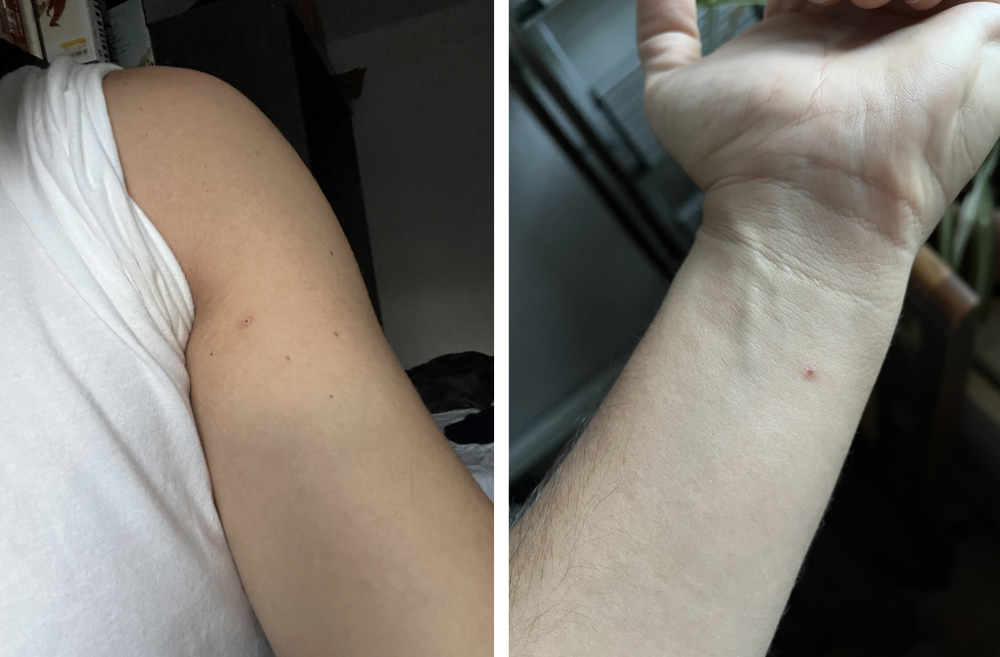
On saturday night, my fever broke and I felt better. Still burning, I was optimistic till sunday, when I woke up with five red splotches on my arms and fingertips.
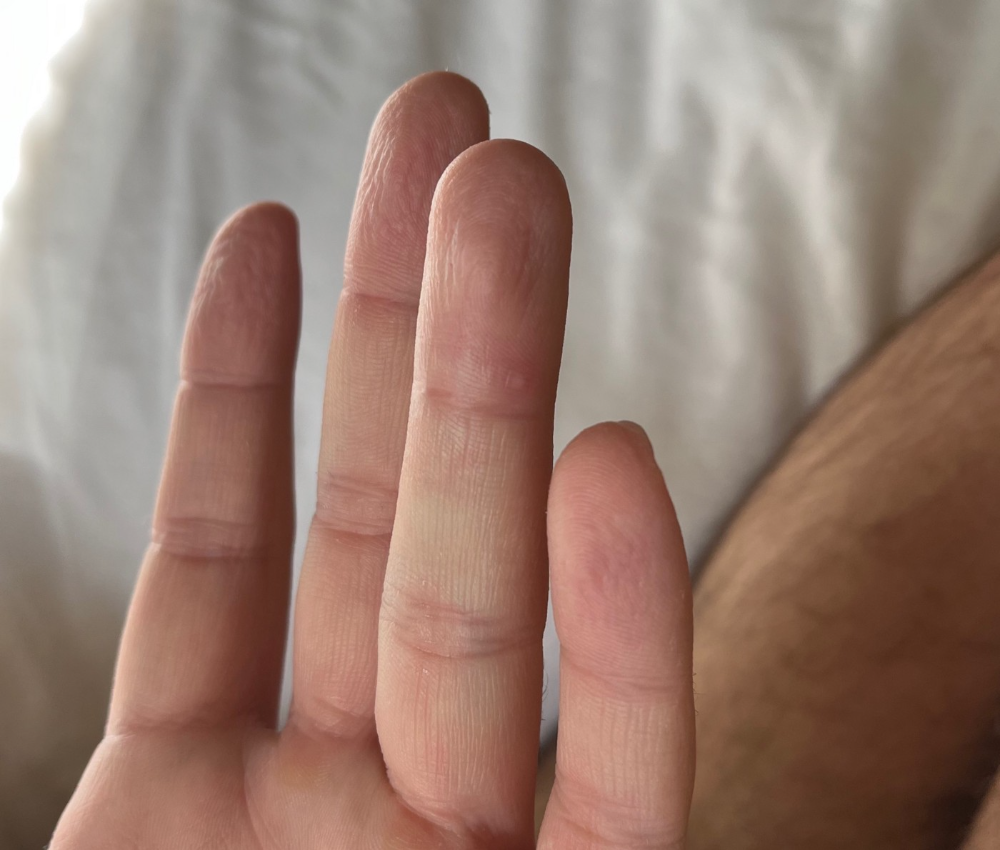
As spots formed, burning became pain. I observed as spots developed on my body throughout the day. I had more than a dozen by the end of the day, and the early spots were pustular. I had monkeypox, as feared.
Fourth of July weekend limited my options. I'm well-connected in my school's infectious disease academic community, so I texted a coworker for advice. He agreed it was likely monkeypox and scheduled me for testing on tuesday.
nyc health could only perform 10 monkeypox tests every day. Before doctors could take swabs and send them in, each test had to be approved by the department. Some commercial labs can now perform monkeypox testing, but the backlog is huge. I still don't have a positive orthopoxvirus test five days after my test. *My 12-day-old case may not be included in the official monkeypox tally. This outbreak is far wider than we first thought, therefore I'm attempting to spread the information and help contain it.
*Update, 7/11: I have orthopoxvirus.
I spent all day in the bathtub because of the agony. Warm lavender epsom salts helped me feel better. I can't stand lavender anymore. I brought my laptop into the bathroom and viewed everything everywhere at once (2022). If my ex and I hadn't recently broken up, I wouldn't have monkeypox. All of these things made me cry, and I sat in the bathtub on the 4th of July sobbing. I thought, Is this it? I felt like Bridesmaids' Kristen Wiig (2011). I'm a flop. From here, things can only improve.
Later that night, I wore a mask and went to my roof to see the fireworks. Even though I don't like fireworks, there was something wonderful about them this year: the colors, how they illuminated the black surfaces around me, and their transient beauty. Joyful moments rarely linger long in our life. We must enjoy them now.

Several roofs away, my neighbors gathered. Happy 4th! I heard a woman yell. Why is this godforsaken country so happy? Instead of being rude, I replied. I didn't tell them I had monkeypox. I thought that would kill the mood.
By the time I went to the hospital the next day to get my lesions swabbed, wearing long sleeves, pants, and a mask, they looked like this:
I had 30 lesions on my arms, hands, stomach, back, legs, buttcheeks, face, scalp, and right eyebrow. I had some in my mouth, gums, and throat. Current medical thought is that lesions on mucous membranes cause discomfort in sensitive places. Internal lesions are a new feature of this outbreak of monkeypox. Despite being unattractive, the other sores weren't unpleasant or bothersome.
I had a bacterial sti with the pox. Who knows if that would've created symptoms (often it doesn't), but different infections can happen at once. My care team remembered that having a sti doesn't exclude out monkeypox. doxycycline rocks!
The coworker who introduced me to testing also offered me his home. We share a restroom, and monkeypox can be spread through surfaces. (Being a dna virus gives it environmental hardiness that rna viruses like sars-cov-2 lack.) I disinfected our bathroom after every usage, but I was apprehensive. My friend's place has a guest room and second bathroom, so no cross-contamination. It was the ideal monkeypox isolation environment, so I accepted his offer and am writing this piece there. I don't know what I would have done without his hospitality and attention.
The next day, I started tecovirimat, or tpoxx, for 14 days. Smallpox has been eradicated worldwide since the 1980s but remains a bioterrorism concern. Tecovirimat has a unique, orthopoxvirus-specific method of action, which reduces side effects to headache and nausea. It hasn't been used in many people, therefore the cdc is encouraging patients who take it for monkeypox to track their disease and symptoms.

Tpoxx's oral absorption requires a fatty meal. The hospital ordered me to take the medication after a 600-calorie, 25-gram-fat meal every 12 hours. The coordinator joked, "Don't diet for the next two weeks." I wanted to get peanut butter delivered, but jif is recalling their supply due to salmonella. Please give pathogens a break. I got almond butter.
Tpoxx study enrollment was documented. After signing consent documents, my lesions were photographed and measured during a complete physical exam. I got bloodwork to assess my health. My medication delivery was precise; every step must be accounted for. I got a two-week supply and started taking it that night. I rewarded myself with McDonald's. I'd been hungry for a week. I was also prescribed ketorolac (aka toradol), a stronger ibuprofen, for my discomfort.
I thought tpoxx was a wonder medicine by day two of treatment. Early lesions looked like this.
however, They vanished. The three largest lesions on my back flattened and practically disappeared into my skin. Some pustular lesions were diminishing. Tpoxx+toradol has helped me sleep, focus, and feel human again. I'm down to twice-daily baths and feeling hungrier than ever in this illness. On day five of tpoxx, some of the lesions look like this:
I have a ways to go. We must believe I'll be contagious until the last of my patches scabs over, falls off, and sprouts new skin. There's no way to tell. After a week and a half of tremendous pain and psychological stress, any news is good news. I'm grateful for my slow but steady development.
Part 2 of the rant.
Being close to yet not in the medical world is interesting. It lets me know a lot about it without being persuaded by my involvement. Doctors identify and treat patients using a tool called differential diagnosis.
A doctor interviews a patient to learn about them and their symptoms. More is better. Doctors may ask, "Have you traveled recently?" sex life? Have pets? preferred streaming service? (No, really. (Hbomax is right.) After the inquisition, the doctor will complete a body exam ranging from looking in your eyes, ears, and throat to a thorough physical.
After collecting data, the doctor makes a mental (or physical) inventory of all the conceivable illnesses that could cause or explain the patient's symptoms. Differential diagnosis list. After establishing the differential, the clinician can eliminate options. The doctor will usually conduct nucleic acid tests on swab samples or bloodwork to learn more. This helps eliminate conditions from the differential or boosts a condition's likelihood. In an ideal circumstance, the doctor can eliminate all but one reason of your symptoms, leaving your formal diagnosis. Once diagnosed, treatment can begin. yay! Love medicine.
My symptoms two weeks ago did not suggest monkeypox. Fever, pains, weariness, and swollen lymph nodes are caused by several things. My scandalous symptoms weren't linked to common ones. My instance shows the importance of diversity and representation in healthcare. My doctor isn't gay, but he provides culturally sensitive care. I'd heard about monkeypox as a gay man in New York. I was hyper-aware of it and had heard of friends of friends who had contracted it the week before, even though the official case count in the US was 40. My physicians weren't concerned, but I was. How would it appear on his mental differential if it wasn't on his radar? Mental differential rhymes! I'll trademark it to prevent theft. differential!
I was in a rare position to recognize my condition and advocate for myself. I study infections. I'd spent months researching monkeypox. I work at a university where I rub shoulders with some of the country's greatest doctors. I'm a gay dude who follows nyc queer social networks online. All of these variables positioned me to think, "Maybe this is monkeypox," and to explain why.
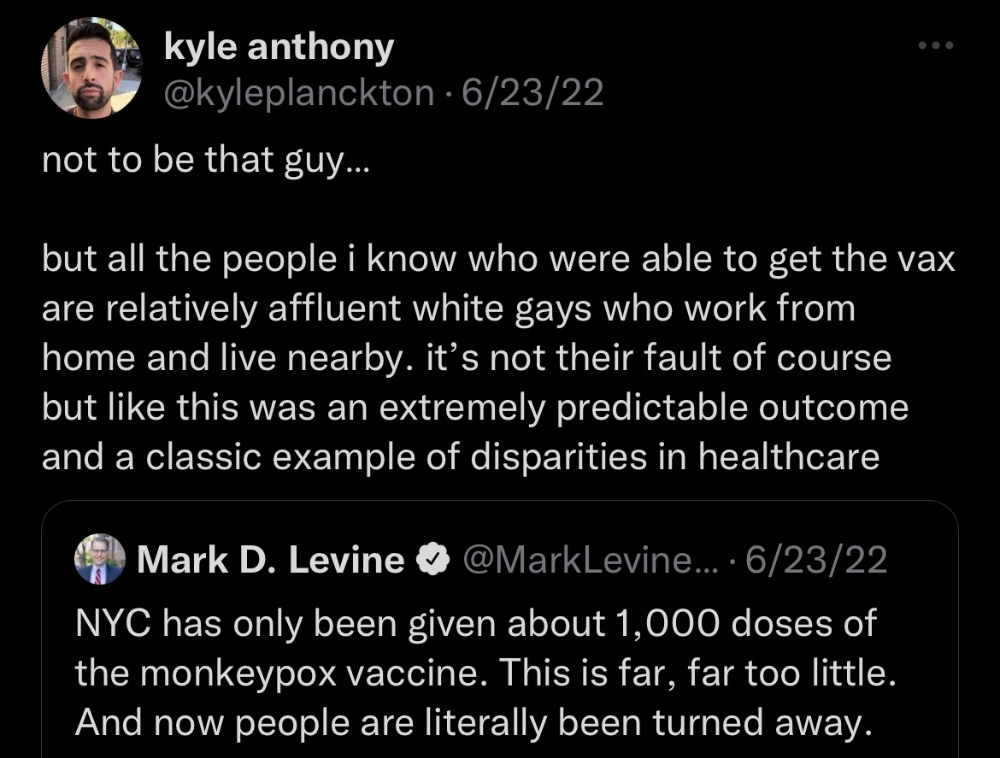
This outbreak is another example of privilege at work. The brokenness of our healthcare system is once again exposed by the inequities produced by the vaccination rollout and the existence of people like myself who can pull strings owing to their line of work. I can't cure this situation on my own, but I can be a strong voice demanding the government do a better job addressing the outbreak and giving resources and advice to everyone I can.
lgbtqia+ community members' support has always impressed me in new york. The queer community has watched out for me and supported me in ways I never dreamed were possible.
Queer individuals are there for each other when societal structures fail. People went to the internet on the first day of the vaccine rollout to share appointment information and the vaccine clinic's message. Twitter timelines were more effective than marketing campaigns. Contrary to widespread anti-vaccine sentiment, the LGBT community was eager to protect themselves. Smallpox vaccination? sure. gimme. whether I'm safe. I credit the community's sex positivity. Many people are used to talking about STDs, so there's a reduced barrier to saying, "I think I have something, you should be on the watch too," and taking steps to protect our health.
Once I got monkeypox, I posted on Twitter and Instagram. Besides fueling my main character syndrome, I felt like I wasn't alone. My dc-based friend had monkeypox within hours. He told me about his experience and gave me ideas for managing the discomfort. I can't imagine life without him.
My buddy and colleague organized my medical care and let me remain in his home. His and his husband's friendliness and attention made a world of difference in my recovery. All of my friends and family who helped me, whether by venmo, doordash, or moral support, made me feel cared about. I don't deserve the amazing people in my life.
Finally, I think of everyone who commented on my social media posts regarding my trip. Friends from all sectors of my life and all sexualities have written me well wishes and complimented me for my vulnerability, but I feel the most gravitas from fellow lgbtq+ persons. They're learning to spot. They're learning where to go ill. They're learning self-advocacy. I'm another link in our network of caretaking. I've been cared for, therefore I want to do the same. Community and knowledge are powerful.
You're probably wondering where the diatribe is. You may believe he's gushing about his loved ones, and you'd be right. I say that just because the queer community can take care of itself doesn't mean we should.
Even when caused by the same pathogen, comparing health crises is risky. Aids is unlike covid-19 or monkeypox, yet all were caused by poorly understood viruses. The lgbtq+ community has a history of self-medicating. Queer people (and their supporters) have led the charge to protect themselves throughout history when the government refused. Surreal to experience this in real time.
First, vaccination access is a government failure. The strategic national stockpile contains tens of thousands of doses of jynneos, the newest fda-approved smallpox vaccine, and millions of doses of acam2000, an older vaccine for immunocompetent populations. Despite being a monkeypox hotspot and international crossroads, new york has only received 7,000 doses of the jynneos vaccine. Vaccine appointments are booked within minutes. It's showing Hunger Games, which bothers me.
Second, I think the government failed to recognize the severity of the european monkeypox outbreak. We saw abroad reports in may, but the first vaccines weren't available until june. Why was I a 26-year-old pharmacology grad student, able to see a monkeypox problem in europe but not the u.s. public health agency? Or was there too much bureaucracy and politicking, delaying action?
Lack of testing infrastructure for a known virus with vaccinations and therapies is appalling. More testing would have helped understand the problem's breadth. Many homosexual guys, including myself, didn't behave like monkeypox was a significant threat because there were only a dozen instances across the country. Our underestimating of the issue, spurred by a story of few infections, was huge.
Public health officials' response to infectious diseases frustrates me. A wait-and-see approach to infectious diseases is unsatisfactory. Before a sick person is recognized, they've exposed and maybe contaminated numerous others. Vaccinating susceptible populations before a disease becomes entrenched prevents disease. CDC might operate this way. When it was easier, they didn't control or prevent monkeypox. We'll learn when. Sometimes I fear never. Emerging viral infections are a menace in the era of climate change and globalization, and I fear our government will repeat the same mistakes. I don't work at the cdc, thus I have no idea what they do. As a scientist, a homosexual guy, and a citizen of this country, I feel confident declaring that the cdc has not done enough about monkeypox. Will they do enough about monkeypox? The strategic national stockpile can respond to a bioterrorism disaster in 12 hours. I'm skeptical following this outbreak.
It's simple to criticize the cdc, but they're not to blame. Underfunding public health services, especially the cdc, is another way our government fails to safeguard its citizens. I may gripe about the vaccination rollout all I want, but local health departments are doing their best with limited resources. They may not have enough workers to keep up with demand and run a contact-tracing program. Since my orthopoxvirus test is still negative, the doh hasn't asked about my close contacts. By then, my illness will be two weeks old, too long to do anything productive. Not their fault. They're functioning in a broken system that's underfunded for the work it does.
*Update, 7/11: I have orthopoxvirus.
Monkeypox is slow, so i've had time to contemplate. Now that I'm better, I'm angry. furious and sad I want to help. I wish to spare others my pain. This was preventable and solvable, I hope. HOW?
Third, the duty.
Family, especially selected family, helps each other. So many people have helped me throughout this difficult time. How can I give back? I have ideas.
1. Education. I've already started doing this by writing incredibly detailed posts on Instagram about my physical sickness and my thoughts on the entire scandal. via tweets. by producing this essay. I'll keep doing it even if people start to resent me! It's crucial! On my Instagram profile (@kyleplanckton), you may discover a story highlight with links to all of my bizarre yet educational posts.
2. Resources. I've forwarded the contact information for my institution's infectious diseases clinic to several folks who will hopefully be able to get tpoxx under the expanded use policy. Through my social networks, I've learned of similar institutions. I've also shared crowdsourced resources about symptom relief and vaccine appointment availability on social media. DM me or see my Instagram highlight for more.
3. Community action. During my illness, my friends' willingness to aid me has meant the most. It was nice to know I had folks on my side. One of my pals (thanks, kenny) snagged me a mcgriddle this morning when seamless canceled my order. This scenario has me thinking about methods to help people with monkeypox isolation. A two-week isolation period is financially damaging for many hourly workers. Certain governments required paid sick leave for covid-19 to allow employees to recover and prevent spread. No comparable program exists for monkeypox, and none seems to be planned shortly.
I want to aid monkeypox patients in severe financial conditions. I'm willing to pick up and bring groceries or fund meals/expenses for sick neighbors. I've seen several GoFundMe accounts, but I wish there was a centralized mechanism to link those in need with those who can help. Please contact me if you have expertise with mutual aid organizations. I hope we can start this shortly.
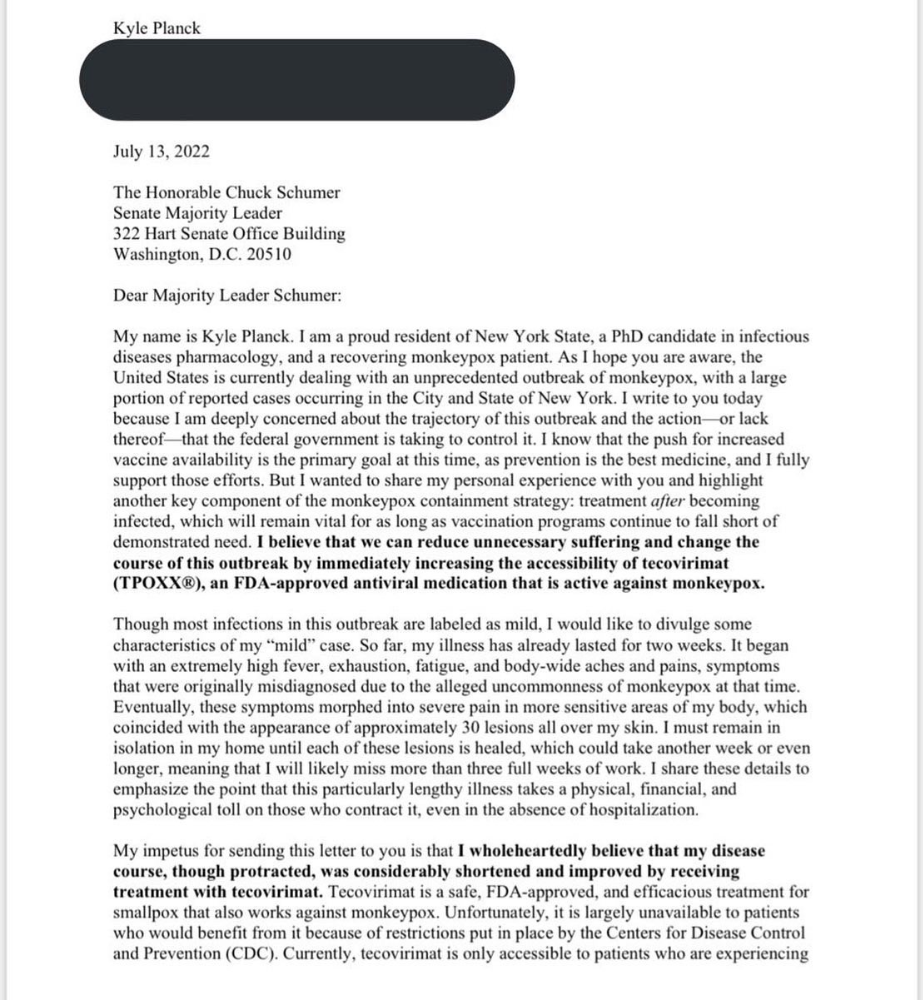
4. lobbying. Personal narratives are powerful. My narrative is only one, but I think it's compelling. Over the next day or so, i'll write to local, state, and federal officials about monkeypox. I wanted a vaccine but couldn't acquire one, and I feel tpoxx helped my disease. As a pharmacologist-in-training, I believe collecting data on a novel medicine is important, and there are ethical problems when making a drug with limited patient data broadly available. Many folks I know can't receive tpoxx due of red tape and a lack of contacts. People shouldn't have to go to an ivy league hospital to obtain the greatest care. Based on my experience and other people's tales, I believe tpoxx can drastically lessen monkeypox patients' pain and potentially curb transmission chains if administered early enough. This outbreak is manageable. It's not too late if we use all the instruments we have (diagnostic, vaccine, treatment).
*UPDATE 7/15: I submitted the following letter to Chuck Schumer and Kirsten Gillibrand. I've addressed identical letters to local, state, and federal officials, including the CDC and HHS.
I hope to join RESPND-MI, an LGBTQ+ community-led assessment of monkeypox symptoms and networks in NYC. Visit their website to learn more and give to this community-based charity.
How I got monkeypox is a mystery. I received it through a pride physical interaction, but i'm not sure which one. This outbreak will expand unless leaders act quickly. Until then, I'll keep educating and connecting people to care in my neighborhood.
Despite my misgivings, I see some optimism. Health department social media efforts are underway. During the outbreak, the CDC provided nonjudgmental suggestions for safer social and sexual activity. There's additional information regarding the disease course online, including how to request tpoxx for sufferers. These materials can help people advocate for themselves if they're sick. Importantly, homosexual guys are listening when they discuss about monkeypox online and irl. Learners They're serious.
The government has a terrible track record with lgtbq+ health issues, and they're not off to a good start this time. I hope this time will be better. If I can aid even one individual, I'll do so.
Thanks for reading, supporting me, and spreading awareness about the 2022 monkeypox outbreak. My dms are accessible if you want info, resources, queries, or to chat.
y'all well
kyle

The woman
3 years ago
The best lesson from Sundar Pichai is that success and stress don't mix.
His regular regimen teaches stress management.
In 1995, an Indian graduate visited the US. He obtained a scholarship to Stanford after graduating from IIT with a silver medal. First flight. His ticket cost a year's income. His head was full.
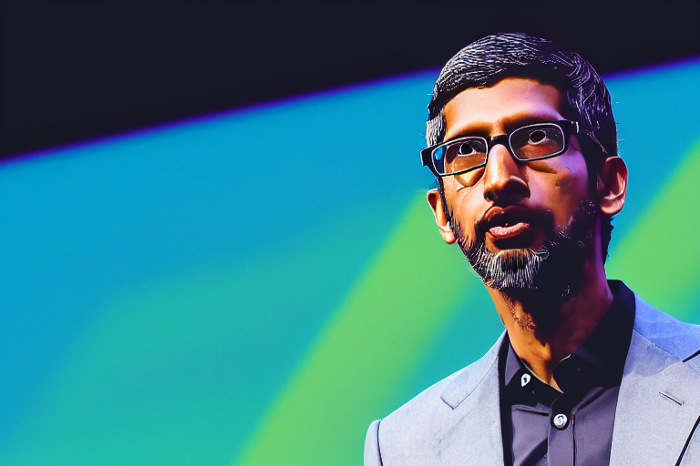
Pichai Sundararajan is his full name. He became Google's CEO and a world leader. Mr. Pichai transformed technology and inspired millions to dream big.
This article reveals his daily schedule.
Mornings
While many of us dread Mondays, Mr. Pichai uses the day to contemplate.
A typical Indian morning. He awakens between 6:30 and 7 a.m. He avoids working out in the mornings.
Mr. Pichai oversees the internet, but he reads a real newspaper every morning.
Pichai mentioned that he usually enjoys a quiet breakfast during which he reads the news to get a good sense of what’s happening in the world. Pichai often has an omelet for breakfast and reads while doing so. The native of Chennai, India, continues to enjoy his daily cup of tea, which he describes as being “very English.”
Pichai starts his day. BuzzFeed's Mat Honan called the CEO Banana Republic dad.
Overthinking in the morning is a bad idea. It's crucial to clear our brains and give ourselves time in the morning before we hit traffic.
Mr. Pichai's morning ritual shows how to stay calm. Wharton Business School found that those who start the day calmly tend to stay that way. It's worth doing regularly.
And he didn't forget his roots.
Afternoons
He has a busy work schedule, as you can imagine. Running one of the world's largest firm takes time, energy, and effort. He prioritizes his work. Monitoring corporate performance and guaranteeing worker efficiency.
Sundar Pichai spends 7-8 hours a day to improve Google. He's noted for changing the company's culture. He wants to boost employee job satisfaction and performance.
His work won him recognition within the company.
Pichai received a 96% approval rating from Glassdoor users in 2017.
Mr. Pichai stresses work satisfaction. Each day is a new canvas for him to find ways to enrich people's job and personal lives.
His work offers countless lessons. According to several profiles and press sources, the Google CEO is a savvy negotiator. Mr. Pichai's success came from his strong personality, work ethic, discipline, simplicity, and hard labor.
Evenings
His evenings are spent with family after a busy day. Sundar Pichai's professional and personal lives are balanced. Sundar Pichai is a night owl who re-energizes about 9 p.m.
However, he claims to be most productive after 10 p.m., and he thinks doing a lot of work at that time is really useful. But he ensures he sleeps for around 7–8 hours every day. He enjoys long walks with his dog and enjoys watching NSDR on YouTube. It helps him in relaxing and sleep better.
His regular routine teaches us what? Work wisely, not hard, discipline, vision, etc. His stress management is key. Leading one of the world's largest firm with 85,000 employees is scary.
The pressure to achieve may ruin a day. Overworked employees are more likely to make mistakes or be angry with coworkers, according to the Family Work Institute. They can't handle daily problems, making the house more stressful than the office.
Walking your dog, having fun with friends, and having hobbies are as vital as your office.
Blake Montgomery
3 years ago
Explaining Twitter Files
Elon Musk, Matt Taibbi, the 'Twitter Files,' and Hunter Biden's laptop: what gives?
Explaining Twitter Files
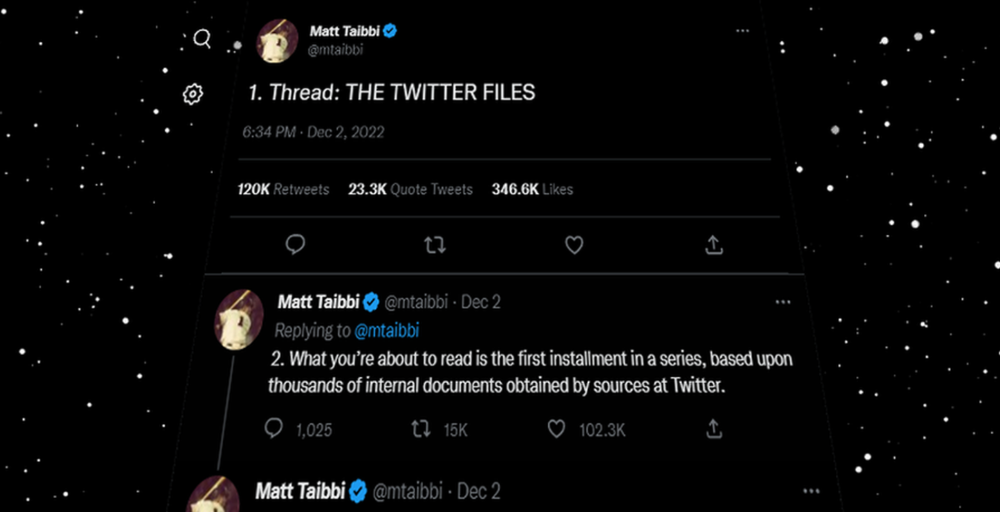
Matt Taibbi released "The Twitter Files," a batch of emails sent by Twitter executives discussing the company's decision to stop an October 2020 New York Post story online.
What's on Twitter? New York Post and Fox News call them "bombshell" documents. Or, as a Post columnist admitted, are they "not the smoking gun"? Onward!
What started this?
The New York Post published an exclusive, potentially explosive story in October 2020: Biden's Secret Emails: Ukrainian executive thanks Hunter Biden for'meeting' veep dad. The story purported to report the contents of a laptop brought to the tabloid by a Delaware computer repair shop owner who said it belonged to President Biden's second son, Hunter Biden. Emails and files on the laptop allegedly showed how Hunter peddled influence with Ukranian businessmen and included a "raunchy 12-minute video" of Hunter smoking crack and having sex.
Twitter banned links to the Post story after it was published, calling it "hacked material." The Post's Twitter account was suspended for multiple days.
Why? Yoel Roth, Twitter's former head of trust and safety, said the company couldn't verify the story, implying they didn't trust the Post.
Twitter's stated purpose rarely includes verifying news stories. This seemed like intentional political interference. This story was hard to verify because the people who claimed to have found the laptop wouldn't give it to other newspapers. (Much of the story, including Hunter's business dealings in Ukraine and China, was later confirmed.)
Roth: "It looked like a hack and leak."
So what are the “Twitter Files?”
Twitter's decision to bury the story became a political scandal, and new CEO Elon Musk promised an explanation. The Twitter Files, named after Facebook leaks.
Musk promised exclusive details of "what really happened" with Hunter Biden late Friday afternoon. The tweet was punctuated with a popcorn emoji.
Explaining Twitter Files
Three hours later, journalist Matt Taibbi tweeted more than three dozen tweets based on internal Twitter documents that revealed "a Frankensteinian tale of a human-built mechanism grown out of its designer's control."
Musk sees this release as a way to shape Twitter's public perception and internal culture in his image. We don't know if the CEO gave Taibbi the documents. Musk hyped the document dump before and during publication, but Taibbi cited "internal sources."
Taibbi shares email screenshots showing Twitter execs discussing the Post story and blocking its distribution. Taibbi says the emails show Twitter's "extraordinary steps" to bury the story.
Twitter communications chief Brandon Borrman has the most damning quote in the Files. Can we say this is policy? The story seemed unbelievable. It seemed like a hack... or not? Could Twitter, which ex-CEO Dick Costolo called "the free speech wing of the free speech party," censor a news story?
Many on the right say the Twitter Files prove the company acted at the behest of Democrats. Both parties had these tools, writes Taibbi. In 2020, both the Trump White House and Biden campaign made requests. He says the system for reporting tweets for deletion is unbalanced because Twitter employees' political donations favor Democrats. Perhaps. These donations may have helped Democrats connect with Twitter staff, but it's also possible they didn't. No emails in Taibbi's cache show these alleged illicit relations or any actions Twitter employees took as a result.
Even Musk's supporters were surprised by the drop. Miranda Devine of the New York Post told Tucker Carlson the documents weren't "the smoking gun we'd hoped for." Sebastian Gorka said on Truth Social, "So far, I'm deeply underwhelmed." DC Democrats collude with Palo Alto Democrats. Whoop!” The Washington Free Beacon's Joe Simonson said the Twitter files are "underwhelming." Twitter was staffed by Democrats who did their bidding. (Why?)
If "The Twitter Files" matter, why?
These emails led Twitter to suppress the Hunter Biden laptop story has real news value. It's rare for a large and valuable company like Twitter to address wrongdoing so thoroughly. Emails resemble FOIA documents. They describe internal drama at a company with government-level power. Katie Notopoulos tweeted, "Any news outlet would've loved this scoop!" It's not a'scandal' as teased."
Twitter's new owner calls it "the de facto public town square," implying public accountability. Like a government agency. Though it's exciting to receive once-hidden documents in response to a FOIA, they may be boring and tell you nothing new. Like Twitter files. We learned how Twitter blocked the Post's story, but not why. Before these documents were released, we knew Twitter had suppressed the story and who was involved.
These people were disciplined and left Twitter. Musk fired Vijaya Gadde, the former CLO who reportedly played a "key role" in the decision. Roth quit over Musk's "dictatorship." Musk arrived after Borrman left. Jack Dorsey, then-CEO, has left. Did those who digitally quarantined the Post's story favor Joe Biden and the Democrats? Republican Party opposition and Trump hatred? New York Post distaste? According to our documents, no. Was there political and press interference? True. We knew.
Taibbi interviewed anonymous ex-Twitter employees about the decision; all expressed shock and outrage. One source said, "Everyone knew this was fucked." Since Taibbi doesn't quote that expletive, we can assume the leaked emails contained few or no sensational quotes. These executives said little to support nefarious claims.
Outlets more invested in the Hunter Biden story than Gizmodo seem vexed by the release and muted headlines. The New York Post, which has never shied away from a blaring headline in its 221-year history, owns the story of Hunter Biden's laptop. Two Friday-night Post alerts about Musk's actions were restrained. Elon Musk will drop Twitter files on NY Post-Hunter Biden laptop censorship today. Elon Musk's Twitter dropped Post censorship details from Biden's laptop. Fox News' Apple News push alert read, "Elon Musk drops Twitter censorship documents."
Bombshell, bombshell, bombshell… what, exactly, is the bombshell? Maybe we've heard this story too much and are missing the big picture. Maybe these documents detail a well-documented decision.
The Post explains why on its website. "Hunter Biden laptop bombshell: Twitter invented reason to censor Post's reporting," its headline says.
Twitter's ad hoc decision to moderate a tabloid's content is not surprising. The social network had done this for years as it battled toxic users—violent white nationalists, virulent transphobes, harassers and bullies of all political stripes, etc. No matter how much Musk crows, the company never had content moderation under control. Buzzfeed's 2016 investigation showed how Twitter has struggled with abusive posters since 2006. Jack Dorsey and his executives improvised, like Musk.
Did the US government interfere with the ex-social VP's media company? That's shocking, a bombshell. Musk said Friday, "Twitter suppressing free speech by itself is not a 1st amendment violation, but acting under government orders with no judicial review is." Indeed! Taibbi believed this. August 2022: "The laptop is secondary." Zeynep Tufecki, a Columbia professor and New York Times columnist, says the FBI is cutting true story distribution. Taibbi retracted the claim Friday night: "I've seen no evidence of government involvement in the laptop story."
What’s the bottom line?
I'm still not sure what's at stake in the Hunter Biden scandal after dozens of New York Post articles, hundreds of hours of Fox News airtime, and thousands of tweets. Briefly: Joe Biden's son left his laptop with a questionable repairman. FBI confiscated it? The repairman made a copy and gave it to Rudy Giuliani's lawyer. The Post got it from Steve Bannon. On that laptop were videos of Hunter Biden smoking crack, cavorting with prostitutes, and emails about introducing his father to a Ukrainian businessman for $50,000 a month. Joe Biden urged Ukraine to fire a prosecutor investigating the company. What? The story seems to be about Biden family business dealings, right?
The discussion has moved past that point anyway. Now, the story is the censorship of it. Adrienne Rich wrote in "Diving Into the Wreck" that she came for "the wreck and not the story of the wreck" No matter how far we go, Hunter Biden's laptop is done. Now, the crash's story matters.
I'm dizzy. Katherine Miller of BuzzFeed wrote, "I know who I believe, and you probably do, too. To believe one is to disbelieve the other, which implicates us in the decision; we're stuck." I'm stuck. Hunter Biden's laptop is a political fabrication. You choose. I've decided.
This could change. Twitter Files drama continues. Taibbi said, "Much more to come." I'm dizzy.