


More on Entrepreneurship/Creators

Dani Herrera
3 years ago
What prevents companies from disclosing salary information?

Yes, salary details ought to be mentioned in job postings. Recruiters and candidates both agree, so why doesn't it happen?
The short answer is “Unfortunately, it’s not the Recruiter’s decision”. The longer answer is well… A LOT.
Starting in November 2022, NYC employers must include salary ranges in job postings. It should have started in May, but companies balked.
I'm thrilled about salary transparency. This decision will promote fair, inclusive, and equitable hiring practices, and I'm sure other states will follow suit. Good news!
Candidates, recruiters, and ED&I practitioners have advocated for pay transparency for years. Why the opposition?
Let's quickly review why companies have trouble sharing salary bands.
💰 Pay Parity
Many companies and leaders still oppose pay parity. Yes, even in 2022.
💰 Pay Equity
Many companies believe in pay parity and have reviewed their internal processes and systems to ensure equality.
However, Pay Equity affects who gets roles/promotions/salary raises/bonuses and when. Enter the pay gap!
💰Pay Transparency and its impact on Talent Retention
Sharing salary bands with external candidates (and the world) means current employees will have access to that information, which is one of the main reasons companies don't share salary data.
If a company has Pay Parity and Pay Equity issues, they probably have a Pay Transparency policy as well.
Sharing salary information with external candidates without ensuring current employees understand their own salary bands and how promotions/raises are decided could impact talent retention strategies.
This information should help clarify recent conversations.

Mangu Solutions
3 years ago
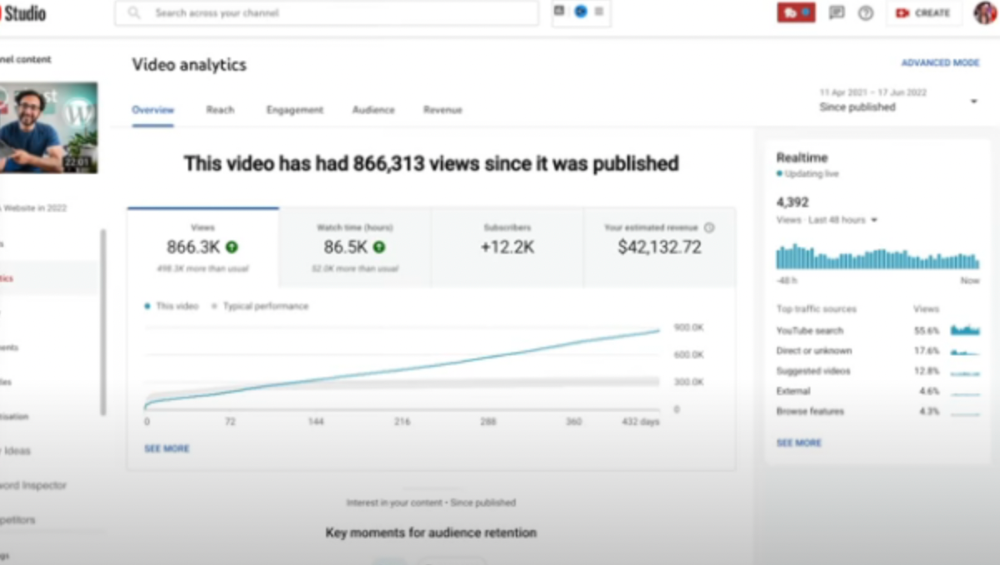
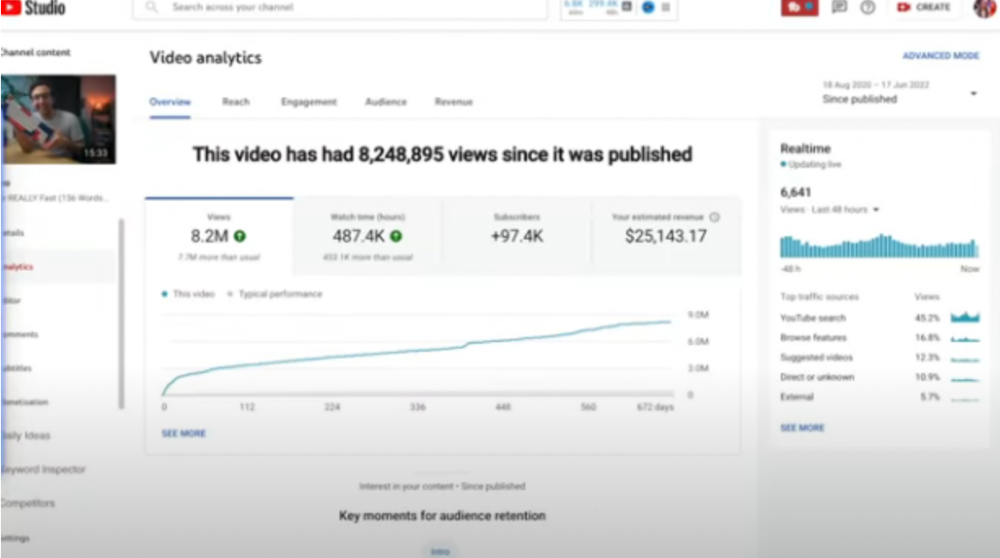
Growing a New App to $15K/mo in 6 Months [SaaS Case Study]
Discover How We Used Facebook Ads to Grow a New Mobile App from $0 to $15K MRR in Just 6 Months and Our Strategy to Hit $100K a Month.
Our client introduced a mobile app for Poshmark resellers in December and wanted as many to experience it and subscribe to the monthly plan.
An Error We Committed
We initiated a Facebook ad campaign with a "awareness" goal, not "installs." This sent them to a landing page that linked to the iPhone App Store and Android Play Store. Smart, right?
We got some installs, but we couldn't tell how many came from the ad versus organic/other channels because the objective we chose only reported landing page clicks, not app installs.
We didn't know which interest groups/audiences had the best cost per install (CPI) to optimize and scale our budget.

After spending $700 without adequate data (installs and trials report), we stopped the campaign and worked with our client's app developer to set up app events tracking.
This allowed us to create an installs campaign and track installs, trials, and purchases (in some cases).
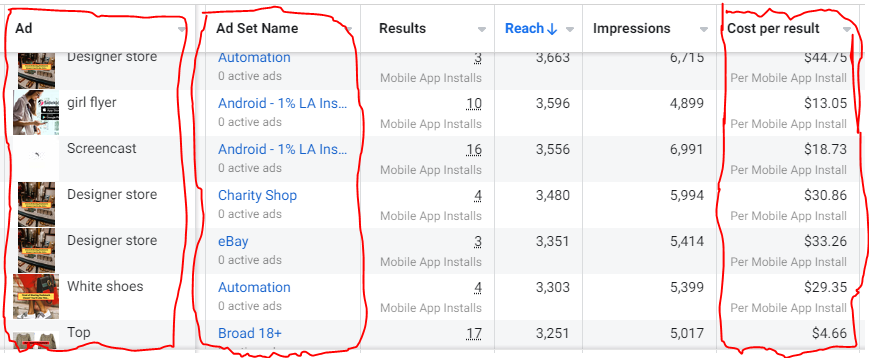
Finding a Successful Audience
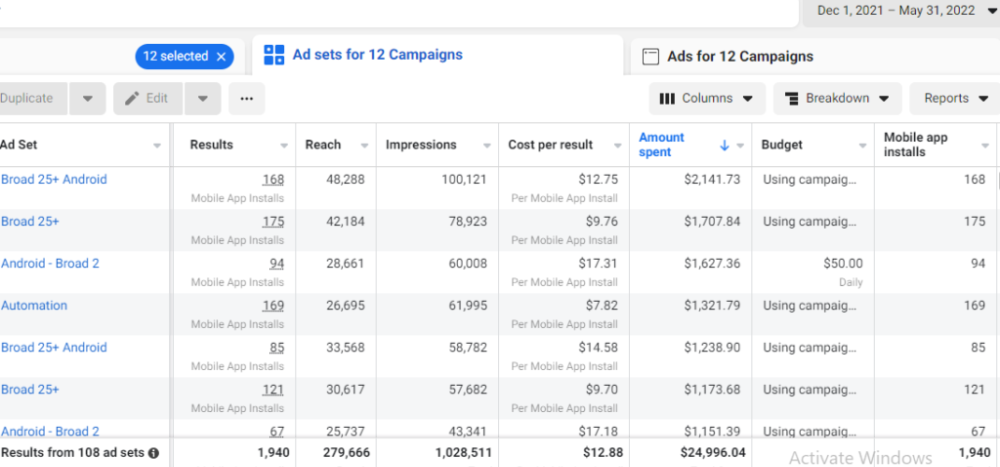
Once we knew what ad sets brought in what installs at what cost, we began optimizing and testing other interest groups and audiences, growing the profitable low CPI ones and eliminating the high CPI ones.
We did all our audience testing using an ABO campaign (Ad Set Budget Optimization), spending $10 to $30 on each ad set for three days and optimizing afterward. All ad sets under $30 were moved to a CBO campaign (Campaign Budget Optimization).
We let Facebook's AI decide how much to spend on each ad set, usually the one most likely to convert at the lowest cost.
If the CBO campaign maintains a nice CPI, we keep increasing the budget by $50 every few days or duplicating it sometimes in order to double the budget. This is how we've scaled to $400/day profitably.
Finding Successful Creatives
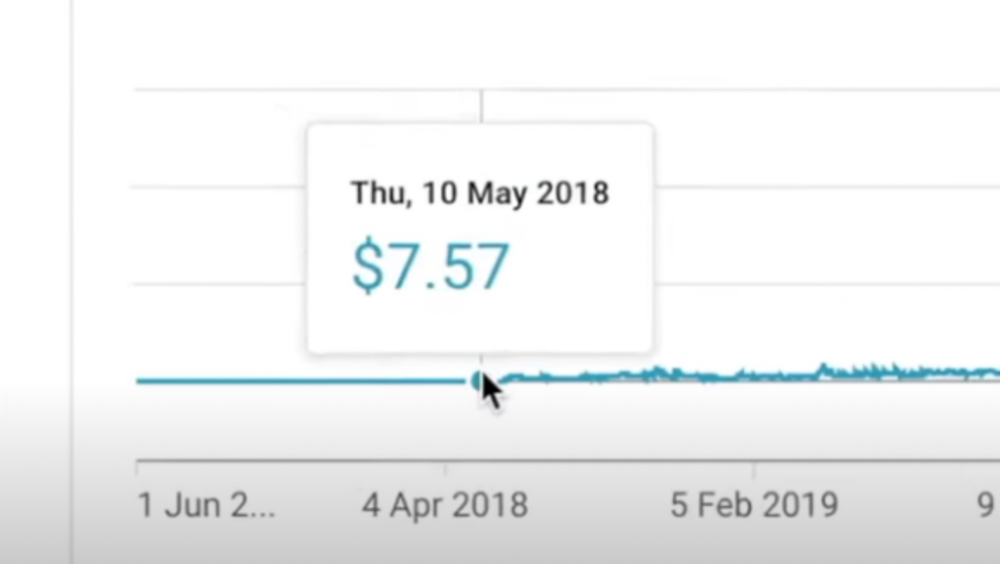
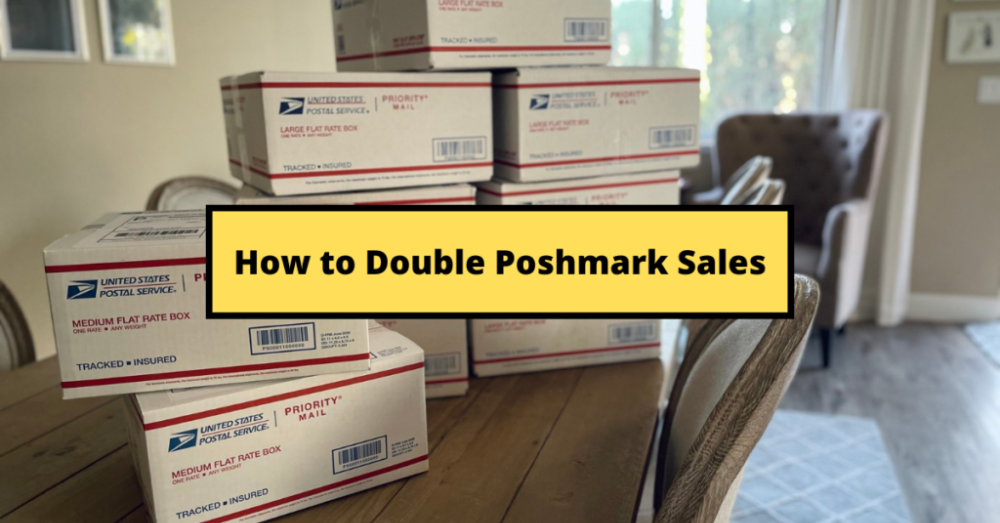
Per campaign, we tested 2-6 images/videos. Same ad copy and CTA. There was no clear winner because some images did better with some interest groups.
The image above with mail packages, for example, got us a cheap CPI of $9.71 from our Goodwill Stores interest group but, a high $48 CPI from our lookalike audience. Once we had statistically significant data, we turned off the high-cost ad.
New marketers who are just discovering A/B testing may assume it's black and white — winner and loser. However, Facebook ads' machine learning and reporting has gotten so sophisticated that it's hard to call a creative a flat-out loser, but rather a 'bad fit' for some audiences, and perfect for others.
You can see how each creative performs across age groups and optimize.
How Many Installs Did It Take Us to Earn $15K Per Month?
Six months after paying $25K, we got 1,940 app installs, 681 free trials, and 522 $30 monthly subscriptions. 522 * $30 gives us $15,660 in monthly recurring revenue (MRR).
Next, what? $100K per month
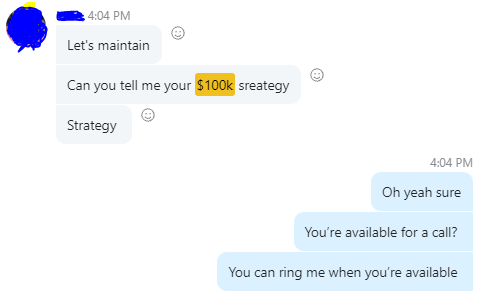
The conversation above is with the app's owner. We got on a 30-minute call where I shared how I plan to get the app to be making $100K a month like I’ve done for other businesses.
Reverse Engineering $100K
Formula:
For $100K/month, we need 3,334 people to pay $30/month. 522 people pay that. We need 2,812 more paid users.
522 paid users from 1,940 installs is a 27% conversion rate. To hit $100K/month, we need 10,415 more installs. Assuming...
With a $400 daily ad spend, we average 40 installs per day. This means that if everything stays the same, it would take us 260 days (around 9 months) to get to $100K a month (MRR).
Conclusion
You must market your goods to reach your income objective (without waiting forever). Paid ads is the way to go if you hate knocking on doors or irritating friends and family (who aren’t scalable anyways).
You must also test and optimize different angles, audiences, interest groups, and creatives.

Pat Vieljeux
3 years ago
Your entrepreneurial experience can either be a beautiful adventure or a living hell with just one decision.
Choose.

DNA makes us distinct.
We act alike. Most people follow the same road, ignoring differences. We remain quiet about our uniqueness for fear of exclusion (family, social background, religion). We live a more or less imposed life.
Off the beaten path, we stand out from the others. We obey without realizing we're sewing a shroud. We're told to do as everyone else and spend 40 years dreaming of a golden retirement and regretting not living.
“One of the greatest regrets in life is being what others would want you to be, rather than being yourself.” - Shannon L. Alder
Others dare. Again, few are creative; most follow the example of those who establish a business for the sake of entrepreneurship. To live.
They pick a potential market and model their MVP on an existing solution. Most mimic others, alter a few things, appear to be original, and end up with bland products, adding to an already crowded market.
SaaS, PaaS, etc. followed suit. It's reduced pricing, profitability, and product lifespan.
As competitors become more aggressive, their profitability diminishes, making life horrible for them and their employees. They fail to innovate, cut costs, and close their company.
Few of them look happy and fulfilled.
How did they do it?
The answer is unsettlingly simple.
They are themselves.
They start their company, propelled at first by a passion or maybe a calling.
Then, at their own pace, they create it with the intention of resolving a dilemma.
They assess what others are doing and consider how they might improve it.
In contrast to them, they respond to it in their own way by adding a unique personal touch. Therefore, it is obvious.
Originals, like their DNA, can't be copied. Or if they are, they're poorly printed. Originals are unmatched. Artist-like. True collectors only buy Picasso paintings by the master, not forgeries, no matter how good.
Imaginative people are constantly ahead. Copycats fall behind unless they innovate. They watch their competition continuously. Their solution or product isn't sexy. They hope to cash in on their copied product by flooding the market.
They're mostly pirates. They're short-sighted, unlike creators.
Creators see further ahead and have no rivals. They use copiers to confirm a necessity. To maintain their individuality, creators avoid copying others. They find copying boring. It's boring. They oppose plagiarism.
It's thrilling and inspiring.
It will also make them more able to withstand their opponents' tension. Not to mention roadblocks. For creators, impediments are games.
Others fear it. They race against the clock and fear threats that could interrupt their momentum since they lack inventiveness and their product has a short life cycle.
Creators have time on their side. They're dedicated. Clearly. Passionate booksellers will have their own bookstore. Their passion shows in their book choices. Only the ones they love.
The copier wants to display as many as possible, including mediocre authors, and will cut costs. All this to dominate the market. They're digging their own grave.
The bookseller is just one example. I could give you tons of them.
Closing remarks
Entrepreneurs might follow others or be themselves. They risk exhaustion trying to predict what their followers will do.
It's true.
Life offers choices.
Being oneself or doing as others do, with the possibility of regretting not expressing our uniqueness and not having lived.
“Be yourself; everyone else is already taken”. Oscar Wilde
The choice is yours.
You might also like

Francesca Furchtgott
3 years ago
Giving customers what they want or betraying the values of the brand?
A J.Crew collaboration for fashion label Eveliina Vintage is not a paradox; it is a solution.

Eveliina Vintage's capsule collection debuted yesterday at J.Crew. This J.Crew partnership stopped me in my tracks.
Eveliina Vintage sells vintage goods. Eeva Musacchia founded the shop in Finland in the 1970s. It's recognized for its one-of-a-kind slip dresses from the 1930s and 1940s.
I wondered why a vintage brand would partner with a mass shop. Fast fashion against vintage shopping? Will Eveliina Vintages customers be turned off?
But Eveliina Vintages customers don't care about sustainability. They want Eveliina's Instagram look. Eveliina Vintage collaborated with J.Crew to give customers what they wanted: more Eveliina at a lower price.
Vintage: A Fashion Option That Is Eco-Conscious
Secondhand shopping is a trendy response to quick fashion. J.Crew releases hundreds of styles annually. Waste and environmental damage have been criticized. A pair of jeans requires 1,800 gallons of water. J.Crew's limited-time deals promote more purchases. J.Crew items are likely among those Americans wear 7 times before discarding.
Consumers and designers have emphasized sustainability in recent years. Stella McCartney and Eileen Fisher are popular eco-friendly brands. They've also flocked to ThredUp and similar sites.
Gap, Levis, and Allbirds have listened to consumer requests. They promote recycling, ethical sourcing, and secondhand shopping.
Secondhand shoppers feel good about reusing and recycling clothing that might have ended up in a landfill.
Eco-conscious fashionistas shop vintage. These shoppers enjoy the thrill of the hunt (that limited-edition Chanel bag!) and showing off a unique piece (nobody will have my look!). They also reduce their environmental impact.
Is Eveliina Vintage capitalizing on an aesthetic or is it a sustainable brand?
Eveliina Vintage emphasizes environmental responsibility. Vogue's Amanda Musacchia emphasized sustainability. Amanda, founder Eeva's daughter, is a company leader.
But Eveliina's press message doesn't address sustainability, unlike Instagram. Scarcity and fame rule.
Eveliina Vintages Instagram has see-through dresses and lace-trimmed slip dresses. Celebrities and influencers are often photographed in Eveliina's apparel, which has 53,000+ followers. Vogue appreciates Eveliina's style. Multiple publications discuss Alexa Chung's Eveliina dress.
Eveliina Vintage markets its one-of-a-kind goods. It teases future content, encouraging visitors to return. Scarcity drives demand and raises clothing prices. One dress is $1,600+, but most are $500-$1,000.
The catch: Eveliina can't monetize its expanding popularity due to exorbitant prices and limited quantity. Why?
Most people struggle to pay for their clothing. But Eveliina Vintage lacks those more affordable entry-level products, in contrast to other luxury labels that sell accessories or perfume.
Many people have trouble fitting into their clothing. The bodies of most women in the past were different from those for which vintage clothing was designed. Each Eveliina dress's specific measurements are mentioned alongside it. Be careful, you can fall in love with an ill-fitting dress.
No matter how many people can afford it and fit into it, there is only one item to sell. To get the item before someone else does, those people must be on the Eveliina Vintage website as soon as it becomes available.
A Way for Eveliina Vintage to Make Money (and Expand) with J.Crew Its following
Eveliina Vintages' cooperation with J.Crew makes commercial sense.
This partnership spreads Eveliina's style. Slightly better pricing The $390 outfits have multicolored slips and gauzy cotton gowns. Sizes range from 00 to 24, which is wider than vintage racks.
Eveliina Vintage customers like the combination. Excited comments flood the brand's Instagram launch post. Nobody is mocking the 50-year-old vintage brand's fast-fashion partnership.
Vintage may be a sustainable fashion trend, but that's not why Eveliina's clients love the brand. They only care about the old look.
And that is a tale as old as fashion.

Jess Rifkin
4 years ago
As the world watches the Russia-Ukraine border situation, This bill would bar aid to Ukraine until the Mexican border is secured.
Although Mexico and Ukraine are thousands of miles apart, this legislation would link their responses.
Context
Ukraine was a Soviet republic until 1991. A significant proportion of the population, particularly in the east, is ethnically Russian. In February, the Russian military invaded Ukraine, intent on overthrowing its democratically elected government.
This could be the biggest European land invasion since WWII. In response, President Joe Biden sent 3,000 troops to NATO countries bordering Ukraine to help with Ukrainian refugees, with more troops possible if the situation worsened.
In July 2021, the US Border Patrol reported its highest monthly encounter total since March 2000. Some Republicans compare Biden's response to the Mexican border situation to his response to the Ukrainian border situation, though the correlation is unclear.
What the bills do
Two new Republican bills seek to link the US response to Ukraine to the situation in Mexico.
The Secure America's Borders First Act would prohibit federal funding for Ukraine until the US-Mexico border is “operationally controlled,” including a wall as promised by former President Donald Trump. (The bill even mandates a 30-foot-high wall.)
The USB (Ukraine and Southern Border) Act, introduced on February 8 by Rep. Matt Rosendale (R-MT0), would allow the US to support Ukraine, but only if the number of Armed Forces deployed there is less than the number deployed to the Mexican border. Madison Cawthorne introduced H.R. 6665 on February 9th (R-NC11).
What backers say
Supporters argue that even if the US should militarily assist Ukraine, our own domestic border situation should take precedence.
After failing to secure our own border and protect our own territorial integrity, ‘America Last' politicians on both sides of the aisle now tell us that we must do so for Ukraine. “Before rushing America into another foreign conflict over an Eastern European nation's border thousands of miles from our shores, they should first secure our southern border.”
“If Joe Biden truly cared about Americans, he would prioritize national security over international affairs,” Rep. Cawthorn said in a separate press release. The least we can do to secure our own country is send the same number of troops to the US-Mexico border to assist our border patrol agents working diligently to secure America.
What opponents say
The president has defended his Ukraine and Mexico policies, stating that both seek peace and diplomacy.
Our nations [the US and Mexico] have a long and complicated history, and we haven't always been perfect neighbors, but we have seen the power and purpose of cooperation,” Biden said in 2021. “We're safer when we work together, whether it's to manage our shared border or stop the pandemic. [In both the Obama and Biden administration], we made a commitment that we look at Mexico as an equal, not as somebody who is south of our border.”
No mistake: If Russia goes ahead with its plans, it will be responsible for a catastrophic and unnecessary war of choice. To protect our collective security, the United States and our allies are ready to defend every inch of NATO territory. We won't send troops into Ukraine, but we will continue to support the Ukrainian people... But, I repeat, Russia can choose diplomacy. It is not too late to de-escalate and return to the negotiating table.”
Odds of passage
The Secure America's Borders First Act has nine Republican sponsors. Either the House Armed Services or Foreign Affairs Committees may vote on it.
Rep. Paul Gosar, a Republican, co-sponsored the USB Act (R-AZ4). The House Armed Services Committee may vote on it.
With Republicans in control, passage is unlikely.

Franz Schrepf
3 years ago
What I Wish I'd Known About Web3 Before Building
Cryptoland rollercoaster

I've lost money in crypto.
Unimportant.
The real issue: I didn’t understand how.
I'm surrounded with winners. To learn more, I created my own NFTs, currency, and DAO.
Web3 is a hilltop castle. Everything is valuable, decentralized, and on-chain.
The castle is Disneyland: beautiful in images, but chaotic with lengthy lines and kids spending too much money on dressed-up animals.
When the throng and businesses are gone, Disneyland still has enchantment.

The Real Story of Web3
NFTs
Scarcity. Scarce NFTs. That's their worth.
Skull. Rare-looking!
Nonsense.
Bored Ape Yacht Club vs. my NFTs?
Marketing.
BAYC is amazing, but not for the reasons people believe. Apecoin and Otherside's art, celebrity following, and innovation? Stunning.
No other endeavor captured the zeitgeist better. Yet how long did you think it took to actually mint the NFTs?
1 hour? Maybe a week for the website?
Minting NFTs is incredibly easy. Kid-friendly. Developers are rare. Think about that next time somebody posts “DevS dO SMt!?”
NFTs will remain popular. These projects are like our Van Goghs and Monets. Still, be wary. It still uses exclusivity and wash selling like the OG art market.
Not all NFTs are art-related.
Soulbound and anonymous NFTs could offer up new use cases. Property rights, privacy-focused ID, open-source project verification. Everything.
NFTs build online trust through ownership.
We just need to evolve from the apes first.
NFTs' superpower is marketing until then.
Crypto currency
What the hell is a token?
99% of people are clueless.
So I invested in both coins and tokens. Same same. Only that they are not.
Coins have their own blockchain and developer/validator community. It's hard.
Creating a token on top of a blockchain? Five minutes.
Most consumers don’t understand the difference, creating an arbitrage opportunity: pretend you’re a serious project without having developers on your payroll.
Few market sites help. Take a look. See any tokens?
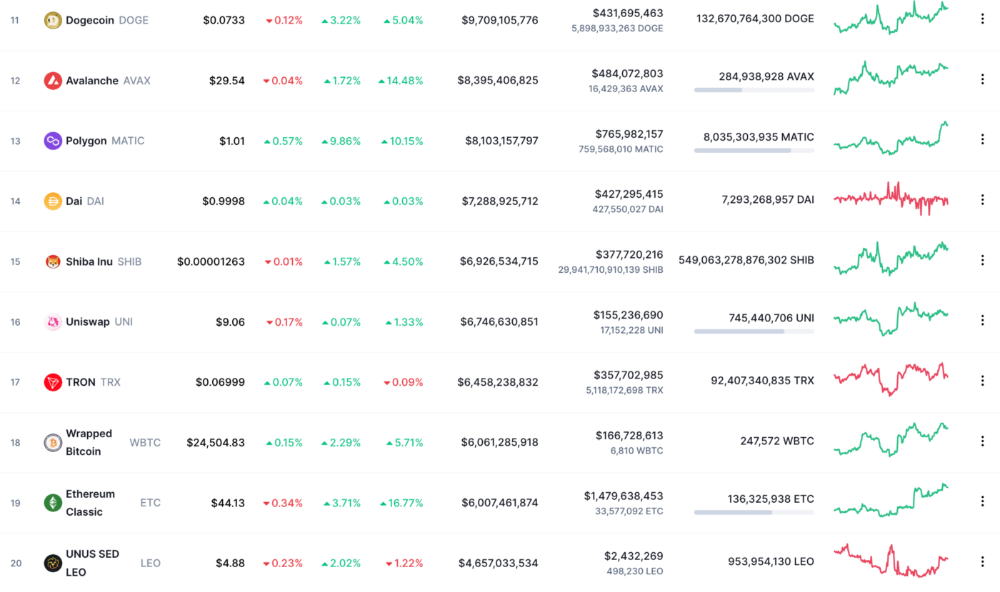
There's a hint one click deeper.
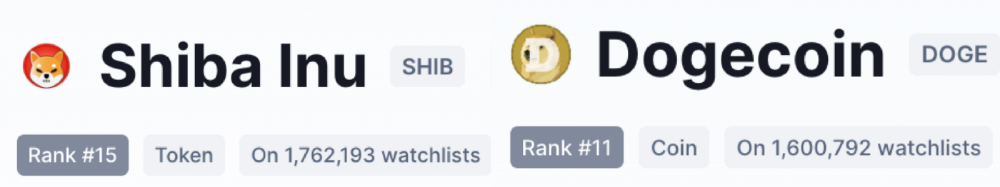
Some tokens are legitimate. Some coins are bad investments.
Tokens are utilized for DAO governance and DApp payments. Still, know who's behind a token. They might be 12 years old.
Coins take time and money. The recent LUNA meltdown indicates that currency investing requires research.
DAOs
Decentralized Autonomous Organizations (DAOs) don't work as you assume.
Yes, members can vote.
A productive organization requires more.
I've observed two types of DAOs.
Total decentralization total dysfunction
Centralized just partially. Community-driven.
A core team executes the DAO's strategy and roadmap in successful DAOs. The community owns part of the organization, votes on decisions, and holds the team accountable.
DAOs are public companies.
Amazing.
A shareholder meeting's logistics are staggering. DAOs may hold anonymous, secure voting quickly. No need for intermediaries like banks to chase up every shareholder.
Successful DAOs aren't totally decentralized. Large-scale voting and collaboration have never been easier.
And that’s all that matters.
Scale, speed.
My Web3 learnings
Disneyland is enchanting. Web3 too.
In a few cycles, NFTs may be used to build trust, not clout. Not speculating with coins. DAOs run organizations, not themselves.
Finally, some final thoughts:
NFTs will be a very helpful tool for building trust online. NFTs are successful now because of excellent marketing.
Tokens are not the same as coins. Look into any project before making a purchase. Make sure it isn't run by three 9-year-olds piled on top of one another in a trench coat, at the very least.
Not entirely decentralized, DAOs. We shall see a future where community ownership becomes the rule rather than the exception once we acknowledge this fact.
Crypto Disneyland is a rollercoaster with loops that make you sick.
Always buckle up.
Have fun!