


More on Entrepreneurship/Creators

Mircea Iosif
3 years ago
How To Start An Online Business That Will Be Profitable Without Investing A Lot Of Time
Don't know how to start an online business? Here's a guide. By following these recommendations, you can build a lucrative and profitable online business.
What Are Online Businesses Used For?
Most online businesses are websites. A self-created, self-managed website. You may sell things and services online.
To establish an internet business, you must locate a host and set up accounts with numerous companies. Once your accounts are set up, you may start publishing content and selling products or services.
How to Make Money from Your Online Business
Advertising and marketing are the best ways to make money online. You must develop strategies to contact new customers and generate leads. Make sure your website is search engine optimized so people can find you online.
Top 5 Online Business Tips for Startups:
1. Know your target audience's needs.
2. Make your website as appealing as possible.
3. Generate leads and sales with marketing.
4. Track your progress and learn from your mistakes to improve.
5. Be prepared to expand into new markets or regions.
How to Launch a Successful Online Business Without Putting in a Lot of Work
Build with a solid business model to start a profitable online business. By using these tips, you can start your online business without paying much.
First, develop a user-friendly website. You can use an internet marketing platform or create your own website. Once your website is live, optimize it for search engines and add relevant content.
Second, sell online. This can be done through ads or direct sales to website visitors. Finally, use social media to advertise your internet business. By accomplishing these things, you'll draw visitors to your website and make money.
When launching a business, invest long-term. This involves knowing your goals and how you'll pay for them. Volatility can have several effects on your business. If you offer things online, you may need to examine if the market is ready for them.
Invest wisely
Investing all your money in one endeavor can lead to too much risk and little ROI. Diversify your investments to take advantage of all available chances. So, your investments won't encounter unexpected price swings and you'll be immune to economic upheavals.
Financial news updates
When launching or running a thriving online business, financial news is crucial. By knowing current trends and upcoming developments, you can keep your business lucrative.
Keeping up with financial news can also help you avoid potential traps that could harm your bottom line. If you don't know about new legislation that could affect your industry, potential customers may choose another store when they learn about your business's problems.
Volatility ahead
You should expect volatility in the financial sector. Without a plan for coping with volatility, you could run into difficulty. If your organization relies on client input, you may not be able to exploit customer behavior shifts.
Your company could go bankrupt if you don't understand how fickle the stock market can be. By preparing for volatility, you can ensure your organization survives difficult times and market crashes.
Conclusion
Many internet businesses can be profitable. Start quickly with a few straightforward steps. Diversify your investments, follow financial news, and be prepared for volatility to develop a successful business.
Thanks for reading!

Edward Williams
3 years ago
I currently manage 4 profitable online companies. I find all the generic advice and garbage courses very frustrating. The only advice you need is this.
This is for young entrepreneurs, especially in tech.
People give useless success advice on TikTok and Reddit. Early risers, bookworms, etc. Entrepreneurship courses. Work hard and hustle.
False. These aren't successful traits.
I mean, organization is good. As someone who founded several businesses and now works at a VC firm, I find these tips to be clichés.
Based on founding four successful businesses and working with other successful firms, here's my best actionable advice:
1. Choose a sector or a niche and become an expert in it.
This is more generic than my next tip, but it's a must-do that's often overlooked. Become an expert in the industry or niche you want to enter. Discover everything.
Buy (future) competitors' products. Understand consumers' pain points. Market-test. Target keyword combos. Learn technical details.
The most successful businesses I've worked with were all formed by 9-5 employees. They knew the industry's pain points. They started a business targeting these pain points.
2. Choose a niche or industry crossroads to target.
How do you choose an industry or niche? What if your industry is too competitive?
List your skills and hobbies. Randomness is fine. Find an intersection between two interests or skills.
Say you build websites well. You like cars.
Web design is a *very* competitive industry. Cars and web design?
Instead of web design, target car dealers and mechanics. Build a few fake demo auto mechanic websites, then cold call shops with poor websites. Verticalize.
I've noticed a pattern:
Person works in a particular industry for a corporation.
Person gains expertise in the relevant industry.
Person quits their job and launches a small business to address a problem that their former employer was unwilling to address.
I originally posted this on Reddit and it seemed to have taken off so I decided to share it with you all.
Focus on the product. When someone buys from you, you convince them the product's value exceeds the price. It's not fair and favors the buyer.
Creating a superior product or service will win. Narrowing this helps you outcompete others.
You may be their only (lucky) option.

Rick Blyth
3 years ago
Looking for a Reliable Micro SaaS Niche
Niches are rich, as the adage goes.
Micro SaaS requires a great micro-niche; otherwise, it's merely plain old SaaS with a large audience.
Instead of targeting broad markets with few identifying qualities, specialise down to a micro-niche. How would you target these users?
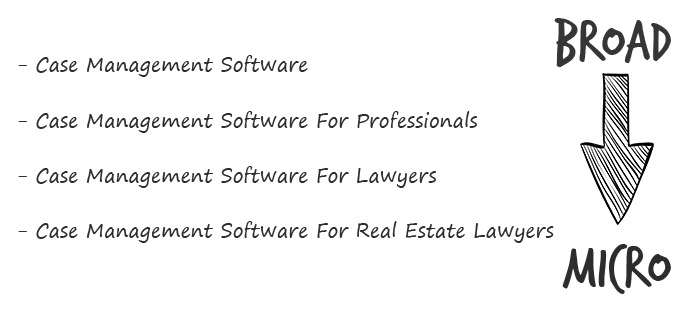
Better go tiny. You'll locate and engage new consumers more readily and serve them better with a customized solution.
Imagine you're a real estate lawyer looking for a case management solution. Because it's so specific to you, you'd be lured to this link:
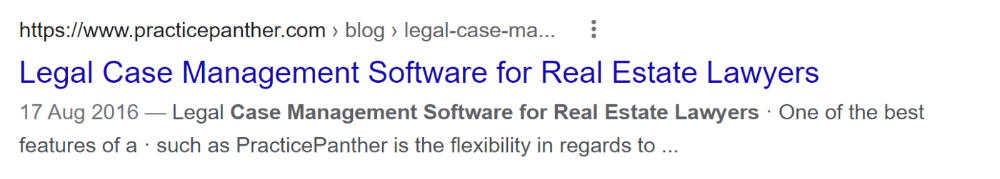
instead of below:
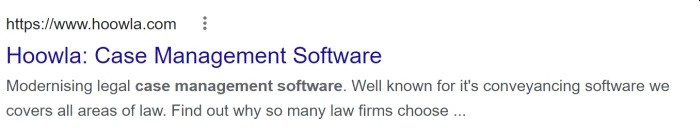
Next, locate mini SaaS niches that could work for you. You're not yet looking at the problems/solutions in these areas, merely shortlisting them.
The market should be growing, not shrinking
We shouldn't design apps for a declining niche. We intend to target stable or growing niches for the next 5 to 10 years.
If it's a developing market, you may be able to claim a stake early. You must balance this strategy with safer, longer-established niches (accountancy, law, health, etc).
First Micro SaaS apps I designed were for Merch By Amazon creators, a burgeoning niche. I found this niche when searching for passive income.
Graphic designers and entrepreneurs post their art to Amazon to sell on clothes. When Amazon sells their design, they get a royalty. Since 2015, this platform and specialty have grown dramatically.
Amazon doesn't publicize the amount of creators on the platform, but it's possible to approximate by looking at Facebook groups, Reddit channels, etc.
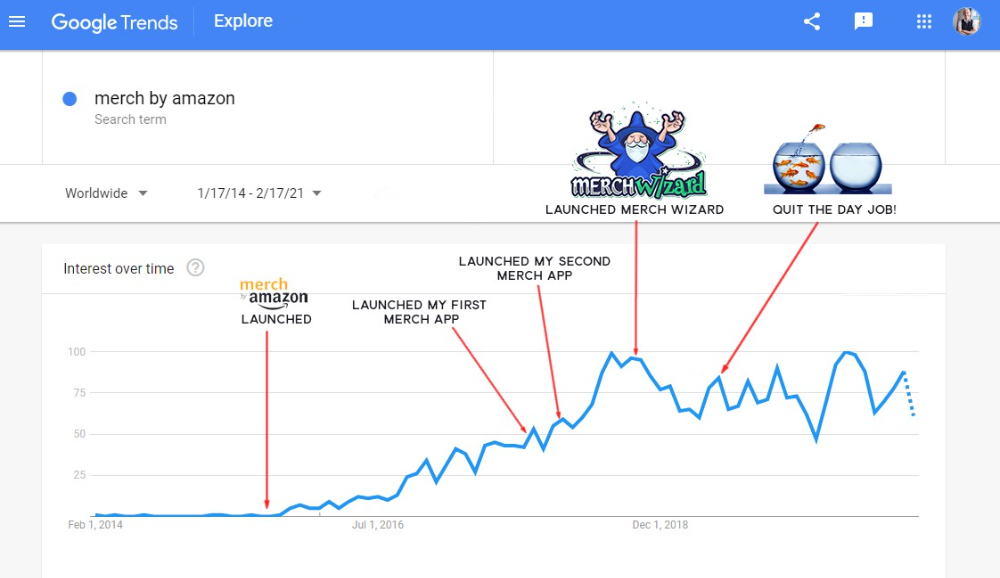
I could see the community growing week by week, with new members joining. Merch was an up-and-coming niche, and designers made money when their designs sold. All I had to do was create tools that let designers focus on making bestselling designs.
Look at the Google Trends graph below to see how this niche has evolved and when I released my apps and resigned my job.
Are the users able to afford the tools?
Who's your average user? Consumer or business? Is your solution budgeted?
If they're students, you'll struggle to convince them to subscribe to your study-system app (ahead of video games and beer).
Let's imagine you designed a Shopify plugin that emails customers when a product is restocked. If your plugin just needs 5 product sales a month to justify its cost, everyone wins (just be mindful that one day Shopify could potentially re-create your plugins functionality within its core offering making your app redundant ).
Do specialized users buy tools? If so, that's comforting. If not, you'd better have a compelling value proposition for your end customer if you're the first.
This should include how much time or money your program can save or make the user.
Are you able to understand the Micro SaaS market?
Ideally, you're already familiar about the industry/niche. Maybe you're fixing a challenge from your day job or freelance work.
If not, evaluate how long it would take to learn the niche's users. Health & Fitness is easier to relate to and understand than hedge fund derivatives trading.
Competing in these complex (and profitable) fields might offer you an edge.
B2C, B2M, or B2B?
Consider your user base's demographics. Will you target businesses, consumers, or both? Let's examine the different consumer types:
B2B refers to business-to-business transactions where customers are other businesses. UpVoty, Plutio, Slingshot, Salesforce, Atlassian, and Hubspot are a few examples of SaaS, ranging from Micro SaaS to SaaS.
Business to Consumer (B2C), in which your clients are people who buy things. For instance, Duolingo, Canva, and Nomad List.
For instance, my tool KDP Wizard has a mixed user base of publishing enterprises and also entrepreneurial consumers selling low-content books on Amazon. This is a case of business to many (B2M), where your users are a mixture of businesses and consumers. There is a large SaaS called Dropbox that offers both personal and business plans.
Targeting a B2B vs. B2C niche is very different. The sales cycle differs.
A B2B sales staff must make cold calls to potential clients' companies. Long sales, legal, and contractual conversations are typically required for each business to get the go-ahead. The cost of obtaining a new customer is substantially more than it is for B2C, despite the fact that the recurring fees are significantly higher.
Since there is typically only one individual making the purchasing decision, B2C signups are virtually always self-service with reduced recurring fees. Since there is typically no outbound sales staff in B2C, acquisition costs are significantly lower than in B2B.
User Characteristics for B2B vs. B2C
Consider where your niche's users congregate if you don't already have a presence there.
B2B users frequent LinkedIn and Twitter. B2C users are on Facebook/Instagram/Reddit/Twitter, etc.
Churn is higher in B2C because consumers haven't gone through all the hoops of a B2B sale. Consumers are more unpredictable than businesses since they let their bank cards exceed limitations or don't update them when they expire.
With a B2B solution, there's a contractual arrangement and the firm will pay the subscription as long as they need it.
Depending on how you feel about the above (sales team vs. income vs. churn vs. targeting), you'll know which niches to pursue.
You ought to respect potential customers.
Would you hang out with customers?
You'll connect with users at conferences (in-person or virtual), webinars, seminars, screenshares, Facebook groups, emails, support calls, support tickets, etc.
If talking to a niche's user base makes you shudder, you're in for a tough road. Whether they're demanding or dull, avoid them if possible.
Merch users are mostly graphic designers, side hustlers, and entrepreneurs. These laid-back users embrace technologies that assist develop their Merch business.
I discovered there was only one annual conference for this specialty, held in Seattle, USA. I decided to organize a conference for UK/European Merch designers, despite never having done so before.
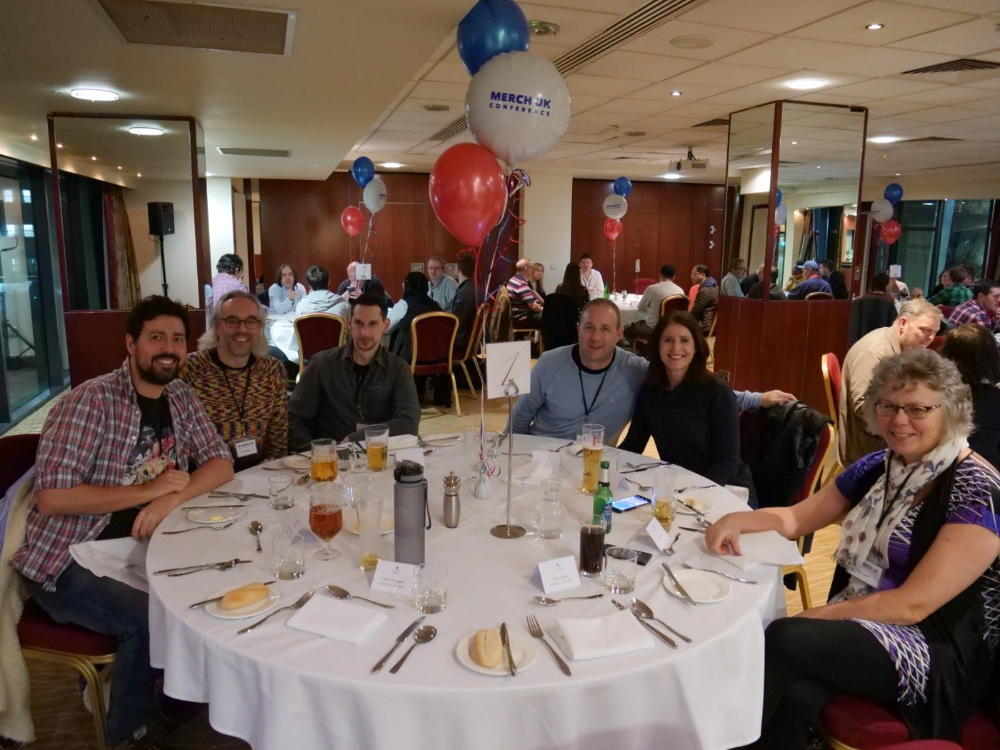
Hosting a conference for over 80 people was stressful, and it turned out to be much bigger than expected, with attendees from the US, Europe, and the UK.
I met many specialized users, built relationships, gained trust, and picked their brains in person. Many of the attendees were already Merch Wizard users, so hearing their feedback and ideas for future features was invaluable.
focused and specific
Instead of building for a generic, hard-to-reach market, target a specific group.
I liken it to fishing in a little, hidden pond. This small pond has only one species of fish, so you learn what bait it likes. Contrast that with trawling for hours to catch as many fish as possible, even if some aren't what you want.
In the case management scenario, it's difficult to target leads because several niches could use the app. Where do your potential customers hang out? Your generic solution: No.
It's easier to join a community of Real Estate Lawyers and see if your software can answer their pain points.
My Success with Micro SaaS
In my case, my Micro SaaS apps have been my chrome extensions. Since I launched them, they've earned me an average $10k MRR, allowing me to quit my lousy full-time job years ago.
I sold my apps after scaling them for a life-changing lump amount. Since then, I've helped unfulfilled software developers escape the 9-5 through Micro SaaS.
Whether it's a profitable side hustle or a liferaft to quit their job and become their own Micro SaaS boss.
Having built my apps to the point where I could quit my job, then scaled and sold them, I feel I can share my skills with software developers worldwide.
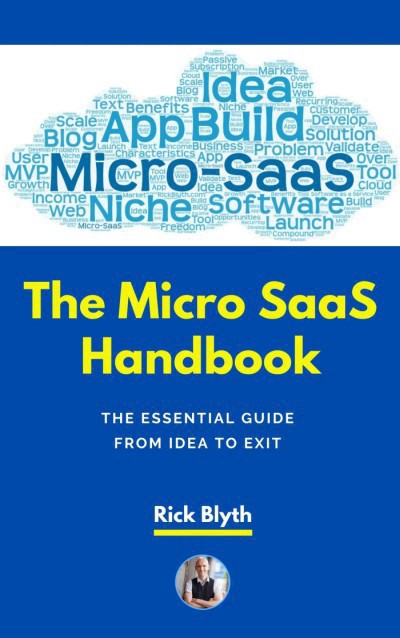
Read my free guide on self-funded SaaS to discover more about Micro SaaS, or download your own copy. 12 chapters cover everything from Idea to Exit.
Watch my YouTube video to learn how to construct a Micro SaaS app in 10 steps.
You might also like

Farhan Ali Khan
2 years ago
Introduction to Zero-Knowledge Proofs: The Art of Proving Without Revealing
Zero-Knowledge Proofs for Beginners
Published here originally.
Introduction
I Spy—did you play as a kid? One person chose a room object, and the other had to guess it by answering yes or no questions. I Spy was entertaining, but did you know it could teach you cryptography?
Zero Knowledge Proofs let you show your pal you know what they picked without exposing how. Math replaces electronics in this secret spy mission. Zero-knowledge proofs (ZKPs) are sophisticated cryptographic tools that allow one party to prove they have particular knowledge without revealing it. This proves identification and ownership, secures financial transactions, and more. This article explains zero-knowledge proofs and provides examples to help you comprehend this powerful technology.
What is a Proof of Zero Knowledge?
Zero-knowledge proofs prove a proposition is true without revealing any other information. This lets the prover show the verifier that they know a fact without revealing it. So, a zero-knowledge proof is like a magician's trick: the prover proves they know something without revealing how or what. Complex mathematical procedures create a proof the verifier can verify.
Want to find an easy way to test it out? Try out with tis awesome example! ZK Crush
Describe it as if I'm 5
Alex and Jack found a cave with a center entrance that only opens when someone knows the secret. Alex knows how to open the cave door and wants to show Jack without telling him.
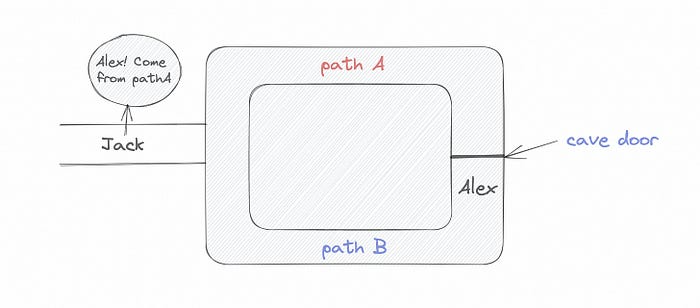
Alex and Jack name both pathways (let’s call them paths A and B).
In the first phase, Alex is already inside the cave and is free to select either path, in this case A or B.
As Alex made his decision, Jack entered the cave and asked him to exit from the B path.
Jack can confirm that Alex really does know the key to open the door because he came out for the B path and used it.
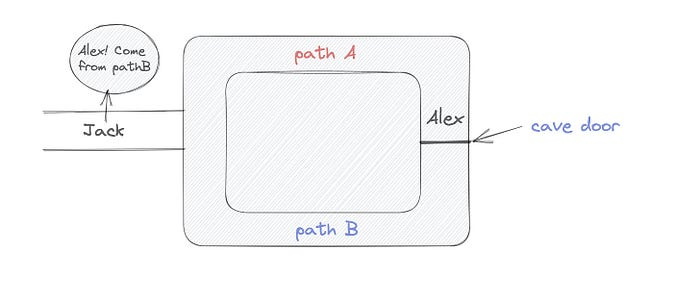
To conclude, Alex and Jack repeat:
Alex walks into the cave.
Alex follows a random route.
Jack walks into the cave.
Alex is asked to follow a random route by Jack.
Alex follows Jack's advice and heads back that way.
What is a Zero Knowledge Proof?
At a high level, the aim is to construct a secure and confidential conversation between the prover and the verifier, where the prover convinces the verifier that they have the requisite information without disclosing it. The prover and verifier exchange messages and calculate in each round of the dialogue.
The prover uses their knowledge to prove they have the information the verifier wants during these rounds. The verifier can verify the prover's truthfulness without learning more by checking the proof's mathematical statement or computation.
Zero knowledge proofs use advanced mathematical procedures and cryptography methods to secure communication. These methods ensure the evidence is authentic while preventing the prover from creating a phony proof or the verifier from extracting unnecessary information.
ZK proofs require examples to grasp. Before the examples, there are some preconditions.
Criteria for Proofs of Zero Knowledge
Completeness: If the proposition being proved is true, then an honest prover will persuade an honest verifier that it is true.
Soundness: If the proposition being proved is untrue, no dishonest prover can persuade a sincere verifier that it is true.
Zero-knowledge: The verifier only realizes that the proposition being proved is true. In other words, the proof only establishes the veracity of the proposition being supported and nothing more.
The zero-knowledge condition is crucial. Zero-knowledge proofs show only the secret's veracity. The verifier shouldn't know the secret's value or other details.
Example after example after example
To illustrate, take a zero-knowledge proof with several examples:
Initial Password Verification Example
You want to confirm you know a password or secret phrase without revealing it.
Use a zero-knowledge proof:
You and the verifier settle on a mathematical conundrum or issue, such as figuring out a big number's components.
The puzzle or problem is then solved using the hidden knowledge that you have learned. You may, for instance, utilize your understanding of the password to determine the components of a particular number.
You provide your answer to the verifier, who can assess its accuracy without knowing anything about your private data.
You go through this process several times with various riddles or issues to persuade the verifier that you actually are aware of the secret knowledge.
You solved the mathematical puzzles or problems, proving to the verifier that you know the hidden information. The proof is zero-knowledge since the verifier only sees puzzle solutions, not the secret information.
In this scenario, the mathematical challenge or problem represents the secret, and solving it proves you know it. The evidence does not expose the secret, and the verifier just learns that you know it.
My simple example meets the zero-knowledge proof conditions:
Completeness: If you actually know the hidden information, you will be able to solve the mathematical puzzles or problems, hence the proof is conclusive.
Soundness: The proof is sound because the verifier can use a publicly known algorithm to confirm that your answer to the mathematical conundrum or difficulty is accurate.
Zero-knowledge: The proof is zero-knowledge because all the verifier learns is that you are aware of the confidential information. Beyond the fact that you are aware of it, the verifier does not learn anything about the secret information itself, such as the password or the factors of the number. As a result, the proof does not provide any new insights into the secret.
Explanation #2: Toss a coin.
One coin is biased to come up heads more often than tails, while the other is fair (i.e., comes up heads and tails with equal probability). You know which coin is which, but you want to show a friend you can tell them apart without telling them.
Use a zero-knowledge proof:
One of the two coins is chosen at random, and you secretly flip it more than once.
You show your pal the following series of coin flips without revealing which coin you actually flipped.
Next, as one of the two coins is flipped in front of you, your friend asks you to tell which one it is.
Then, without revealing which coin is which, you can use your understanding of the secret order of coin flips to determine which coin your friend flipped.
To persuade your friend that you can actually differentiate between the coins, you repeat this process multiple times using various secret coin-flipping sequences.
In this example, the series of coin flips represents the knowledge of biased and fair coins. You can prove you know which coin is which without revealing which is biased or fair by employing a different secret sequence of coin flips for each round.
The evidence is zero-knowledge since your friend does not learn anything about which coin is biased and which is fair other than that you can tell them differently. The proof does not indicate which coin you flipped or how many times you flipped it.
The coin-flipping example meets zero-knowledge proof requirements:
Completeness: If you actually know which coin is biased and which is fair, you should be able to distinguish between them based on the order of coin flips, and your friend should be persuaded that you can.
Soundness: Your friend may confirm that you are correctly recognizing the coins by flipping one of them in front of you and validating your answer, thus the proof is sound in that regard. Because of this, your acquaintance can be sure that you are not just speculating or picking a coin at random.
Zero-knowledge: The argument is that your friend has no idea which coin is biased and which is fair beyond your ability to distinguish between them. Your friend is not made aware of the coin you used to make your decision or the order in which you flipped the coins. Consequently, except from letting you know which coin is biased and which is fair, the proof does not give any additional information about the coins themselves.
Figure out the prime number in Example #3.
You want to prove to a friend that you know their product n=pq without revealing p and q. Zero-knowledge proof?
Use a variant of the RSA algorithm. Method:
You determine a new number s = r2 mod n by computing a random number r.
You email your friend s and a declaration that you are aware of the values of p and q necessary for n to equal pq.
A random number (either 0 or 1) is selected by your friend and sent to you.
You send your friend r as evidence that you are aware of the values of p and q if e=0. You calculate and communicate your friend's s/r if e=1.
Without knowing the values of p and q, your friend can confirm that you know p and q (in the case where e=0) or that s/r is a legitimate square root of s mod n (in the situation where e=1).
This is a zero-knowledge proof since your friend learns nothing about p and q other than their product is n and your ability to verify it without exposing any other information. You can prove that you know p and q by sending r or by computing s/r and sending that instead (if e=1), and your friend can verify that you know p and q or that s/r is a valid square root of s mod n without learning anything else about their values. This meets the conditions of completeness, soundness, and zero-knowledge.
Zero-knowledge proofs satisfy the following:
Completeness: The prover can demonstrate this to the verifier by computing q = n/p and sending both p and q to the verifier. The prover also knows a prime number p and a factorization of n as p*q.
Soundness: Since it is impossible to identify any pair of numbers that correctly factorize n without being aware of its prime factors, the prover is unable to demonstrate knowledge of any p and q that do not do so.
Zero knowledge: The prover only admits that they are aware of a prime number p and its associated factor q, which is already known to the verifier. This is the extent of their knowledge of the prime factors of n. As a result, the prover does not provide any new details regarding n's prime factors.
Types of Proofs of Zero Knowledge
Each zero-knowledge proof has pros and cons. Most zero-knowledge proofs are:
Interactive Zero Knowledge Proofs: The prover and the verifier work together to establish the proof in this sort of zero-knowledge proof. The verifier disputes the prover's assertions after receiving a sequence of messages from the prover. When the evidence has been established, the prover will employ these new problems to generate additional responses.
Non-Interactive Zero Knowledge Proofs: For this kind of zero-knowledge proof, the prover and verifier just need to exchange a single message. Without further interaction between the two parties, the proof is established.
A statistical zero-knowledge proof is one in which the conclusion is reached with a high degree of probability but not with certainty. This indicates that there is a remote possibility that the proof is false, but that this possibility is so remote as to be unimportant.
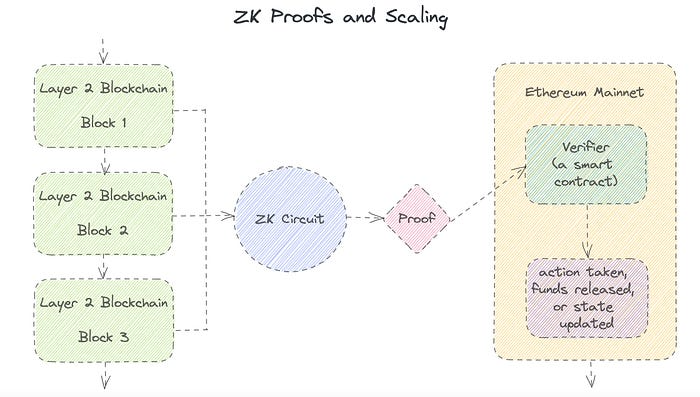
Succinct Non-Interactive Argument of Knowledge (SNARKs): SNARKs are an extremely effective and scalable form of zero-knowledge proof. They are utilized in many different applications, such as machine learning, blockchain technology, and more. Similar to other zero-knowledge proof techniques, SNARKs enable one party—the prover—to demonstrate to another—the verifier—that they are aware of a specific piece of information without disclosing any more information about that information.
The main characteristic of SNARKs is their succinctness, which refers to the fact that the size of the proof is substantially smaller than the amount of the original data being proved. Because to its high efficiency and scalability, SNARKs can be used in a wide range of applications, such as machine learning, blockchain technology, and more.
Uses for Zero Knowledge Proofs
ZKP applications include:
Verifying Identity ZKPs can be used to verify your identity without disclosing any personal information. This has uses in access control, digital signatures, and online authentication.
Proof of Ownership ZKPs can be used to demonstrate ownership of a certain asset without divulging any details about the asset itself. This has uses for protecting intellectual property, managing supply chains, and owning digital assets.
Financial Exchanges Without disclosing any details about the transaction itself, ZKPs can be used to validate financial transactions. Cryptocurrency, internet payments, and other digital financial transactions can all use this.
By enabling parties to make calculations on the data without disclosing the data itself, Data Privacy ZKPs can be used to preserve the privacy of sensitive data. Applications for this can be found in the financial, healthcare, and other sectors that handle sensitive data.
By enabling voters to confirm that their vote was counted without disclosing how they voted, elections ZKPs can be used to ensure the integrity of elections. This is applicable to electronic voting, including internet voting.
Cryptography Modern cryptography's ZKPs are a potent instrument that enable secure communication and authentication. This can be used for encrypted messaging and other purposes in the business sector as well as for military and intelligence operations.
Proofs of Zero Knowledge and Compliance
Kubernetes and regulatory compliance use ZKPs in many ways. Examples:
Security for Kubernetes ZKPs offer a mechanism to authenticate nodes without disclosing any sensitive information, enhancing the security of Kubernetes clusters. ZKPs, for instance, can be used to verify, without disclosing the specifics of the program, that the nodes in a Kubernetes cluster are running permitted software.
Compliance Inspection Without disclosing any sensitive information, ZKPs can be used to demonstrate compliance with rules like the GDPR, HIPAA, and PCI DSS. ZKPs, for instance, can be used to demonstrate that data has been encrypted and stored securely without divulging the specifics of the mechanism employed for either encryption or storage.
Access Management Without disclosing any private data, ZKPs can be used to offer safe access control to Kubernetes resources. ZKPs can be used, for instance, to demonstrate that a user has the necessary permissions to access a particular Kubernetes resource without disclosing the details of those permissions.
Safe Data Exchange Without disclosing any sensitive information, ZKPs can be used to securely transmit data between Kubernetes clusters or between several businesses. ZKPs, for instance, can be used to demonstrate the sharing of a specific piece of data between two parties without disclosing the details of the data itself.
Kubernetes deployments audited Without disclosing the specifics of the deployment or the data being processed, ZKPs can be used to demonstrate that Kubernetes deployments are working as planned. This can be helpful for auditing purposes and for ensuring that Kubernetes deployments are operating as planned.
ZKPs preserve data and maintain regulatory compliance by letting parties prove things without revealing sensitive information. ZKPs will be used more in Kubernetes as it grows.

Jon Brosio
3 years ago
You can learn more about marketing from these 8 copywriting frameworks than from a college education.
Email, landing pages, and digital content

Today's most significant skill:
Copywriting.
Unfortunately, most people don't know how to write successful copy because they weren't taught in school.
I've been obsessed with copywriting for two years. I've read 15 books, completed 3 courses, and studied internet's best digital entrepreneurs.
Here are 8 copywriting frameworks that educate more than a four-year degree.
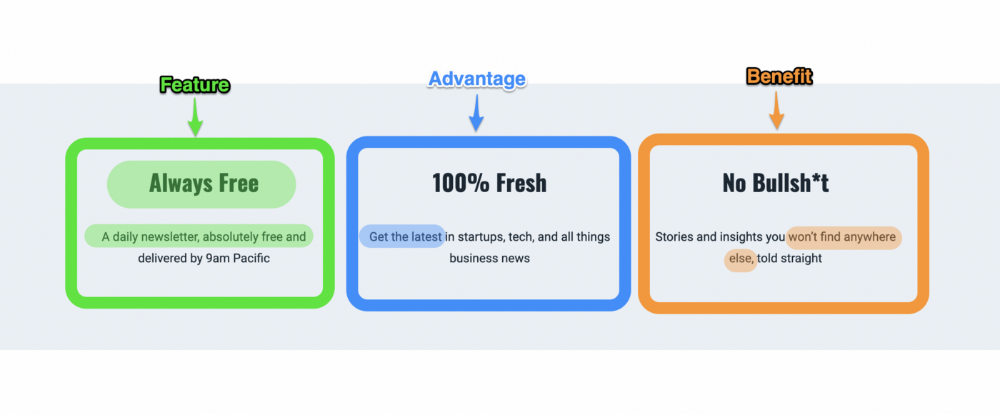
1. Feature — Advantage — Benefit (F.A.B)
This is the most basic copywriting foundation. Email marketing, landing page copy, and digital video ads can use it.
F.A.B says:
How it works (feature)
which is helpful (advantage)
What's at stake (benefit)
The Hustle uses this framework on their landing page to convince people to sign up:
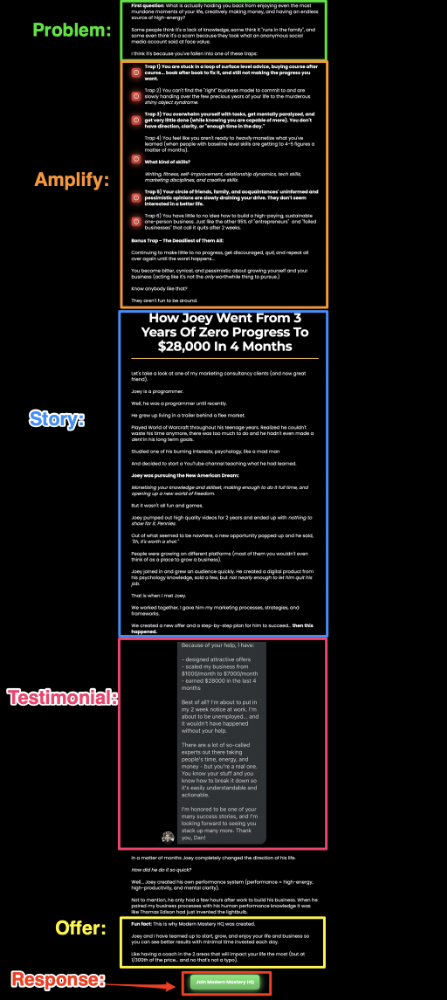
2. P. A. S. T. O. R.
This framework is for longer-form copywriting. PASTOR uses stories to engage with prospects. It explains why people should buy this offer.
PASTOR means:
Problem
Amplify
Story
Testimonial
Offer
Response
Dan Koe's landing page is a great example. It shows PASTOR frame-by-frame.
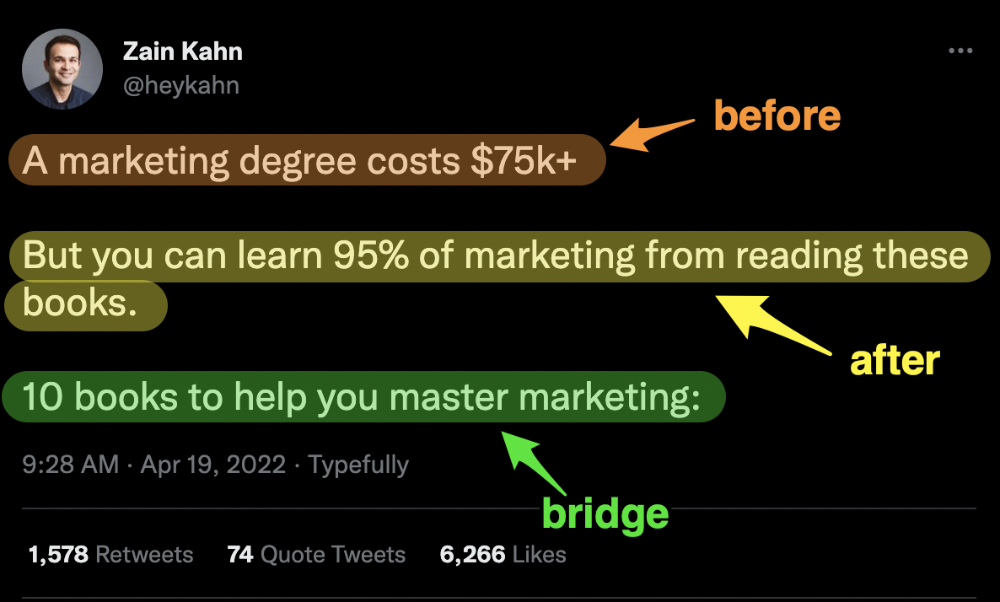
3. Before — After — Bridge
Before-after-bridge is a copywriting framework that draws attention and shows value quickly.
This framework highlights:
where you are
where you want to be
how to get there
Works great for: Email threads/landing pages
Zain Kahn utilizes this framework to write viral threads.
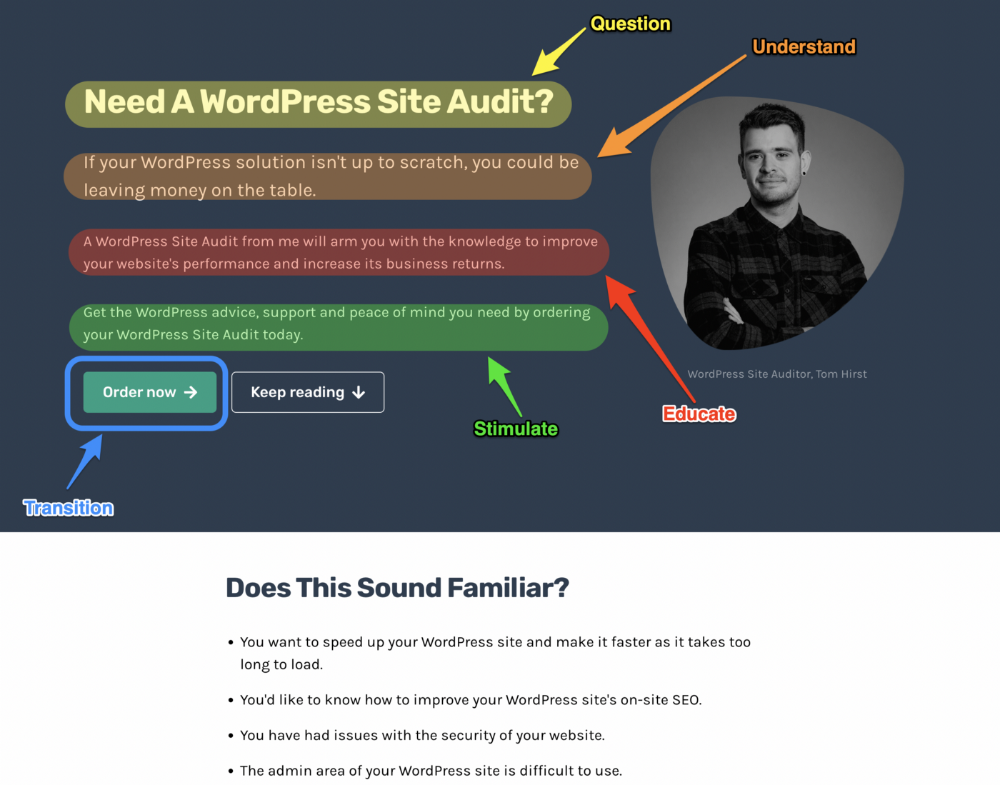
4. Q.U.E.S.T
QUEST is about empathetic writing. You know their issues, obstacles, and headaches. This allows coverups.
QUEST:
Qualifies
Understands
Educates
Stimulates
Transitions
Tom Hirst's landing page uses the QUEST framework.
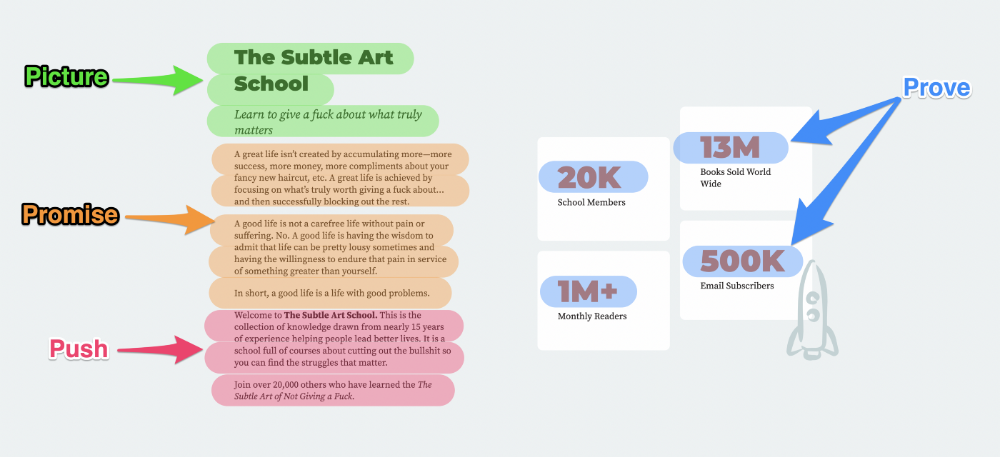
5. The 4P’s model
The 4P’s approach pushes your prospect to action. It educates and persuades quickly.
4Ps:
The problem the visitor is dealing with
The promise that will help them
The proof the promise works
A push towards action
Mark Manson is a bestselling author, digital creator, and pop-philosopher. He's also a great copywriter, and his membership offer uses the 4P’s framework.
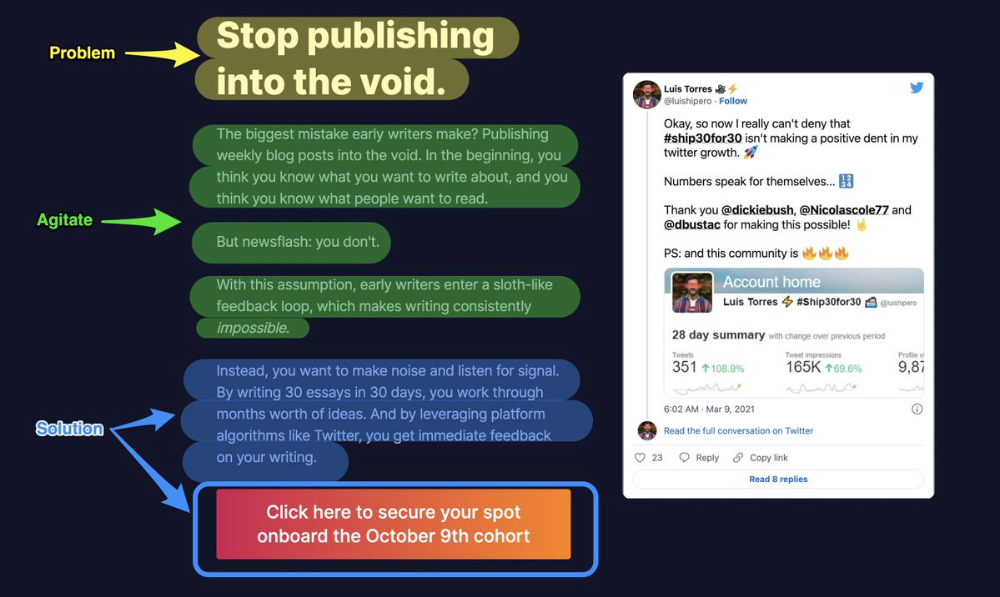
6. Problem — Agitate — Solution (P.A.S)
Up-and-coming marketers should understand problem-agitate-solution copywriting. Once you understand one structure, others are easier. It drives passion and presents a clear solution.
PAS outlines:
The issue the visitor is having
It then intensifies this issue through emotion.
finally offers an answer to that issue (the offer)
The customer's story loops. Nicolas Cole and Dickie Bush use PAS to promote Ship 30 for 30.
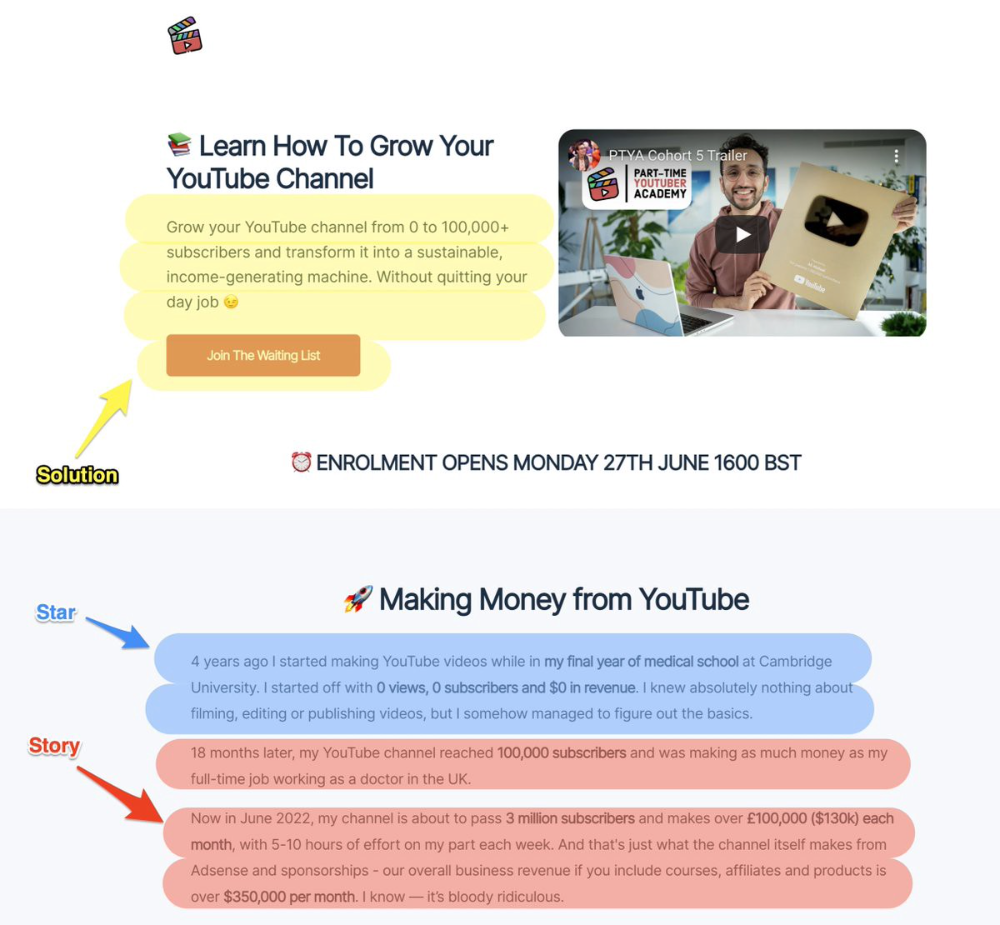
7. Star — Story — Solution (S.S.S)
PASTOR + PAS = star-solution-story. Like PAS, it employs stories to persuade.
S.S.S. is effective storytelling:
Star: (Person had a problem)
Story: (until they had a breakthrough)
Solution: (That created a transformation)
Ali Abdaal is a YouTuber with a great S.S.S copy.
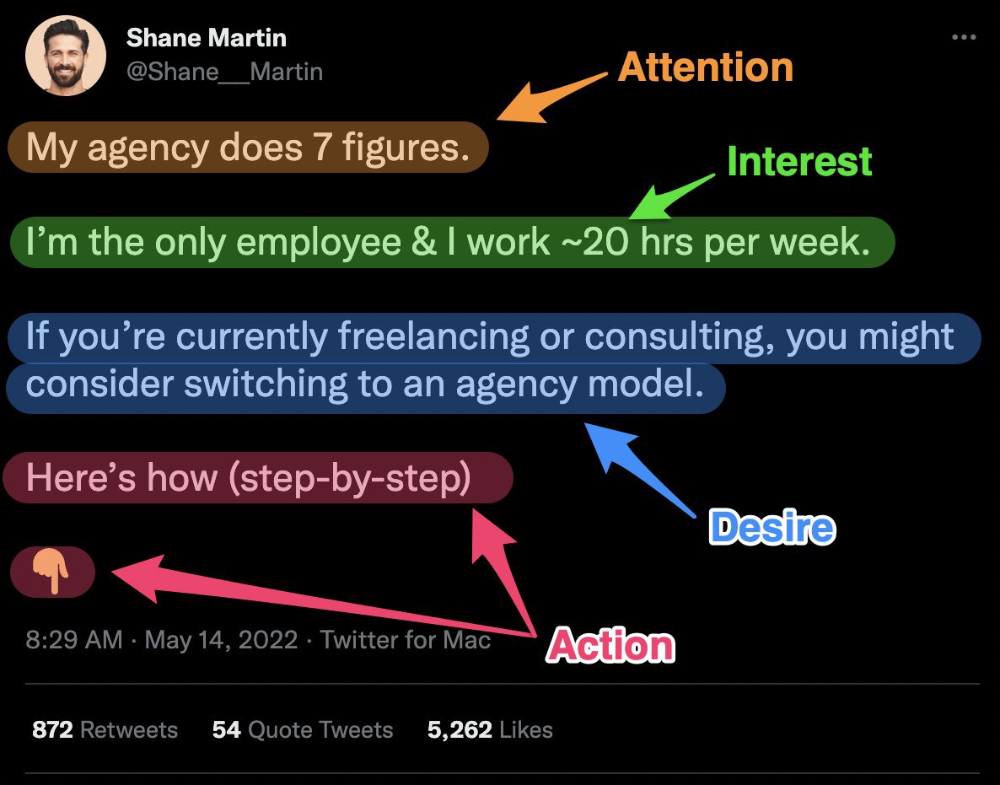
8. Attention — Interest — Desire — Action
AIDA is another classic. This copywriting framework is great for fast-paced environments (think all digital content on Linkedin, Twitter, Medium, etc.).
It works with:
Page landings
writing on thread
Email
It's a good structure since it's concise, attention-grabbing, and action-oriented.
Shane Martin, Twitter's creator, uses this approach to create viral content.
TL;DR
8 copywriting frameworks that teach marketing better than a four-year degree
Feature-advantage-benefit
Before-after-bridge
Star-story-solution
P.A.S.T.O.R
Q.U.E.S.T
A.I.D.A
P.A.S
4P’s

CyberPunkMetalHead
3 years ago
Developed an automated cryptocurrency trading tool for nearly a year before unveiling it this month.


Overview
I'm happy to provide this important update. We've worked on this for a year and a half, so I'm glad to finally write it. We named the application AESIR because we’ve love Norse Mythology. AESIR automates and runs trading strategies.
Volatility, technical analysis, oscillators, and other signals are currently supported by AESIR.
Additionally, we enhanced AESIR's ability to create distinctive bespoke signals by allowing it to analyze many indicators and produce a single signal.
AESIR has a significant social component that allows you to copy the best-performing public setups and use them right away.
Enter your email here to be notified when AEISR launches.
Views on algorithmic trading
First, let me clarify. Anyone who claims algorithmic trading platforms are money-printing plug-and-play devices is a liar. Algorithmic trading platforms are a collection of tools.
A trading algorithm won't make you a competent trader if you lack a trading strategy and yolo your funds without testing. It may hurt your trade. Test and alter your plans to account for market swings, but comprehend market signals and trends.
Status Report
Throughout closed beta testing, we've communicated closely with users to design a platform they want to use.
To celebrate, we're giving you free Aesir Viking NFTs and we cover gas fees.
Why use a trading Algorithm?
Automating a successful manual approach
experimenting with and developing solutions that are impossible to execute manually
One AESIR strategy lets you buy any cryptocurrency that rose by more than x% in y seconds.
AESIR can scan an exchange for coins that have gained more than 3% in 5 minutes. It's impossible to manually analyze over 1000 trading pairings every 5 minutes. Auto buy dips or DCA around a Dip
Sneak Preview
Here's the Leaderboard, where you can clone the best public settings.
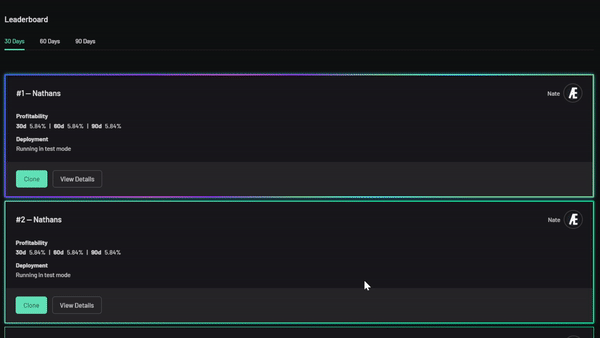
As a tiny, self-funded team, we're excited to unveil our product. It's a beta release, so there's still more to accomplish, but we know where we stand.
If this sounds like a project that you might want to learn more about, you can sign up to our newsletter and be notified when AESIR launches.
Useful Links:
Join the Discord | Join our subreddit | Newsletter | Mint Free NFT