


More on Marketing

Victoria Kurichenko
3 years ago
What Happened After I Posted an AI-Generated Post on My Website
This could cost you.

Content creators may have heard about Google's "Helpful content upgrade."
This change is another Google effort to remove low-quality, repetitive, and AI-generated content.
Why should content creators care?
Because too much content manipulates search results.
My experience includes the following.
Website admins seek high-quality guest posts from me. They send me AI-generated text after I say "yes." My readers are irrelevant. Backlinks are needed.
Companies copy high-ranking content to boost their Google rankings. Unfortunately, it's common.
What does this content offer?
Nothing.
Despite Google's updates and efforts to clean search results, webmasters create manipulative content.
As a marketer, I knew about AI-powered content generation tools. However, I've never tried them.
I use old-fashioned content creation methods to grow my website from 0 to 3,000 monthly views in one year.
Last year, I launched a niche website.
I do keyword research, analyze search intent and competitors' content, write an article, proofread it, and then optimize it.
This strategy is time-consuming.
But it yields results!
Here's proof from Google Analytics:

Proven strategies yield promising results.
To validate my assumptions and find new strategies, I run many experiments.
I tested an AI-powered content generator.
I used a tool to write this Google-optimized article about SEO for startups.
I wanted to analyze AI-generated content's Google performance.
Here are the outcomes of my test.
First, quality.
I dislike "meh" content. I expect articles to answer my questions. If not, I've wasted my time.
My essays usually include research, personal anecdotes, and what I accomplished and achieved.
AI-generated articles aren't as good because they lack individuality.
Read my AI-generated article about startup SEO to see what I mean.
It's dry and shallow, IMO.
It seems robotic.
I'd use quotes and personal experience to show how SEO for startups is different.
My article paraphrases top-ranked articles on a certain topic.
It's readable but useless. Similar articles abound online. Why read it?
AI-generated content is low-quality.
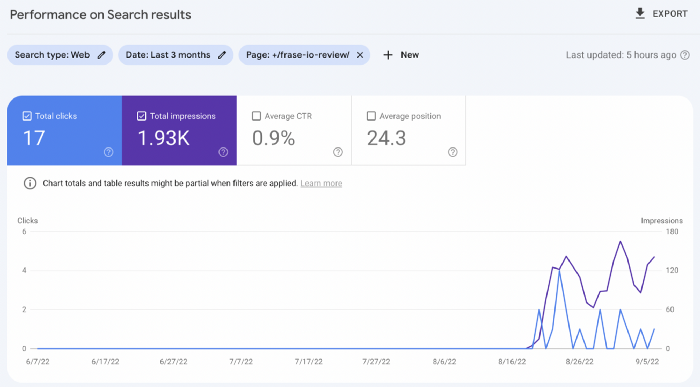
Let me show you how this content ranks on Google.
The Google Search Console report shows impressions, clicks, and average position.

Low numbers.
No one opens the 5th Google search result page to read the article. Too far!
You may say the new article will improve.
Marketing-wise, I doubt it.
This article is shorter and less comprehensive than top-ranking pages. It's unlikely to win because of this.
AI-generated content's terrible reality.
I'll compare how this content I wrote for readers and SEO performs.
Both the AI and my article are fresh, but trends are emerging.
My article's CTR and average position are higher.
I spent a week researching and producing that piece, unlike AI-generated content. My expert perspective and unique consequences make it interesting to read.
Human-made.
In summary
No content generator can duplicate a human's tone, writing style, or creativity. Artificial content is always inferior.
Not "bad," but inferior.
Demand for content production tools will rise despite Google's efforts to eradicate thin content.
Most won't spend hours producing link-building articles. Costly.
As guest and sponsored posts, artificial content will thrive.
Before accepting a new arrangement, content creators and website owners should consider this.

Jon Brosio
3 years ago
You can learn more about marketing from these 8 copywriting frameworks than from a college education.
Email, landing pages, and digital content

Today's most significant skill:
Copywriting.
Unfortunately, most people don't know how to write successful copy because they weren't taught in school.
I've been obsessed with copywriting for two years. I've read 15 books, completed 3 courses, and studied internet's best digital entrepreneurs.
Here are 8 copywriting frameworks that educate more than a four-year degree.
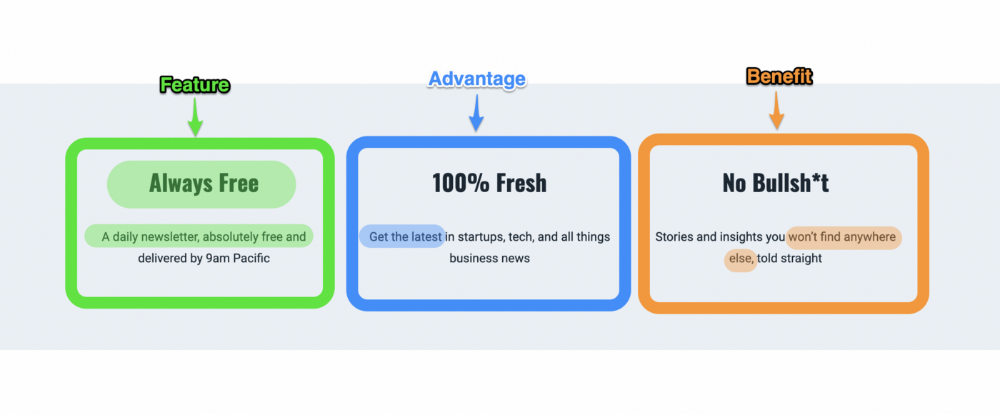
1. Feature — Advantage — Benefit (F.A.B)
This is the most basic copywriting foundation. Email marketing, landing page copy, and digital video ads can use it.
F.A.B says:
How it works (feature)
which is helpful (advantage)
What's at stake (benefit)
The Hustle uses this framework on their landing page to convince people to sign up:
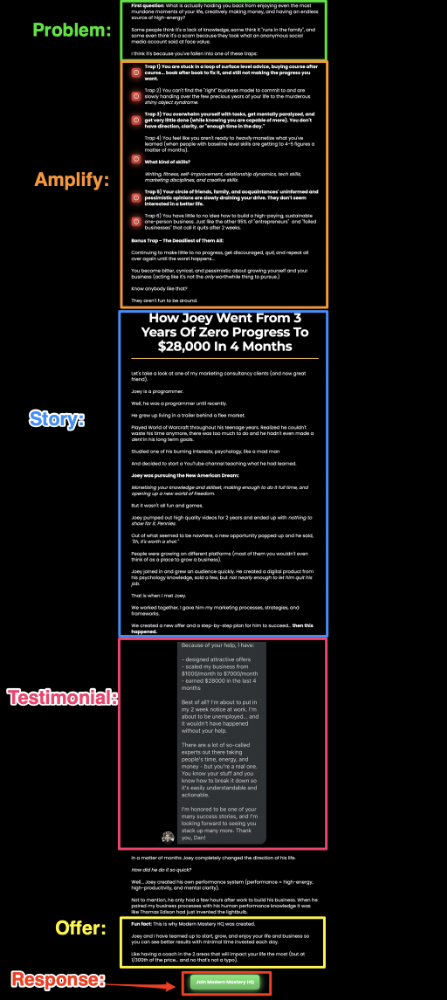
2. P. A. S. T. O. R.
This framework is for longer-form copywriting. PASTOR uses stories to engage with prospects. It explains why people should buy this offer.
PASTOR means:
Problem
Amplify
Story
Testimonial
Offer
Response
Dan Koe's landing page is a great example. It shows PASTOR frame-by-frame.
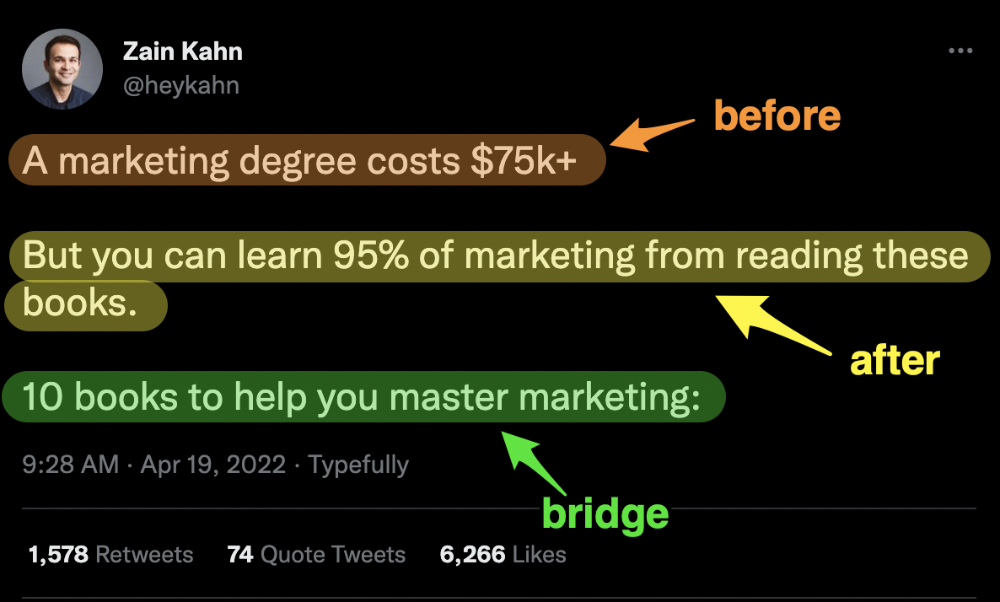
3. Before — After — Bridge
Before-after-bridge is a copywriting framework that draws attention and shows value quickly.
This framework highlights:
where you are
where you want to be
how to get there
Works great for: Email threads/landing pages
Zain Kahn utilizes this framework to write viral threads.
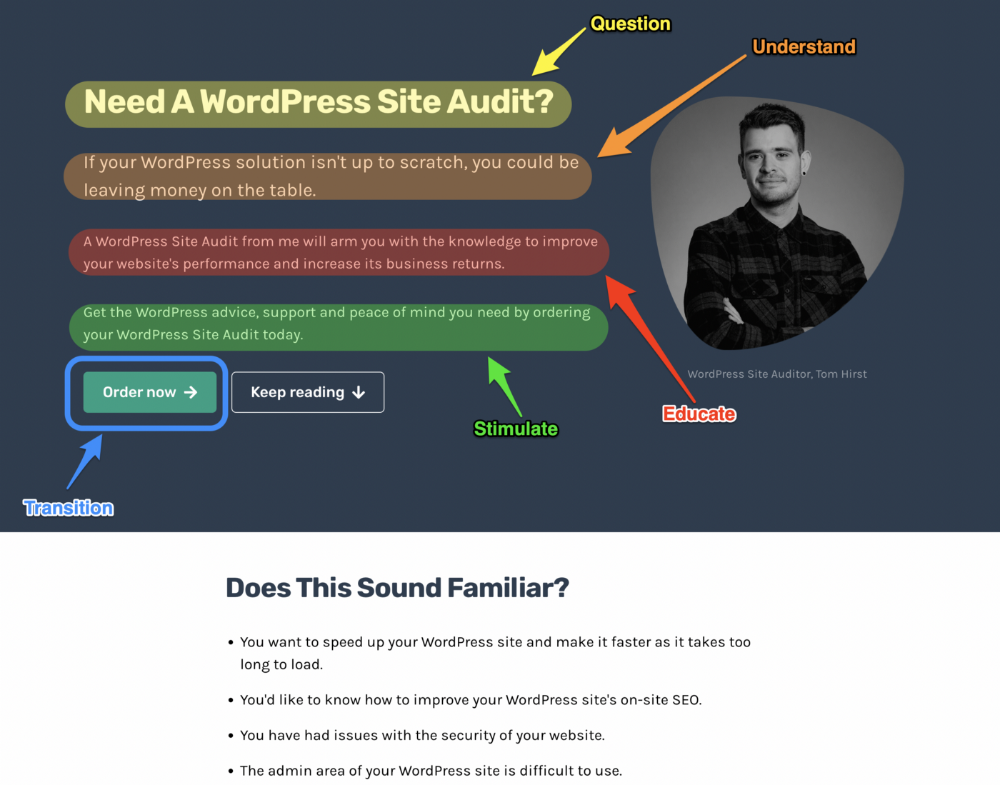
4. Q.U.E.S.T
QUEST is about empathetic writing. You know their issues, obstacles, and headaches. This allows coverups.
QUEST:
Qualifies
Understands
Educates
Stimulates
Transitions
Tom Hirst's landing page uses the QUEST framework.
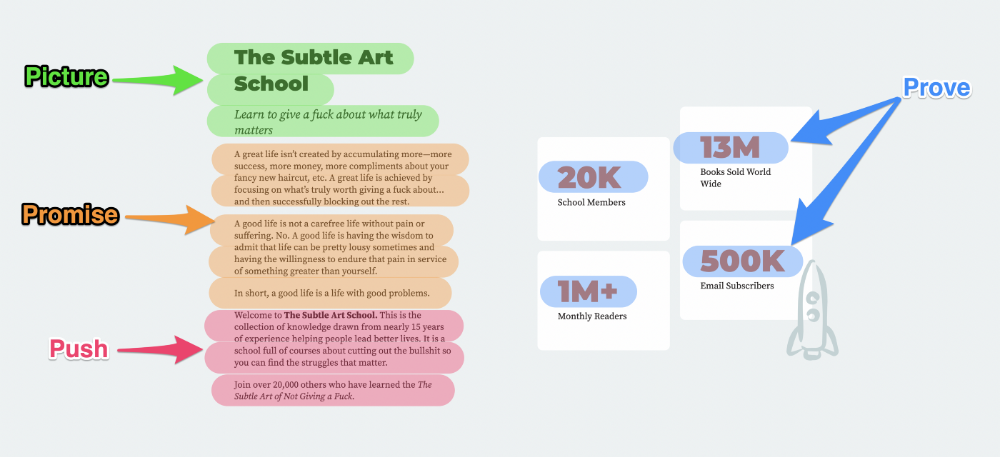
5. The 4P’s model
The 4P’s approach pushes your prospect to action. It educates and persuades quickly.
4Ps:
The problem the visitor is dealing with
The promise that will help them
The proof the promise works
A push towards action
Mark Manson is a bestselling author, digital creator, and pop-philosopher. He's also a great copywriter, and his membership offer uses the 4P’s framework.
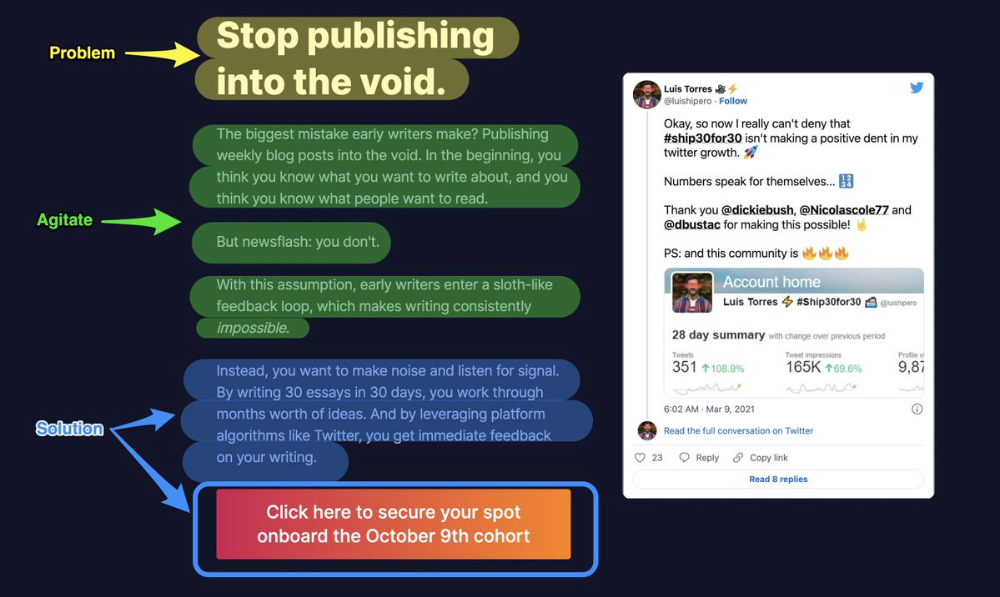
6. Problem — Agitate — Solution (P.A.S)
Up-and-coming marketers should understand problem-agitate-solution copywriting. Once you understand one structure, others are easier. It drives passion and presents a clear solution.
PAS outlines:
The issue the visitor is having
It then intensifies this issue through emotion.
finally offers an answer to that issue (the offer)
The customer's story loops. Nicolas Cole and Dickie Bush use PAS to promote Ship 30 for 30.
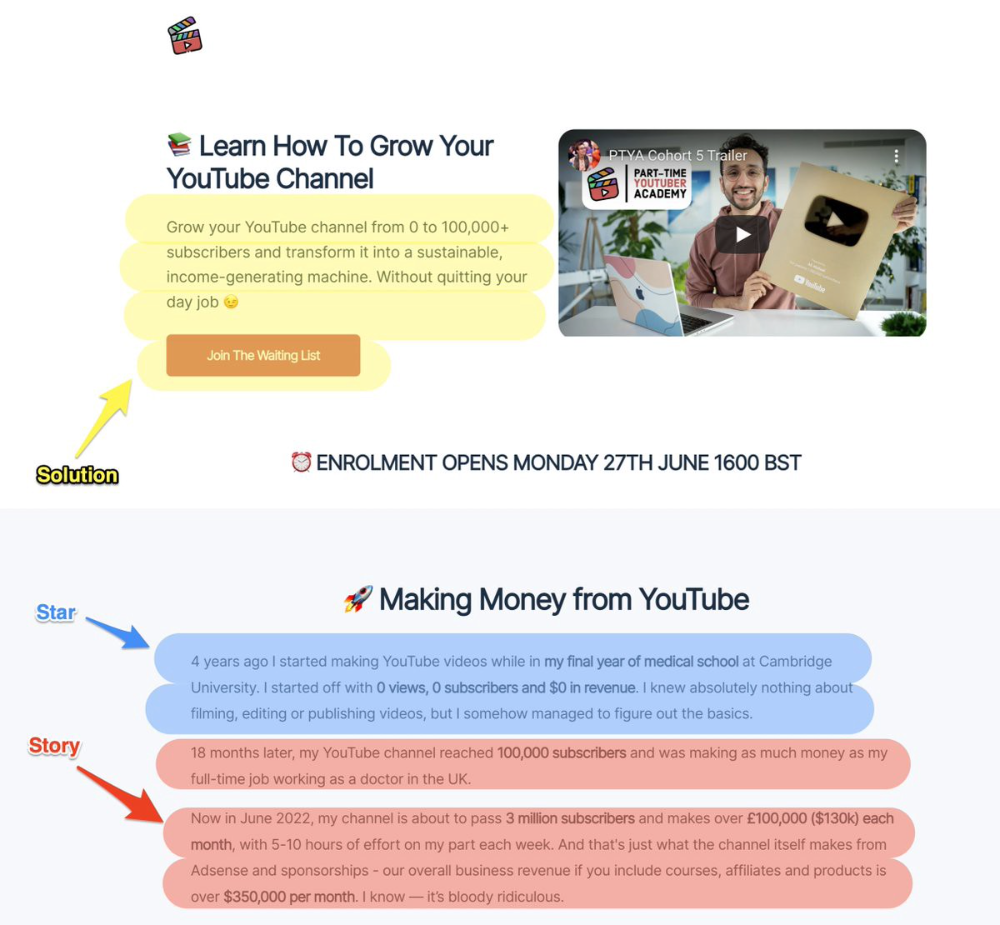
7. Star — Story — Solution (S.S.S)
PASTOR + PAS = star-solution-story. Like PAS, it employs stories to persuade.
S.S.S. is effective storytelling:
Star: (Person had a problem)
Story: (until they had a breakthrough)
Solution: (That created a transformation)
Ali Abdaal is a YouTuber with a great S.S.S copy.
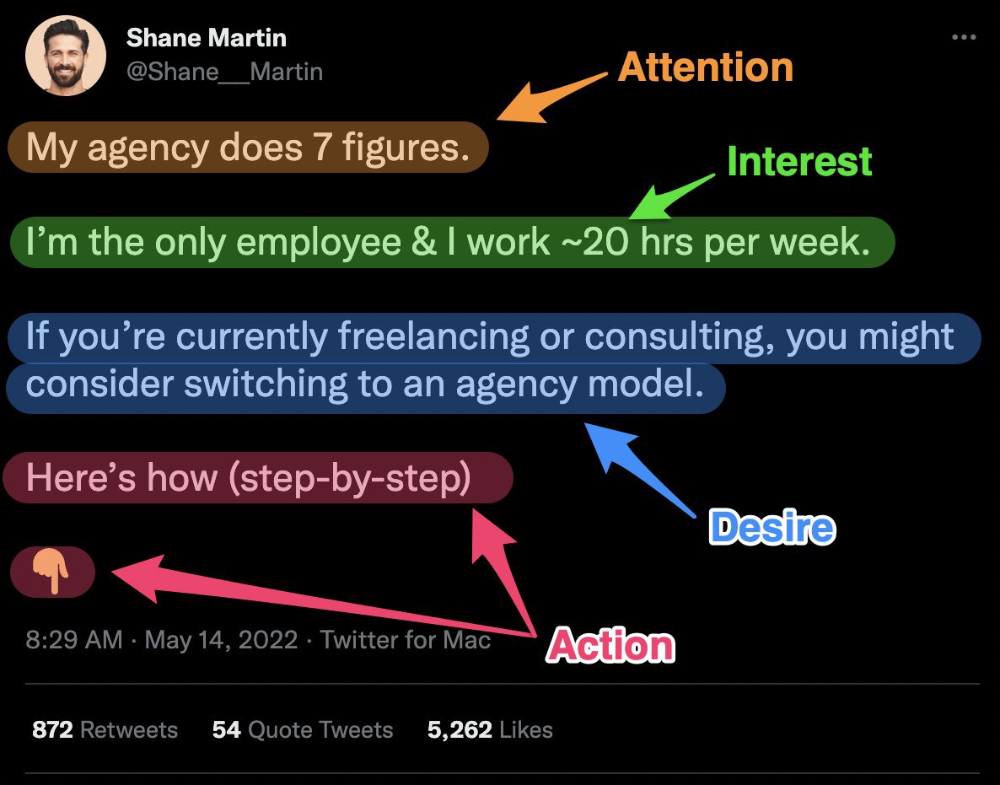
8. Attention — Interest — Desire — Action
AIDA is another classic. This copywriting framework is great for fast-paced environments (think all digital content on Linkedin, Twitter, Medium, etc.).
It works with:
Page landings
writing on thread
Email
It's a good structure since it's concise, attention-grabbing, and action-oriented.
Shane Martin, Twitter's creator, uses this approach to create viral content.
TL;DR
8 copywriting frameworks that teach marketing better than a four-year degree
Feature-advantage-benefit
Before-after-bridge
Star-story-solution
P.A.S.T.O.R
Q.U.E.S.T
A.I.D.A
P.A.S
4P’s

obimy.app
3 years ago
How TikTok helped us grow to 6 million users
This resulted to obimy's new audience.
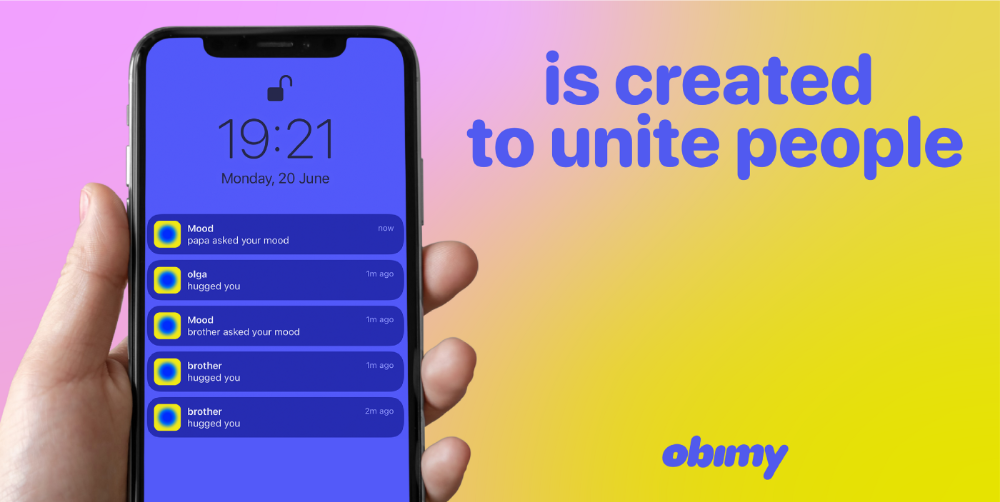
Hi! obimy's official account. Here, we'll teach app developers and marketers. In 2022, our downloads increased dramatically, so we'll share what we learned.
obimy is what we call a ‘senseger’. It's a new method to communicate digitally. Instead of text, obimy users connect through senses and moods. Feeling playful? Flirt with your partner, pat a pal, or dump water on a classmate. Each feeling is an interactive animation with vibration. It's a wordless app. App Store and Google Play have obimy.
We had 20,000 users in 2022. Two to five thousand of them opened the app monthly. Our DAU metric was 500.
We have 6 million users after 6 months. 500,000 individuals use obimy daily. obimy was the top lifestyle app this week in the U.S.
And TikTok helped.
TikTok fuels obimys' growth. It's why our app exploded. How and what did we learn? Our Head of Marketing, Anastasia Avramenko, knows.
our actions prior to TikTok
We wanted to achieve product-market fit through organic expansion. Quora, Reddit, Facebook Groups, Facebook Ads, Google Ads, Apple Search Ads, and social media activity were tested. Nothing worked. Our CPI was sometimes $4, so unit economics didn't work.
We studied our markets and made audience hypotheses. We promoted our goods and studied our audience through social media quizzes. Our target demographic was Americans in long-distance relationships. I designed quizzes like Test the Strength of Your Relationship to better understand the user base. After each quiz, we encouraged users to download the app to enhance their connection and bridge the distance.
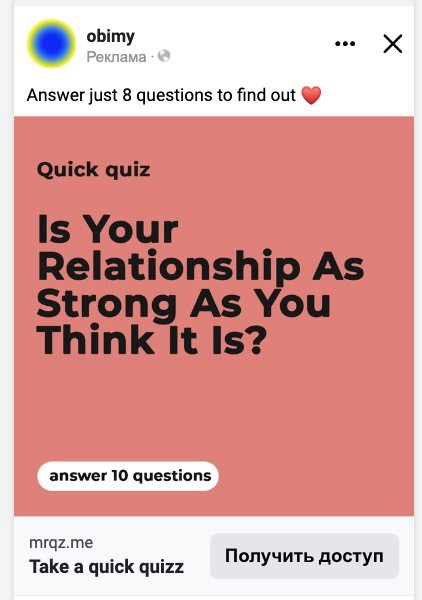
We got 1,000 responses for $50. This helped us comprehend the audience's grief and coping strategies (aka our rivals). I based action items on answers given. If you can't embrace a loved one, use obimy.
We also tried Facebook and Google ads. From the start, we knew it wouldn't work.
We were desperate to discover a free way to get more users.
Our journey to TikTok
TikTok is a great venue for emerging creators. It also helped reach people. Before obimy, my TikTok videos garnered 12 million views without sponsored promotion.
We had to act. TikTok was required.
I wasn't a TikTok user before obimy. Initially, I uploaded promotional content. Call-to-actions appear strange next to dancing challenges and my money don't jiggle jiggle. I learned TikTok. Watch TikTok for an hour was on my to-do list. What a dream job!
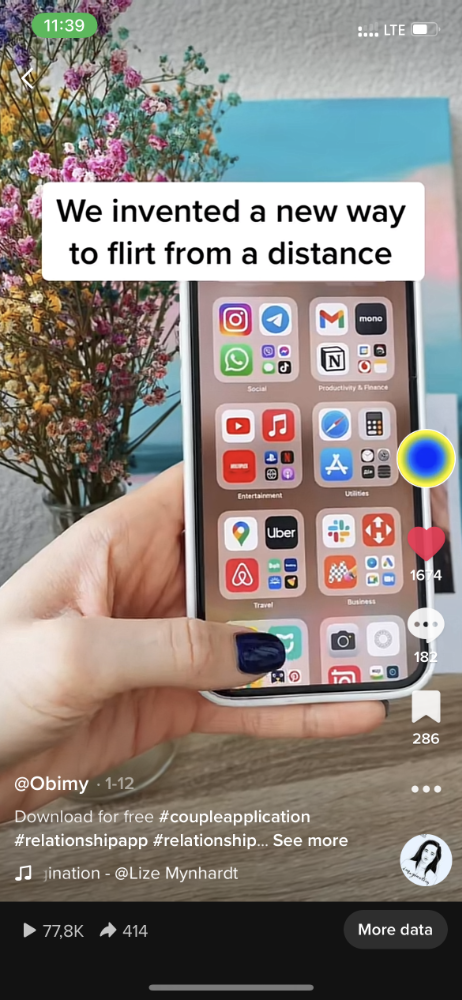
Our most popular movies presented the app alongside text outlining what it does. We started promoting them in Europe and the U.S. and got a 16% CTR and $1 CPI, an improvement over our previous efforts.
Somehow, we were expanding. So we came up with new hypotheses, calls to action, and content.
Four months passed, yet we saw no organic growth.
Russia attacked Ukraine.
Our app aimed to be helpful. For now, we're focusing on our Ukrainian audience. I posted sloppy TikToks illustrating how obimy can help during shelling or air raids.
In two hours, Kostia sent me our visitor count. Our servers crashed.
Initially, we had several thousand daily users. Over 200,000 users joined obimy in a week. They posted obimy videos on TikTok, drawing additional users. We've also resumed U.S. video promotion.
We gained 2,000,000 new members with less than $100 in ads, primarily in the U.S. and U.K.
TikTok helped.
The figures
We were confident we'd chosen the ideal tool for organic growth.
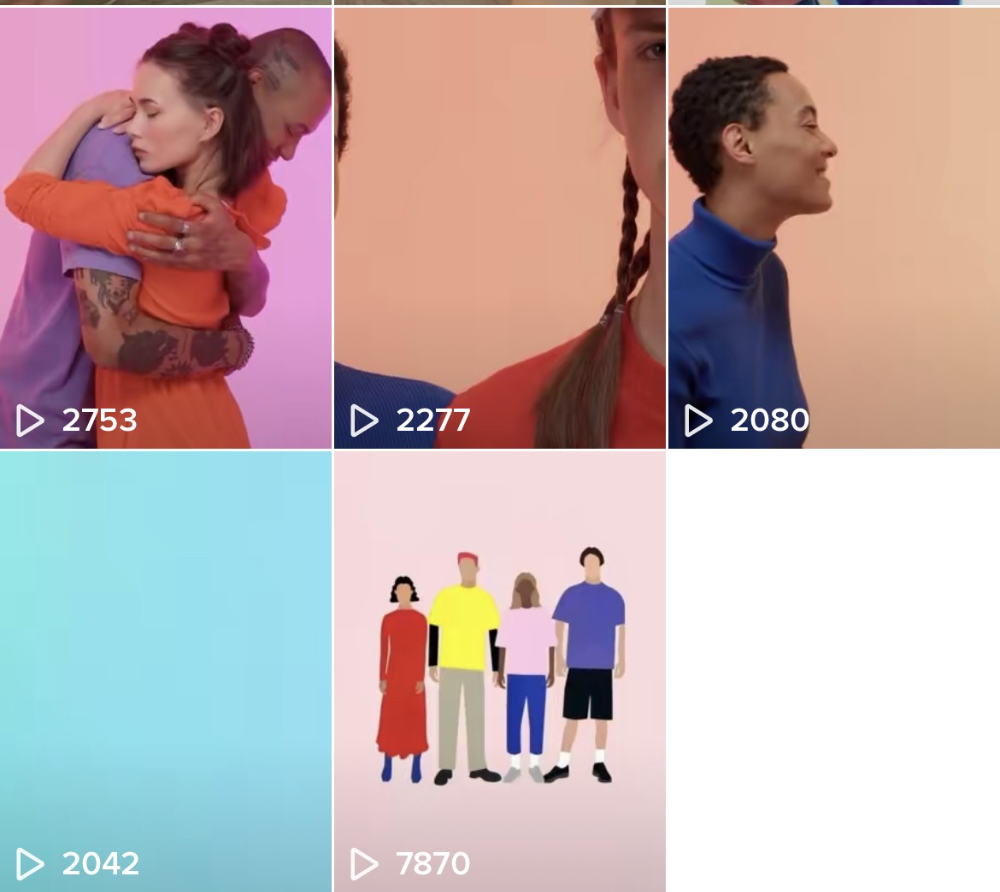
Over 45 million people have viewed our own videos plus a ton of user-generated content with the hashtag #obimy.
About 375 thousand people have liked all of our individual videos.
The number of downloads and the virality of videos are directly correlated.
Where are we now?
TikTok fuels our organic growth. We post 56 videos every week and pay to promote viral content.
We use UGC and influencers. We worked with Universal Music Italy on Eurovision. They offered to promote us through their million-follower TikTok influencers. We thought their followers would improve our audience, but it didn't matter. Integration didn't help us. Users that share obimy videos with their followers can reach several million views, which affects our download rate.
After the dust settled, we determined our key audience was 13-18-year-olds. They want to express themselves, but it's sometimes difficult. We're searching for methods to better engage with our users. We opened a Discord server to discuss anime and video games and gather app and content feedback.
TikTok helps us test product updates and hypotheses. Example: I once thought we might raise MAU by prompting users to add strangers as friends. Instead of asking our team to construct it, I made a TikTok urging users to share invite URLs. Users share links under every video we upload, embracing people worldwide.
Key lessons
Don't direct-sell. TikTok isn't for Instagram, Facebook, or YouTube promo videos. Conventional advertisements don't fit. Most users will swipe up and watch humorous doggos.
More product videos are better. Finally. So what?
Encourage interaction. Tagging friends in comments or making videos with the app promotes it more than any marketing spend.
Be odd and risqué. A user mistakenly sent a French kiss to their mom in one of our most popular videos.
TikTok helps test hypotheses and build your user base. It also helps develop apps. In our upcoming blog, we'll guide you through obimy's design revisions based on TikTok. Follow us on Twitter, Instagram, and TikTok.
You might also like

Sukhad Anand
3 years ago
How Do Discord's Trillions Of Messages Get Indexed?
They depend heavily on open source..

Discord users send billions of messages daily. Users wish to search these messages. How do we index these to search by message keywords?
Let’s find out.
Discord utilizes Elasticsearch. Elasticsearch is a free, open search engine for textual, numerical, geographical, structured, and unstructured data. Apache Lucene powers Elasticsearch.
How does elastic search store data? It stores it as numerous key-value pairs in JSON documents.
How does elastic search index? Elastic search's index is inverted. An inverted index lists every unique word in every page and where it appears.
4. Elasticsearch indexes documents and generates an inverted index to make data searchable in near real-time. The index API adds or updates JSON documents in a given index.
Let's examine how discord uses Elastic Search. Elasticsearch prefers bulk indexing. Discord couldn't index real-time messages. You can't search posted messages. You want outdated messages.
6. Let's check what bulk indexing requires.
1. A temporary queue for incoming communications.
2. Indexer workers that index messages into elastic search.
Discord's queue is Celery. The queue is open-source. Elastic search won't run on a single server. It's clustered. Where should a message go? Where?
8. A shard allocator decides where to put the message. Nevertheless. Shattered? A shard combines elastic search and index on. So, these two form a shard which is used as a unit by discord. The elastic search itself has some shards. But this is different, so don’t get confused.
Now, the final part is service discovery — to discover the elastic search clusters and the hosts within that cluster. This, they do with the help of etcd another open source tool.
A great thing to notice here is that discord relies heavily on open source systems and their base implementations which is very different from a lot of other products.

CyberPunkMetalHead
3 years ago
195 countries want Terra Luna founder Do Kwon
Interpol has issued a red alert on Terraform Labs' CEO, South Korean prosecutors said.

After the May crash of Terra Luna revealed tax evasion issues, South Korean officials filed an arrest warrant for Do Kwon, but he is missing.
Do Kwon is now a fugitive in 195 countries after Seoul prosecutors placed him to Interpol's red list. Do Kwon hasn't commented since then. The red list allows any country's local authorities to apprehend Do Kwon.
Do Dwon and Terraform Labs were believed to have moved to Singapore days before the $40 billion wipeout, but Singapore authorities said he fled the country on September 17. Do Kwon tweeted that he wasn't on the run and cited privacy concerns.
Do Kwon was not on the red list at the time and said he wasn't "running," only to reply to his own tweet saying he hasn't jogged in a while and needed to trim calories.
Whether or not it makes sense to read too much into this, the reality is that Do Kwon is now on Interpol red list, despite the firmly asserts on twitter that he does absolutely nothing to hide.
UPDATE:
South Korean authorities are investigating alleged withdrawals of over $60 million U.S. and seeking to freeze these assets. Korean authorities believe a new wallet exchanged over 3000 BTC through OKX and Kucoin.
Do Kwon and the Luna Foundation Guard (of whom Do Kwon is a key member of) have declined all charges and dubbed this disinformation.
Singapore's Luna Foundation Guard (LFG) manages the Terra Ecosystem.
The Legal Situation
Multiple governments are searching for Do Kwon and five other Terraform Labs employees for financial markets legislation crimes.
South Korean authorities arrested a man suspected of tax fraud and Ponzi scheme.
The U.S. SEC is also examining Terraform Labs on how UST was advertised as a stablecoin. No legal precedent exists, so it's unclear what's illegal.
The future of Terraform Labs, Terra, and Terra 2 is unknown, and despite what Twitter shills say about LUNC, the company remains in limbo awaiting a decision that will determine its fate. This project isn't a wise investment.

Faisal Khan
3 years ago
4 typical methods of crypto market manipulation

Market fraud
Due to its decentralized and fragmented character, the crypto market has integrity difficulties.
Cryptocurrencies are an immature sector, therefore market manipulation becomes a bigger issue. Many research have attempted to uncover these abuses. CryptoCompare's newest one highlights some of the industry's most typical scams.
Why are these concerns so common in the crypto market? First, even the largest centralized exchanges remain unregulated due to industry immaturity. A low-liquidity market segment makes an attack more harmful. Finally, market surveillance solutions not implemented reduce transparency.
In CryptoCompare's latest exchange benchmark, 62.4% of assessed exchanges had a market surveillance system, although only 18.1% utilised an external solution. To address market integrity, this measure must improve dramatically. Before discussing the report's malpractices, note that this is not a full list of attacks and hacks.
Clean Trading
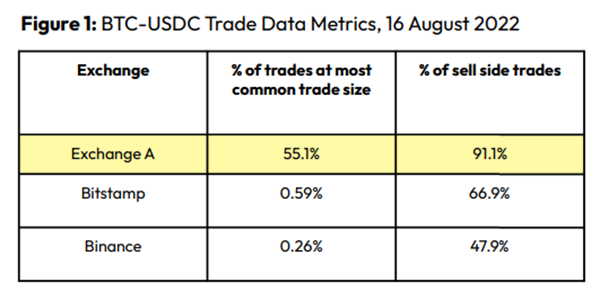
An investor buys and sells concurrently to increase the asset's price. Centralized and decentralized exchanges show this misconduct. 23 exchanges have a volume-volatility correlation < 0.1 during the previous 100 days, according to CryptoCompares. In August 2022, Exchange A reported $2.5 trillion in artificial and/or erroneous volume, up from $33.8 billion the month before.
Spoofing
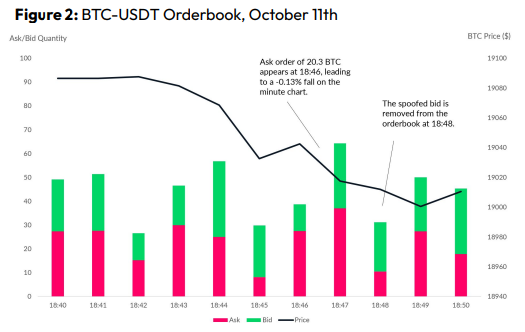
Criminals create and cancel fake orders before they can be filled. Since manipulators can hide in larger trading volumes, larger exchanges have more spoofing. A trader placed a 20.8 BTC ask order at $19,036 when BTC was trading at $19,043. BTC declined 0.13% to $19,018 in a minute. At 18:48, the trader canceled the ask order without filling it.
Front-Running
Most cryptocurrency front-running involves inside trading. Traditional stock markets forbid this. Since most digital asset information is public, this is harder. Retailers could utilize bots to front-run.
CryptoCompare found digital wallets of people who traded like insiders on exchange listings. The figure below shows excess cumulative anomalous returns (CAR) before a coin listing on an exchange.

Finally, LAYERING is a sequence of spoofs in which successive orders are put along a ladder of greater (layering offers) or lower (layering bids) values. The paper concludes with recommendations to mitigate market manipulation. Exchange data transparency, market surveillance, and regulatory oversight could reduce manipulative tactics.