


Plagiarism on OpenSea: humans and computers
OpenSea, a non-fungible token (NFT) marketplace, is fighting plagiarism. A new “two-pronged” approach will aim to root out and remove copies of authentic NFTs and changes to its blue tick verified badge system will seek to enhance customer confidence.
According to a blog post, the anti-plagiarism system will use algorithmic detection of “copymints” with human reviewers to keep it in check.
Last year, NFT collectors were duped into buying flipped images of the popular BAYC collection, according to The Verge. The largest NFT marketplace had to remove its delay pay minting service due to an influx of copymints.
80% of NFTs removed by the platform were minted using its lazy minting service, which kept the digital asset off-chain until the first purchase.
NFTs copied from popular collections are opportunistic money-grabs. Right-click, save, and mint the jacked JPEGs that are then flogged as an authentic NFT.
The anti-plagiarism system will scour OpenSea's collections for flipped and rotated images, as well as other undescribed permutations. The lack of detail here may be a deterrent to scammers, or it may reflect the new system's current rudimentary nature.
Thus, human detectors will be needed to verify images flagged by the detection system and help train it to work independently.
“Our long-term goal with this system is two-fold: first, to eliminate all existing copymints on OpenSea, and second, to help prevent new copymints from appearing,” it said.
“We've already started delisting identified copymint collections, and we'll continue to do so over the coming weeks.”
It works for Twitter, why not OpenSea
OpenSea is also changing account verification. Early adopters will be invited to apply for verification if their NFT stack is worth $100 or more. OpenSea plans to give the blue checkmark to people who are active on Twitter and Discord.
This is just the beginning. We are committed to a future where authentic creators can be verified, keeping scammers out.
Also, collections with a lot of hype and sales will get a blue checkmark. For example, a new NFT collection sold by the verified BAYC account will have a blue badge to verify its legitimacy.
New requests will be responded to within seven days, according to OpenSea.
These programs and products help protect creators and collectors while ensuring our community can confidently navigate the world of NFTs.
By elevating authentic content and removing plagiarism, these changes improve trust in the NFT ecosystem, according to OpenSea.
OpenSea is indeed catching up with the digital art economy. Last August, DevianArt upgraded its AI image recognition system to find stolen tokenized art on marketplaces like OpenSea.
It scans all uploaded art and compares it to “public blockchain events” like Ethereum NFTs to detect stolen art.
More on NFTs & Art

Alex Carter
3 years ago
Metaverse, Web 3, and NFTs are BS
Most crypto is probably too.

The goals of Web 3 and the metaverse are admirable and attractive. Who doesn't want an internet owned by users? Who wouldn't want a digital realm where anything is possible? A better way to collaborate and visit pals.
Companies pursue profits endlessly. Infinite growth and revenue are expected, and if a corporation needs to sacrifice profits to safeguard users, the CEO, board of directors, and any executives will lose to the system of incentives that (1) retains workers with shares and (2) makes a company answerable to all of its shareholders. Only the government can guarantee user protections, but we know how successful that is. This is nothing new, just a problem with modern capitalism and tech platforms that a user-owned internet might remedy. Moxie, the founder of Signal, has a good articulation of some of these current Web 2 tech platform problems (but I forget the timestamp); thoughts on JRE aside, this episode is worth listening to (it’s about a bunch of other stuff too).
Moxie Marlinspike, founder of Signal, on the Joe Rogan Experience podcast.
Source: https://open.spotify.com/episode/2uVHiMqqJxy8iR2YB63aeP?si=4962b5ecb1854288
Web 3 champions are premature. There was so much spectacular growth during Web 2 that the next wave of founders want to make an even bigger impact, while investors old and new want a chance to get a piece of the moonshot action. Worse, crypto enthusiasts believe — and financially need — the fact of its success to be true, whether or not it is.
I’m doubtful that it will play out like current proponents say. Crypto has been the white-hot focus of SV’s best and brightest for a long time yet still struggles to come up any mainstream use case other than ‘buy, HODL, and believe’: a store of value for your financial goals and wishes. Some kind of the metaverse is likely, but will it be decentralized, mostly in VR, or will Meta (previously FB) play a big role? Unlikely.
METAVERSE
The metaverse exists already. Our digital lives span apps, platforms, and games. I can design a 3D house, invite people, use Discord, and hang around in an artificial environment. Millions of gamers do this in Rust, Minecraft, Valheim, and Animal Crossing, among other games. Discord's voice chat and Slack-like servers/channels are the present social anchor, but the interface, integrations, and data portability will improve. Soon you can stream YouTube videos on digital house walls. You can doodle, create art, play Jackbox, and walk through a door to play Apex Legends, Fortnite, etc. Not just gaming. Digital whiteboards and screen sharing enable real-time collaboration. They’ll review code and operate enterprises. Music is played and made. In digital living rooms, they'll watch movies, sports, comedy, and Twitch. They'll tweet, laugh, learn, and shittalk.
The metaverse is the evolution of our digital life at home, the third place. The closest analog would be Discord and the integration of Facebook, Slack, YouTube, etc. into a single, 3D, customizable hangout space.
I'm not certain this experience can be hugely decentralized and smoothly choreographed, managed, and run, or that VR — a luxury, cumbersome, and questionably relevant technology — must be part of it. Eventually, VR will be pragmatic, achievable, and superior to real life in many ways. A total sensory experience like the Matrix or Sword Art Online, where we're physically hooked into the Internet yet in our imaginations we're jumping, flying, and achieving athletic feats we never could in reality; exploring realms far grander than our own (as grand as it is). That VR is different from today's.

Ben Thompson released an episode of Exponent after Facebook changed its name to Meta. Ben was suspicious about many metaverse champion claims, but he made a good analogy between Oculus and the PC. The PC was initially far too pricey for the ordinary family to afford. It began as a business tool. It got so powerful and pervasive that it affected our personal life. Price continues to plummet and so much consumer software was produced that it's impossible to envision life without a home computer (or in our pockets). If Facebook shows product market fit with VR in business, through use cases like remote work and collaboration, maybe VR will become practical in our personal lives at home.
Before PCs, we relied on Blockbuster, the Yellow Pages, cabs to get to the airport, handwritten taxes, landline phones to schedule social events, and other archaic methods. It is impossible for me to conceive what VR, in the form of headsets and hand controllers, stands to give both professional and especially personal digital experiences that is an order of magnitude better than what we have today. Is looking around better than using a mouse to examine a 3D landscape? Do the hand controls make x10 or x100 work or gaming more fun or efficient? Will VR replace scalable Web 2 methods and applications like Web 1 and Web 2 did for analog? I don't know.
My guess is that the metaverse will arrive slowly, initially on displays we presently use, with more app interoperability. I doubt that it will be controlled by the people or by Facebook, a corporation that struggles to properly innovate internally, as practically every large digital company does. Large tech organizations are lousy at hiring product-savvy employees, and if they do, they rarely let them explore new things.
These companies act like business schools when they seek founders' results, with bureaucracy and dependency. Which company launched the last popular consumer software product that wasn't a clone or acquisition? Recent examples are scarce.
Web 3
Investors and entrepreneurs of Web 3 firms are declaring victory: 'Web 3 is here!' Web 3 is the future! Many profitable Web 2 enterprises existed when Web 2 was defined. The word was created to explain user behavior shifts, not a personal pipe dream.
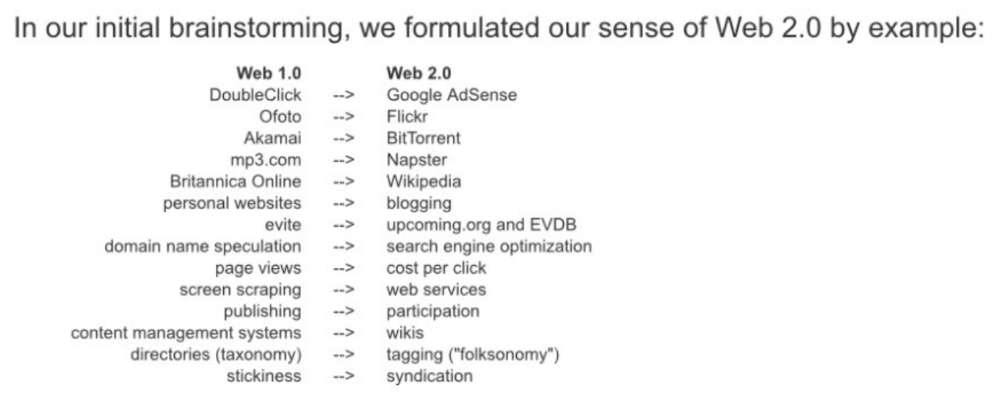
Origins of Web 2: http://www.oreilly.com/pub/a/web2/archive/what-is-web-20.html
One of these Web 3 startups may provide the connecting tissue to link all these experiences or become one of the major new digital locations. Even so, successful players will likely use centralized power arrangements, as Web 2 businesses do now. Some Web 2 startups integrated our digital lives. Rockmelt (2010–2013) was a customizable browser with bespoke connectors to every program a user wanted; imagine seeing Facebook, Twitter, Discord, Netflix, YouTube, etc. all in one location. Failure. Who knows what Opera's doing?
Silicon Valley and tech Twitter in general have a history of jumping on dumb bandwagons that go nowhere. Dot-com crash in 2000? The huge deployment of capital into bad ideas and businesses is well-documented. And live video. It was the future until it became a niche sector for gamers. Live audio will play out a similar reality as CEOs with little comprehension of audio and no awareness of lasting new user behavior deceive each other into making more and bigger investments on fool's gold. Twitter trying to buy Clubhouse for $4B, Spotify buying Greenroom, Facebook exploring live audio and 'Tiktok for audio,' and now Amazon developing a live audio platform. This live audio frenzy won't be worth their time or energy. Blind guides blind. Instead of learning from prior failures like Twitter buying Periscope for $100M pre-launch and pre-product market fit, they're betting on unproven and uncompelling experiences.
NFTs
NFTs are also nonsense. Take Loot, a time-limited bag drop of "things" (text on the blockchain) for a game that didn't exist, bought by rich techies too busy to play video games and foolish enough to think they're getting in early on something with a big reward. What gaming studio is incentivized to use these items? Who's encouraged to join? No one cares besides Loot owners who don't have NFTs. Skill, merit, and effort should be rewarded with rare things for gamers. Even if a small minority of gamers can make a living playing, the average game's major appeal has never been to make actual money - that's a profession.
No game stays popular forever, so how is this objective sustainable? Once popularity and usage drop, exclusive crypto or NFTs will fall. And if NFTs are designed to have cross-game appeal, incentives apart, 30 years from now any new game will need millions of pre-existing objects to build around before they start. It doesn’t work.
Many games already feature item economies based on real in-game scarcity, generally for cosmetic things to avoid pay-to-win, which undermines scaled gaming incentives for huge player bases. Counter-Strike, Rust, etc. may be bought and sold on Steam with real money. Since the 1990s, unofficial cross-game marketplaces have sold in-game objects and currencies. NFTs aren't needed. Making a popular, enjoyable, durable game is already difficult.
With NFTs, certain JPEGs on the internet went from useless to selling for $69 million. Why? Crypto, Web 3, early Internet collectibles. NFTs are digital Beanie Babies (unlike NFTs, Beanie Babies were a popular children's toy; their destinies are the same). NFTs are worthless and scarce. They appeal to crypto enthusiasts seeking for a practical use case to support their theory and boost their own fortune. They also attract to SV insiders desperate not to miss the next big thing, not knowing what it will be. NFTs aren't about paying artists and creators who don't get credit for their work.
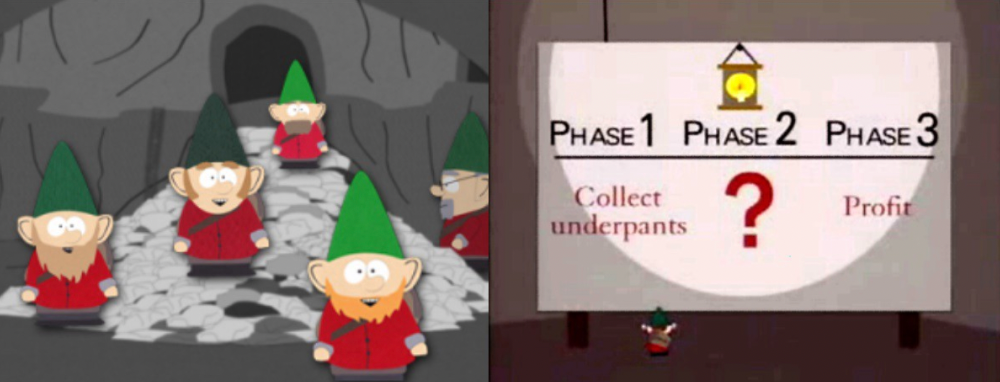
South Park's Underpants Gnomes
NFTs are a benign, foolish plan to earn money on par with South Park's underpants gnomes. At worst, they're the world of hucksterism and poor performers. Or those with money and enormous followings who, like everyone, don't completely grasp cryptocurrencies but are motivated by greed and status and believe Gary Vee's claim that CryptoPunks are the next Facebook. Gary's watertight logic: if NFT prices dip, they're on the same path as the most successful corporation in human history; buy the dip! NFTs aren't businesses or museum-worthy art. They're bs.

Gary Vee compares NFTs to Amazon.com. vm.tiktok.com/TTPdA9TyH2
We grew up collecting: Magic: The Gathering (MTG) cards printed in the 90s are now worth over $30,000. Imagine buying a digital Magic card with no underlying foundation. No one plays the game because it doesn't exist. An NFT is a contextless image someone conned you into buying a certificate for, but anyone may copy, paste, and use. Replace MTG with Pokemon for younger readers.
When Gary Vee strongarms 30 tech billionaires and YouTube influencers into buying CryptoPunks, they'll talk about it on Twitch, YouTube, podcasts, Twitter, etc. That will convince average folks that the product has value. These guys are smart and/or rich, so I'll get in early like them. Cryptography is similar. No solid, scaled, mainstream use case exists, and no one knows where it's headed, but since the global crypto financial bubble hasn't burst and many people have made insane fortunes, regular people are putting real money into something that is highly speculative and could be nothing because they want a piece of the action. Who doesn’t want free money? Rich techies and influencers won't be affected; normal folks will.
Imagine removing every $1 invested in Bitcoin instantly. What would happen? How far would Bitcoin fall? Over 90%, maybe even 95%, and Bitcoin would be dead. Bitcoin as an investment is the only scalable widespread use case: it's confidence that a better use case will arise and that being early pays handsomely. It's like pouring a trillion dollars into a company with no business strategy or users and a CEO who makes vague future references.
New tech and efforts may provoke a 'get off my lawn' mentality as you approach 40, but I've always prided myself on having a decent bullshit detector, and it's flying off the handle at this foolishness. If we can accomplish a functional, responsible, equitable, and ethical user-owned internet, I'm for it.
Postscript:
I wanted to summarize my opinions because I've been angry about this for a while but just sporadically tweeted about it. A friend handed me a Dan Olson YouTube video just before publication. He's more knowledgeable, articulate, and convincing about crypto. It's worth seeing:
This post is a summary. See the original one here.

Stephen Moore
3 years ago
Trading Volume on OpenSea Drops by 99% as the NFT Boom Comes to an End
Wasn't that a get-rich-quick scheme?

OpenSea processed $2.7 billion in NFT transactions in May 2021.
Fueled by a crypto bull run, rumors of unfathomable riches, and FOMO, Bored Apes, Crypto Punks, and other JPEG-format trash projects flew off the virtual shelves, snatched up by retail investors and celebrities alike.
Over a year later, those shelves are overflowing and warehouses are backlogged. Since March, I've been writing less. In May and June, the bubble was close to bursting.
Apparently, the boom has finally peaked.
This bubble has punctured, and deflation has begun. On Aug. 28, OpenSea processed $9.34 million.
From that euphoric high of $2.7 billion, $9.34 million represents a spectacular decline of 99%.
OpenSea contradicts the data. A trading platform spokeswoman stated the comparison is unfair because it compares the site's highest and lowest trading days. They're the perfect two data points to assess the drop. OpenSea chooses to use ETH volume measures, which ignore crypto's shifting price. Since January 2022, monthly ETH volume has dropped 140%, according to Dune.
Unconvincing counterargument.
Further OpenSea indicators point to declining NFT demand:
Since January 2022, daily user visits have decreased by 50%.
Daily transactions have decreased by 50% since the beginning of the year in the same manner.
Off-platform, the floor price of Bored Apes has dropped from 145 ETH to 77 ETH. (At $4,800, a reduction from $700,000 to $370,000). Google search data shows waning popular interest.
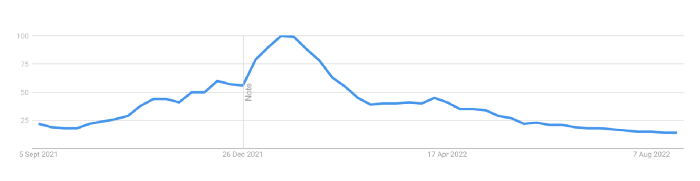
It is a trend that will soon vanish, just like laser eyes.
NFTs haven't moved since the new year. Eminem and Snoop Dogg can utilize their apes in music videos or as 3D visuals to perform at the VMAs, but the reality is that NFTs have lost their public appeal and the market is trying to regain its footing.
They've lost popularity because?
Breaking records. The technology still lacks genuine use cases a year and a half after being popular.
They're pricey prestige symbols that have made a few people rich through cunning timing or less-than-savory scams or rug pulling. Over $10.5 billion has been taken through frauds, most of which are NFT enterprises promising to be the next Bored Apes, according to Web3 is going wonderfully. As the market falls, many ordinary investors realize they purchased into a self-fulfilling ecosystem that's halted. Many NFTs are sold between owner-held accounts to boost their price, data suggests. Most projects rely on social media excitement to debut with a high price before the first owners sell and chuckle to the bank. When they don't, the initiative fails, leaving investors high and dry.
NFTs are fading like laser eyes. Most people pushing the technology don't believe in it or the future it may bring. No, they just need a Kool-Aid-drunk buyer.
Everybody wins. When your JPEGs are worth 99% less than when you bought them, you've lost.
When demand reaches zero, many will lose.
Eric Esposito
3 years ago
$100M in NFT TV shows from Fox

Fox executives will invest $100 million in NFT-based TV shows. Fox brought in "Rick and Morty" co-creator Dan Harmon to create "Krapopolis"
Fox's Blockchain Creative Labs (BCL) will develop these NFT TV shows with Bento Box Entertainment. BCL markets Fox's WWE "Moonsault" NFT.
Fox said it would use the $100 million to build a "creative community" and "brand ecosystem." The media giant mentioned using these funds for NFT "benefits."
"Krapopolis" will be a Greek-themed animated comedy, per Rarity Sniper. Initial reports said NFT buyers could collaborate on "character development" and get exclusive perks.
Fox Entertainment may drop "Krapopolis" NFTs on Ethereum, according to new reports. Fox says it will soon release more details on its NFT plans for "Krapopolis."
Media Giants Favor "NFT Storytelling"
"Krapopolis" is one of the largest "NFT storytelling" experiments due to Dan Harmon's popularity and Fox Entertainment's reach. Many celebrities have begun exploring Web3 for TV shows.
Mila Kunis' animated sitcom "The Gimmicks" lets fans direct the show. Any "Gimmick" NFT holder could contribute to episode plots.
"The Gimmicks" lets NFT holders write fan fiction about their avatars. If show producers like what they read, their NFT may appear in an episode.
Rob McElhenney recently launched "Adimverse," a Web3 writers' community. Anyone with a "Adimverse" NFT can collaborate on creative projects and share royalties.
Many blue-chip NFTs are appearing in movies and TV shows. Coinbase will release Bored Ape Yacht Club shorts at NFT. NYC. Reese Witherspoon is working on a World of Women NFT series.
PFP NFT collections have Hollywood media partners. Guy Oseary manages Madonna's World of Women and Bored Ape Yacht Club collections. The Doodles signed with Billboard's Julian Holguin and the Cool Cats with CAA.
Web3 and NFTs are changing how many filmmakers tell stories.
You might also like

Alex Mathers
25 years ago
400 articles later, nobody bothered to read them.

Writing for readers:
14 years of daily writing.
I post practically everything on social media. I authored hundreds of articles, thousands of tweets, and numerous volumes to almost no one.
Tens of thousands of readers regularly praise me.
I despised writing. I'm stuck now.
I've learned what readers like and what doesn't.
Here are some essential guidelines for writing with impact:
Readers won't understand your work if you can't.
Though obvious, this slipped me up. Share your truths.
Stories engage human brains.
Showing the journey of a person from worm to butterfly inspires the human spirit.
Overthinking hinders powerful writing.
The best ideas come from inner understanding in between thoughts.
Avoid writing to find it. Write.
Writing a masterpiece isn't motivating.
Write for five minutes to simplify. Step-by-step, entertaining, easy steps.
Good writing requires a willingness to make mistakes.
So write loads of garbage that you can edit into a good piece.
Courageous writing.
A courageous story will move readers. Personal experience is best.
Go where few dare.
Templates, outlines, and boundaries help.
Limitations enhance writing.
Excellent writing is straightforward and readable, removing all the unnecessary fat.
Use five words instead of nine.
Use ordinary words instead of uncommon ones.
Readers desire relatability.
Too much perfection will turn it off.
Write to solve an issue if you can't think of anything to write.
Instead, read to inspire. Best authors read.
Every tweet, thread, and novel must have a central idea.
What's its point?
This can make writing confusing.
️ Don't direct your reader.
Readers quit reading. Demonstrate, describe, and relate.
Even if no one responds, have fun. If you hate writing it, the reader will too.

Jano le Roux
3 years ago
The Real Reason Adobe Just Paid $20 billion for Figma
Sketch or Figma?
Designers are pissed.
The beast ate the beauty.
Figma deserves $20B.
Do designers deserve Adobe?
Adobe devours new creative tools and spits them out with a slimy Adobe aftertaste.
Frame.io — $1.3B
Magento — $1.7B
Macromedia — $3.6B
Nothing compares to the risky $20B acquisition.
If they can't be beaten, buy them.
And then make them boring.
Adobe's everywhere.
Like that friend who dabbles in everything creatively, there's not enough time to master one thing.
Figma was Adobe's thigh-mounted battle axe.
a UX design instrument with a sizable free tier.
a UX design tool with a simple and quick user interface.
a tool for fluid collaboration in user experience design.
a web-based UX design tool that functions well.
a UX design tool with a singular goal of perfection.
UX design software that replaced Adobe XD.
Adobe XD could do many of Figma's things, but it didn't focus on the details. This is a major issue when working with detail-oriented professionals.
UX designers.
Design enthusiasts first used Figma. More professionals used it. Institutions taught it. Finally, major brands adopted Figma.
Adobe hated that.
Adobe dispatched a team of lawyers to resolve the Figma issue, as big companies do. Figma didn’t bite for months.
Oh no.
Figma resisted.
Figma helped designers leave Adobe. Figma couldn't replace Photoshop, but most designers used it to remove backgrounds.
Online background removal tools improved.
The Figma problem grew into a thorn, a knife, and a battle ax in Adobe's soft inner thigh.
Figma appeared to be going public. Adobe couldn’t allow that. It bought Figma for $20B during the IPO drought.
Adobe has a new issue—investors are upset.
The actual cause of investors' ire toward Adobe
Spoiler: The math just doesn’t add up.
According to Adobe's press release, Figma's annual recurring revenue (ARR) is $400M and growing rapidly.
The $20B valuation requires a 50X revenue multiple, which is unheard of.
Venture capitalists typically use:
10% to 29% growth per year: ARR multiplied by 1 to 5
30% to 99% growth per year: ARR multiplied by 6 to 10
100% to 400% growth per year: ARR multiplied by 10 to 20
Showing an investor a 50x multiple is like telling friends you saw a UFO. They'll think you're crazy.
Adobe's stock fell immediately after the acquisition because it didn't make sense to a number-cruncher.
Designers started a Tweet storm in the digital town hall where VCs and designers often meet.
Adobe acquired Workfront for $1.5 billion at the end of 2020. This purchase made sense for investors.
Many investors missed the fact that Adobe is acquiring Figma not only for its ARR but also for its brilliant collaboration tech.
Adobe could use Figmas web app technology to make more products web-based to compete with Canva.
Figma's high-profile clients could switch to Adobe's enterprise software.
However, questions arise:
Will Adobe make Figma boring?
Will Adobe tone down Figma to boost XD?
Would you ditch Adobe and Figma for Sketch?

Sammy Abdullah
3 years ago
R&D, S&M, and G&A expense ratios for SaaS
SaaS spending is 40/40/20. 40% of operating expenses should be R&D, 40% sales and marketing, and 20% G&A. We wanted to see the statistics behind the rules of thumb. Since October 2017, 73 SaaS startups have gone public. Perhaps the rule of thumb should be 30/50/20. The data is below.
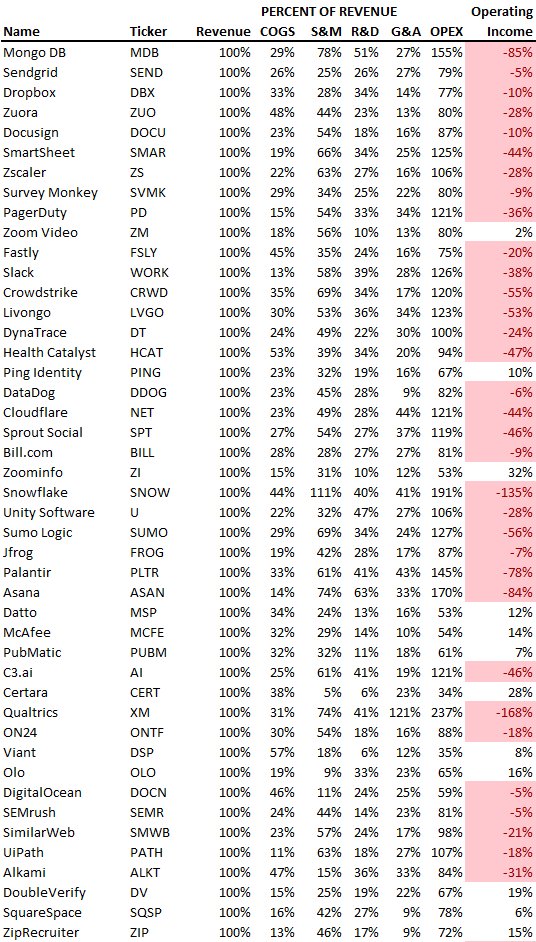
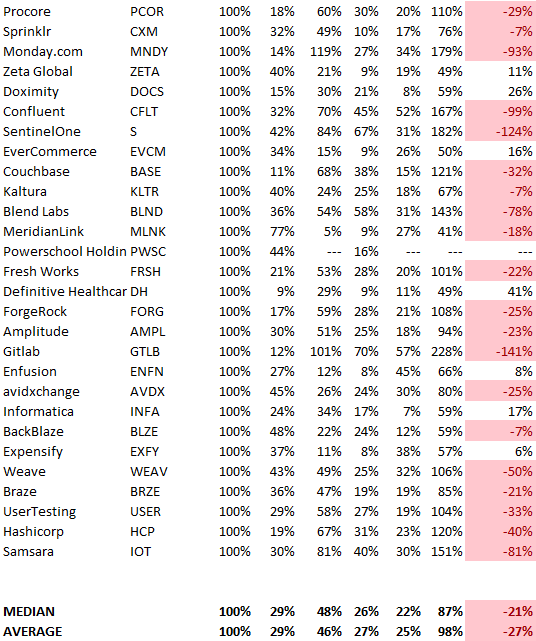
30/50/20. R&D accounts for 26% of opex, sales and marketing 48%, and G&A 22%. We think R&D/S&M/G&A should be 30/50/20.
There are outliers. There are exceptions to rules of thumb. Dropbox spent 45% on R&D whereas Zoom spent 13%. Zoom spent 73% on S&M, Dropbox 37%, and Bill.com 28%. Snowflake spent 130% of revenue on S&M, while their EBITDA margin is -192%.
G&A shouldn't stand out. Minimize G&A spending. Priorities should be product development and sales. Cloudflare, Sendgrid, Snowflake, and Palantir spend 36%, 34%, 37%, and 43% on G&A.
Another myth is that COGS is 20% of revenue. Median and averages are 29%.
Where is the profitability? Data-driven operating income calculations were simplified (Revenue COGS R&D S&M G&A). 20 of 73 IPO businesses reported operational income. Median and average operating income margins are -21% and -27%.
As long as you're growing fast, have outstanding retention, and marquee clients, you can burn cash since recurring income that doesn't churn is a valuable annuity.
The data was compelling overall. 30/50/20 is the new 40/40/20 for more established SaaS enterprises, unprofitability is alright as long as your business is expanding, and COGS can be somewhat more than 20% of revenue.