



More on Web3 & Crypto

Nabil Alouani
3 years ago
Why Cryptocurrency Is Not Dead Despite the FTX Scam
A fraud, free-market, antifragility tale

Crypto's only rival is public opinion.
In less than a week, mainstream media, bloggers, and TikTokers turned on FTX's founder.
While some were surprised, almost everyone with a keyboard and a Twitter account predicted the FTX collapse. These financial oracles should have warned the 1.2 million people Sam Bankman-Fried duped.
After happening, unexpected events seem obvious to our brains. It's a bug and a feature because it helps us cope with disasters and makes our reasoning suck.
Nobody predicted the FTX debacle. Bloomberg? Politicians. Non-famous. No cryptologists. Who?
When FTX imploded, taking billions of dollars with it, an outrage bomb went off, and the resulting shockwave threatens the crypto market's existence.
As someone who lost more than $78,000 in a crypto scam in 2020, I can only understand people’s reactions. When the dust settles and rationality returns, we'll realize this is a natural occurrence in every free market.
What specifically occurred with FTX? (Skip if you are aware.)
FTX is a cryptocurrency exchange where customers can trade with cash. It reached #3 in less than two years as the fastest-growing platform of its kind.
FTX's performance helped make SBF the crypto poster boy. Other reasons include his altruistic public image, his support for the Democrats, and his company Alameda Research.
Alameda Research made a fortune arbitraging Bitcoin.
Arbitrage trading uses small price differences between two markets to make money. Bitcoin costs $20k in Japan and $21k in the US. Alameda Research did that for months, making $1 million per day.
Later, as its capital grew, Alameda expanded its trading activities and began investing in other companies.
Let's now discuss FTX.
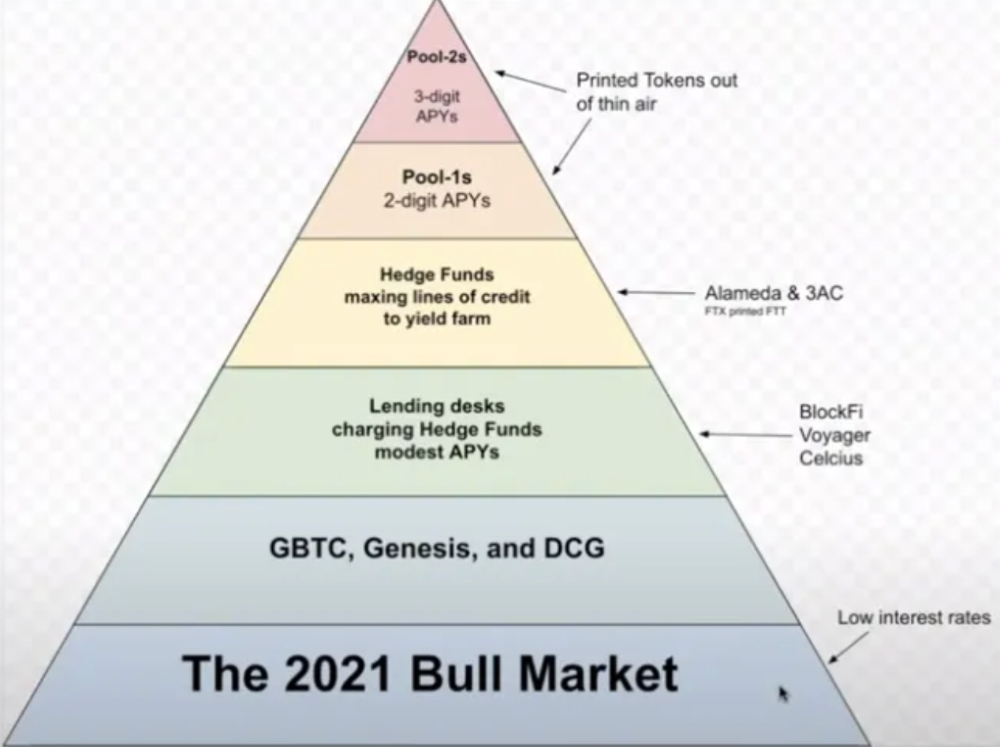
SBF's diabolic master plan began when he used FTX-created FTT coins to inflate his trading company's balance sheets. He used inflated Alameda numbers to secure bank loans.
SBF used money he printed himself as collateral to borrow billions for capital. Coindesk exposed him in a report.
One of FTX's early investors tweeted that he planned to sell his FTT coins over the next few months. This would be a minor event if the investor wasn't Binance CEO Changpeng Zhao (CZ).
The crypto space saw a red WARNING sign when CZ cut ties with FTX. Everyone with an FTX account and a brain withdrew money. Two events followed. FTT fell from $20 to $4 in less than 72 hours, and FTX couldn't meet withdrawal requests, spreading panic.
SBF reassured FTX users on Twitter. Good assets.
He lied.
SBF falsely claimed FTX had a liquidity crunch. At the time of his initial claims, FTX owed about $8 billion to its customers. Liquidity shortages are usually minor. To get cash, sell assets. In the case of FTX, the main asset was printed FTT coins.
Sam wouldn't get out of trouble even if he slashed the discount (from $20 to $4) and sold every FTT. He'd flood the crypto market with his homemade coins, causing the price to crash.
SBF was trapped. He approached Binance about a buyout, which seemed good until Binance looked at FTX's books.
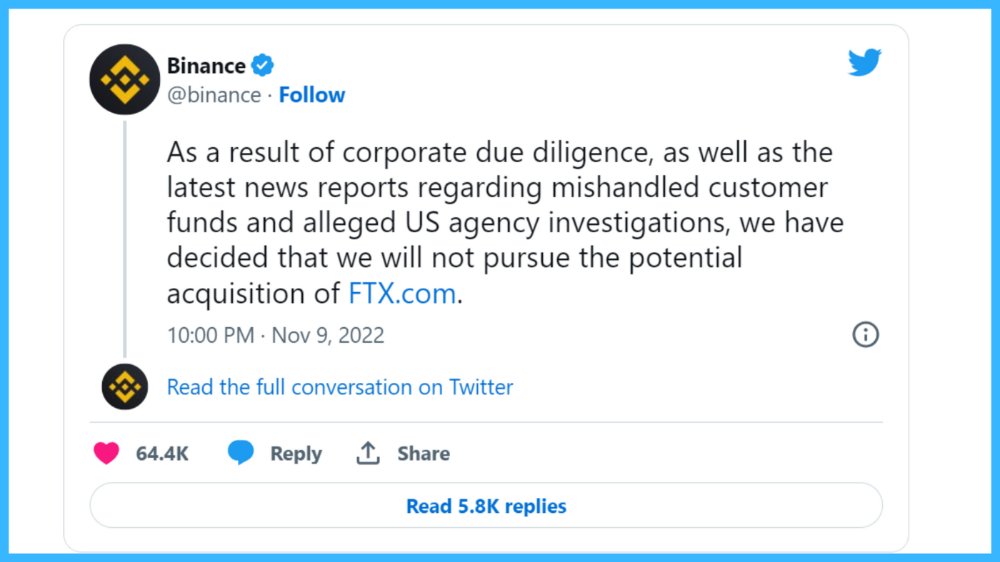
Binance's tweet ended SBF, and he had to apologize, resign as CEO, and file for bankruptcy.
Bloomberg estimated Sam's net worth to be zero by the end of that week. 0!
But that's not all. Twitter investigations exposed fraud at FTX and Alameda Research. SBF used customer funds to trade and invest in other companies.
Thanks to the Twitter indie reporters who made the mainstream press look amateurish. Some Twitter detectives didn't sleep for 30 hours to find answers. Others added to existing threads. Memes were hilarious.
One question kept repeating in my bald head as I watched the Blue Bird. Sam, WTF?
Then I understood.
SBF wanted that FTX becomes a bank.
Think about this. FTX seems healthy a few weeks ago. You buy 2 bitcoins using FTX. You'd expect the platform to take your dollars and debit your wallet, right?
No. They give I-Owe-Yous.
FTX records owing you 2 bitcoins in its internal ledger but doesn't credit your account. Given SBF's tricks, I'd bet on nothing.
What happens if they don't credit my account with 2 bitcoins? Your money goes into FTX's capital, where SBF and his friends invest in marketing, political endorsements, and buying other companies.
Over its two-year existence, FTX invested in 130 companies. Once they make a profit on their purchases, they'll pay you and keep the rest.
One detail makes their strategy dumb. If all FTX customers withdraw at once, everything collapses.
Financially savvy people think FTX's collapse resembles a bank run, and they're right. SBF designed FTX to operate like a bank.
You expect your bank to open a drawer with your name and put $1,000 in it when you deposit $1,000. They deposit $100 in your drawer and create an I-Owe-You for $900. What happens to $900?
Let's sum it up: It's boring and headache-inducing.
When you deposit money in a bank, they can keep 10% and lend the rest. Fractional Reserve Banking is a popular method. Fractional reserves operate within and across banks.
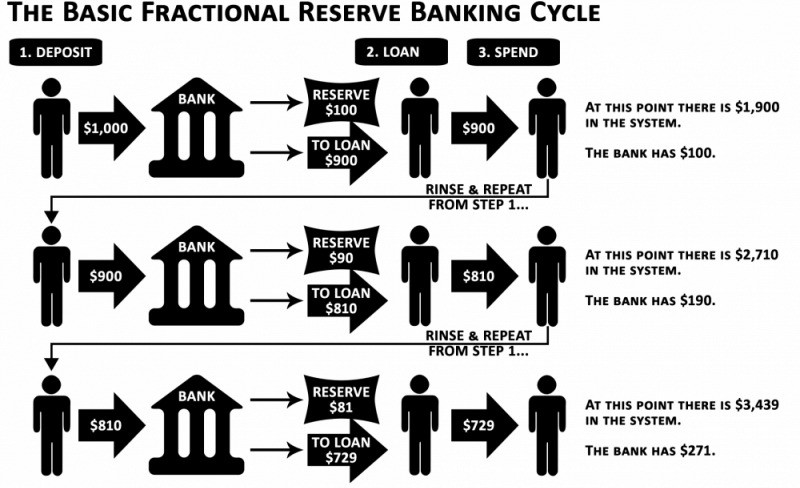
Fractional reserve banking generates $10,000 for every $1,000 deposited. People will pay off their debt plus interest.
As long as banks work together and the economy grows, their model works well.
SBF tried to replicate the system but forgot two details. First, traditional banks need verifiable collateral like real estate, jewelry, art, stocks, and bonds, not digital coupons. Traditional banks developed a liquidity buffer. The Federal Reserve (or Central Bank) injects massive cash into troubled banks.
Massive cash injections come from taxpayers. You and I pay for bankers' mistakes and annual bonuses. Yes, you may think banking is rigged. It's rigged, but it's the best financial game in 150 years. We accept its flaws, including bailouts for too-big-to-fail companies.
Anyway.
SBF wanted Binance's bailout. Binance said no, which was good for the crypto market.
Free markets are resilient.
Nassim Nicholas Taleb coined the term antifragility.
“Some things benefit from shocks; they thrive and grow when exposed to volatility, randomness, disorder, and stressors and love adventure, risk, and uncertainty. Yet, in spite of the ubiquity of the phenomenon, there is no word for the exact opposite of fragile. Let us call it antifragile. Antifragility is beyond resilience or robustness. The resilient resists shocks and stays the same; the antifragile gets better.”
The easiest way to understand how antifragile systems behave is to compare them with other types of systems.
Glass is like a fragile system. It snaps when shocked.
Similar to rubber, a resilient system. After a stressful episode, it bounces back.
A system that is antifragile is similar to a muscle. As it is torn in the gym, it gets stronger.
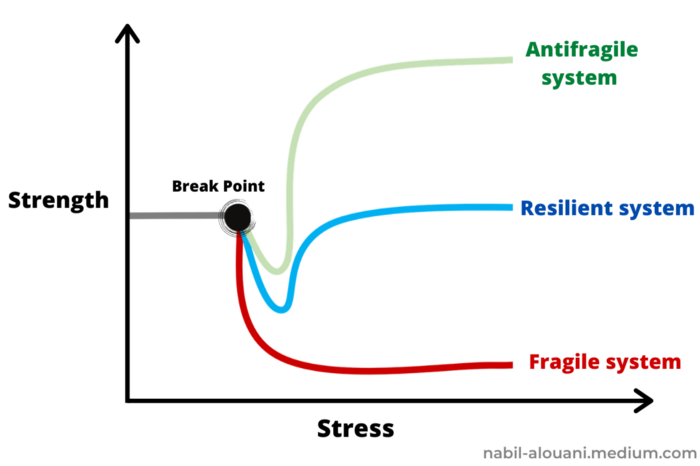
Time-changed things are antifragile. Culture, tech innovation, restaurants, revolutions, book sales, cuisine, economic success, and even muscle shape. These systems benefit from shocks and randomness in different ways, but they all pay a price for antifragility.
Same goes for the free market and financial institutions. Taleb's book uses restaurants as an example and ends with a reference to the 2008 crash.
“Restaurants are fragile. They compete with each other. But the collective of local restaurants is antifragile for that very reason. Had restaurants been individually robust, hence immortal, the overall business would be either stagnant or weak and would deliver nothing better than cafeteria food — and I mean Soviet-style cafeteria food. Further, it [the overall business] would be marred with systemic shortages, with once in a while a complete crisis and government bailout.”
Imagine the same thing with banks.
Independent banks would compete to offer the best services. If one of these banks fails, it will disappear. Customers and investors will suffer, but the market will recover from the dead banks' mistakes.
This idea underpins a free market. Bitcoin and other cryptocurrencies say this when criticizing traditional banking.
The traditional banking system's components never die. When a bank fails, the Federal Reserve steps in with a big taxpayer-funded check. This hinders bank evolution. If you don't let banking cells die and be replaced, your financial system won't be antifragile.
The interdependence of banks (centralization) means that one bank's mistake can sink the entire fleet, which brings us to SBF's ultimate travesty with FTX.
FTX has left the cryptocurrency gene pool.
FTX should be decentralized and independent. The super-star scammer invested in more than 130 crypto companies and linked them, creating a fragile banking-like structure. FTX seemed to say, "We exist because centralized banks are bad." But we'll be good, unlike the centralized banking system.
FTX saved several companies, including BlockFi and Voyager Digital.
FTX wanted to be a crypto bank conglomerate and Federal Reserve. SBF wanted to monopolize crypto markets. FTX wanted to be in bed with as many powerful people as possible, so SBF seduced politicians and celebrities.
Worst? People who saw SBF's plan flaws praised him. Experts, newspapers, and crypto fans praised FTX. When billions pour in, it's hard to realize FTX was acting against its nature.
Then, they act shocked when they realize FTX's fall triggered a domino effect. Some say the damage could wipe out the crypto market, but that's wrong.
Cell death is different from body death.
FTX is out of the game despite its size. Unfit, it fell victim to market natural selection.
Next?
The challengers keep coming. The crypto economy will improve with each failure.
Free markets are antifragile because their fragile parts compete, fostering evolution. With constructive feedback, evolution benefits customers and investors.
FTX shows that customers don't like being scammed, so the crypto market's health depends on them. Charlatans and con artists are eliminated quickly or slowly.
Crypto isn't immune to collapse. Cryptocurrencies can go extinct like biological species. Antifragility isn't immortality. A few more decades of evolution may be enough for humans to figure out how to best handle money, whether it's bitcoin, traditional banking, gold, or something else.
Keep your BS detector on. Start by being skeptical of this article's finance-related claims. Even if you think you understand finance, join the conversation.
We build a better future through dialogue. So listen, ask, and share. When you think you can't find common ground with the opposing view, remember:
Sam Bankman-Fried lied.

Protos
4 years ago
StableGains lost $42M in Anchor Protocol.
StableGains lost millions of dollars in customer funds in Anchor Protocol without telling its users. The Anchor Protocol offered depositors 19-20% APY before its parent ecosystem, Terra LUNA, lost tens of billions of dollars in market capitalization as LUNA fell below $0.01 and its stablecoin (UST) collapsed.
A Terra Research Forum member raised the alarm. StableGains changed its homepage and Terms and Conditions to reflect how it mitigates risk, a tacit admission that it should have done so from the start.
StableGains raised $600,000 in YCombinator's W22 batch. Moonfire, Broom Ventures, and Goodwater Capital invested $3 million more.
StableGains' 15% yield product attracted $42 million in deposits. StableGains kept most of its deposits in Anchor's UST pool earning 19-20% APY, kept one-quarter of the interest as a management fee, and then gave customers their promised 15% APY. It lost almost all customer funds when UST melted down. It changed withdrawal times, hurting customers.
- StableGains said de-pegging was unlikely. According to its website, 1 UST can be bought and sold for $1 of LUNA. LUNA became worthless, and Terra shut down its blockchain.
- It promised to diversify assets across several stablecoins to reduce the risk of one losing its $1 peg, but instead kept almost all of them in one basket.
- StableGains promised withdrawals in three business days, even if a stablecoin needed time to regain its peg. StableGains uses Coinbase for deposits and withdrawals, and customers receive the exact amount of USDC requested.
StableGains scrubs its website squeaky clean
StableGains later edited its website to say it only uses the "most trusted and tested stablecoins" and extended withdrawal times from three days to indefinite time "in extreme cases."
Previously, USDC, TerraUST (UST), and Dai were used (DAI). StableGains changed UST-related website content after the meltdown. It also removed most references to DAI.
Customers noticed a new clause in the Terms and Conditions denying StableGains liability for withdrawal losses. This new clause would have required customers to agree not to sue before withdrawing funds, avoiding a class-action lawsuit.
Customers must sign a waiver to receive a refund.
Erickson Kramer & Osborne law firm has asked StableGains to preserve all internal documents on customer accounts, marketing, and TerraUSD communications. The firm has not yet filed a lawsuit.
Thousands of StableGains customers lost an estimated $42 million.
Celsius Network customers also affected
CEL used Terra LUNA's Anchor Protocol. Celsius users lost money in the crypto market crash and UST meltdown. Many held CEL and LUNA as yielding deposits.
CEO Alex Mashinsky accused "unknown malefactors" of targeting Celsius Network without evidence. Celsius has not publicly investigated this claim as of this article's publication.
CEL fell before UST de-pegged. On June 2, 2021, it reached $8.01. May 19's close: $0.82.
When some Celsius Network users threatened to leave over token losses, Mashinsky replied, "Leave if you don't think I'm sincere and working harder than you, seven days a week."
Celsius Network withdrew $500 million from Anchor Protocol, but smaller holders had trouble.
Read original article here

Crypto Zen Monk
3 years ago
How to DYOR in the world of cryptocurrency
RESEARCH
We must create separate ideas and handle our own risks to be better investors. DYOR is crucial.
The only thing unsustainable is your cluelessness.
DYOR: Why
On social media, there is a lot of false information and divergent viewpoints. All of these facts might be accurate, but they might not be appropriate for your portfolio and investment preferences.
You become a more knowledgeable investor thanks to DYOR.
DYOR improves your portfolio's risk management.
My DYOR resources are below.

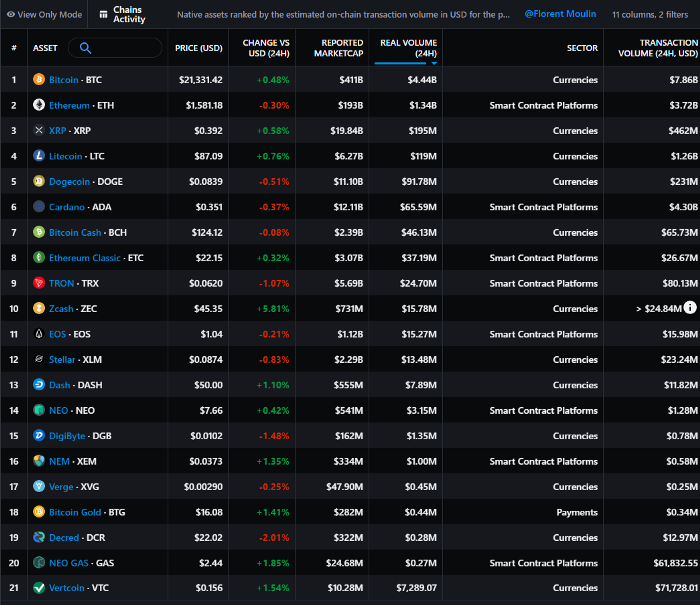
Messari: Major Blockchains' Activities
New York-based Messari provides cryptocurrency open data libraries.
Major blockchains offer 24-hour on-chain volume. https://messari.io/screener/most-active-chains-DB01F96B
What to do
Invest in stable cryptocurrencies. Sort Messari by Real Volume (24H) or Reported Market Cap.
Coingecko: Research on Ecosystems
Top 10 Ecosystems by Coingecko are good.

What to do
Invest in quality.
Leading ten Ecosystems by Market Cap
There are a lot of coins in the ecosystem (second last column of above chart)
CoinGecko's Market Cap Crypto Categories Market capitalization-based cryptocurrency categories. Ethereum Ecosystem www.coingecko.com
Fear & Greed Index for Bitcoin (FGI)
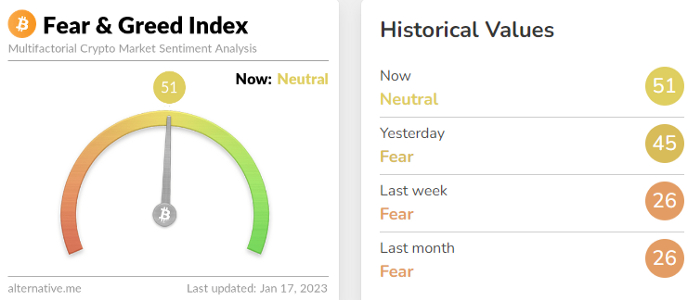
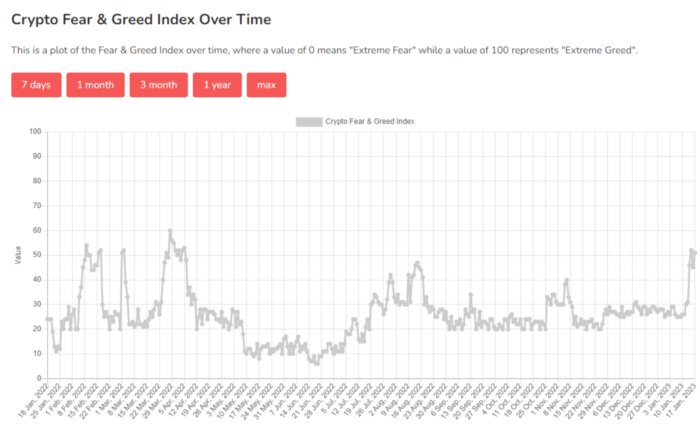
The Bitcoin market sentiment index ranges from 0 (extreme dread) to 100. (extreme greed).
How to Apply
See market sentiment:
Extreme fright = opportunity to buy
Extreme greed creates sales opportunity (market due for correction).
Glassnode
Glassnode gives facts, information, and confidence to make better Bitcoin, Ethereum, and cryptocurrency investments and trades.
Explore free and paid metrics.
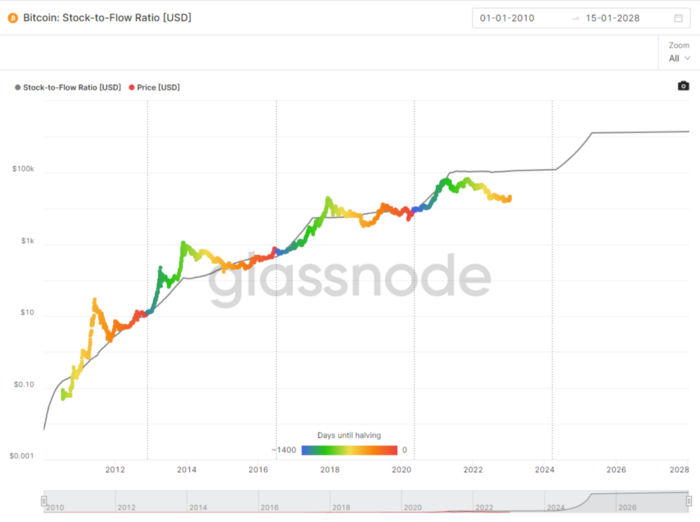
Stock to Flow Ratio: Application
The popular Stock to Flow Ratio concept believes scarcity drives value. Stock to flow is the ratio of circulating Bitcoin supply to fresh production (i.e. newly mined bitcoins). The S/F Ratio has historically predicted Bitcoin prices. PlanB invented this metric.
Utilization: Ethereum Hash Rate
Ethereum miners produce an estimated number of hashes per second.
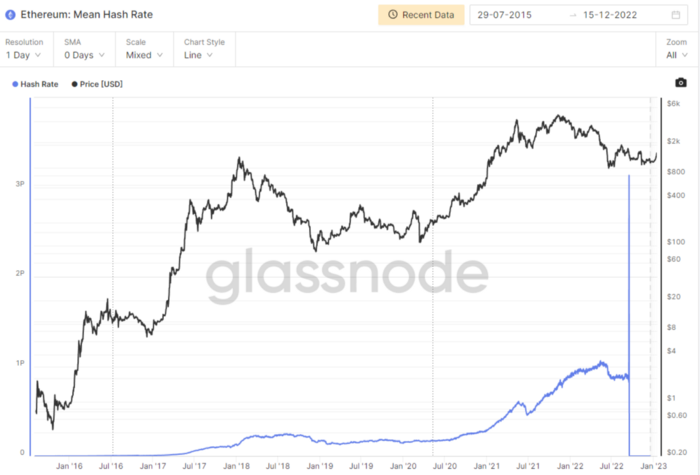
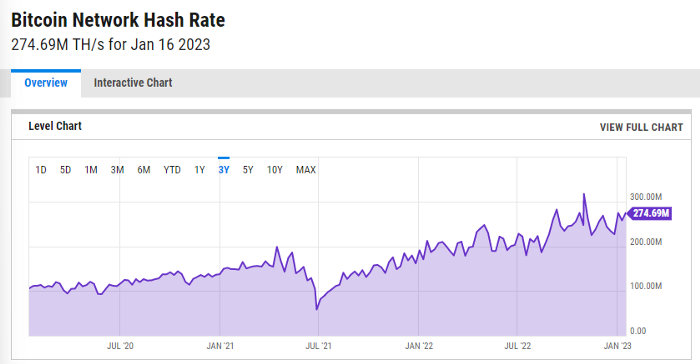
ycharts: Hash rate of the Bitcoin network
TradingView
TradingView is your go-to tool for investment analysis, watch lists, technical analysis, and recommendations from other traders/investors.

Research for a cryptocurrency project
Two key questions every successful project must ask: Q1: What is this project trying to solve? Is it a big problem or minor? Q2: How does this project make money?
Each cryptocurrency:
Check out the white paper.
check out the project's internet presence on github, twitter, and medium.
the transparency of it
Verify the team structure and founders. Verify their LinkedIn profile, academic history, and other qualifications. Search for their names with scam.
Where to purchase and use cryptocurrencies Is it traded on trustworthy exchanges?
From CoinGecko and CoinMarketCap, we may learn about market cap, circulations, and other important data.
The project must solve a problem. Solving a problem is the goal of the founders.
Avoid projects that resemble multi-level marketing or ponzi schemes.
Your use of social media
Use social media carefully or ignore it: Twitter, TradingView, and YouTube
Someone said this before and there are some truth to it. Social media bullish => short.
Your Behavior
Investigate. Spend time. You decide. Worth it!
Only you have the best interest in your financial future.
You might also like

Mark Shpuntov
4 years ago
How to Produce a Month's Worth of Content for Social Media in a Day
New social media producers' biggest error

The Treadmill of Social Media Content
New creators focus on the wrong platforms.
They post to Instagram, Twitter, TikTok, etc.
They create daily material, but it's never enough for social media algorithms.
Creators recognize they're on a content creation treadmill.
They have to keep publishing content daily just to stay on the algorithm’s good side and avoid losing the audience they’ve built on the platform.
This is exhausting and unsustainable, causing creator burnout.
They focus on short-lived platforms, which is an issue.
Comparing low- and high-return social media platforms
Social media networks are great for reaching new audiences.
Their algorithm is meant to viralize material.
Social media can use you for their aims if you're not careful.
To master social media, focus on the right platforms.
To do this, we must differentiate low-ROI and high-ROI platforms:
Low ROI platforms are ones where content has a short lifespan. High ROI platforms are ones where content has a longer lifespan.
A tweet may be shown for 12 days. If you write an article or blog post, it could get visitors for 23 years.
ROI is drastically different.
New creators have limited time and high learning curves.
Nothing is possible.
First create content for high-return platforms.
ROI for social media platforms
Here are high-return platforms:
Your Blog - A single blog article can rank and attract a ton of targeted traffic for a very long time thanks to the power of SEO.
YouTube - YouTube has a reputation for showing search results or sidebar recommendations for videos uploaded 23 years ago. A superb video you make may receive views for a number of years.
Medium - A platform dedicated to excellent writing is called Medium. When you write an article about a subject that never goes out of style, you're building a digital asset that can drive visitors indefinitely.
These high ROI platforms let you generate content once and get visitors for years.
This contrasts with low ROI platforms:
Twitter
Instagram
TikTok
LinkedIn
Facebook
The posts you publish on these networks have a 23-day lifetime. Instagram Reels and TikToks are exceptions since viral content can last months.
If you want to make content creation sustainable and enjoyable, you must focus the majority of your efforts on creating high ROI content first. You can then use the magic of repurposing content to publish content to the lower ROI platforms to increase your reach and exposure.
How To Use Your Content Again
So, you’ve decided to focus on the high ROI platforms.
Great!
You've published an article or a YouTube video.
You worked hard on it.
Now you have fresh stuff.
What now?
If you are not repurposing each piece of content for multiple platforms, you are throwing away your time and efforts.
You've created fantastic material, so why not distribute it across platforms?
Repurposing Content Step-by-Step
For me, it's writing a blog article, but you might start with a video or podcast.
The premise is the same regardless of the medium.
Start by creating content for a high ROI platform (YouTube, Blog Post, Medium). Then, repurpose, edit, and repost it to the lower ROI platforms.
Here's how to repurpose pillar material for other platforms:
Post the article on your blog.
Put your piece on Medium (use the canonical link to point to your blog as the source for SEO)
Create a video and upload it to YouTube using the talking points from the article.
Rewrite the piece a little, then post it to LinkedIn.
Change the article's format to a Thread and share it on Twitter.
Find a few quick quotes throughout the article, then use them in tweets or Instagram quote posts.
Create a carousel for Instagram and LinkedIn using screenshots from the Twitter Thread.
Go through your film and select a few valuable 30-second segments. Share them on LinkedIn, Facebook, Twitter, TikTok, YouTube Shorts, and Instagram Reels.
Your video's audio can be taken out and uploaded as a podcast episode.
If you (or your team) achieve all this, you'll have 20-30 pieces of social media content.
If you're just starting, I wouldn't advocate doing all of this at once.
Instead, focus on a few platforms with this method.
You can outsource this as your company expands. (If you'd want to learn more about content repurposing, contact me.)
You may focus on relevant work while someone else grows your social media on autopilot.
You develop high-ROI pillar content, and it's automatically chopped up and posted on social media.
This lets you use social media algorithms without getting sucked in.
Thanks for reading!

Recep İnanç
4 years ago
Effective Technical Book Reading Techniques

Technical books aren't like novels. We need a new approach to technical texts. I've spent years looking for a decent reading method. I tried numerous ways before finding one that worked. This post explains how I read technical books efficiently.
What Do I Mean When I Say Effective?
Effectiveness depends on the book. Effective implies I know where to find answers after reading a reference book. Effective implies I learned the book's knowledge after reading it.
I use reference books as tools in my toolkit. I won't carry all my tools; I'll merely need them. Non-reference books teach me techniques. I never have to make an effort to use them since I always have them.
Reference books I like:
Design Patterns: Elements of Reusable Object-Oriented Software
Refactoring: Improving the Design of Existing Code
You can also check My Top Takeaways from Refactoring here.
Non-reference books I like:
The Approach
Technical books might be overwhelming to read in one sitting. Especially when you have no idea what is coming next as you read. When you don't know how deep the rabbit hole goes, you feel lost as you read. This is my years-long method for overcoming this difficulty.
Whether you follow the step-by-step guide or not, remember these:
Understand the terminology. Make sure you get the meaning of any terms you come across more than once. The likelihood that a term will be significant increases as you encounter it more frequently.
Know when to stop. I've always believed that in order to truly comprehend something, I must delve as deeply as possible into it. That, however, is not usually very effective. There are moments when you have to draw the line and start putting theory into practice (if applicable).
Look over your notes. When reading technical books or documents, taking notes is a crucial habit to develop. Additionally, you must regularly examine your notes if you want to get the most out of them. This will assist you in internalizing the lessons you acquired from the book. And you'll see that the urge to review reduces with time.
Let's talk about how I read a technical book step by step.
0. Read the Foreword/Preface
These sections are crucial in technical books. They answer Who should read it, What each chapter discusses, and sometimes How to Read? This is helpful before reading the book. Who could know the ideal way to read the book better than the author, right?
1. Scanning
I scan the chapter. Fast scanning is needed.
I review the headings.
I scan the pictures quickly.
I assess the chapter's length to determine whether I might divide it into more manageable sections.
2. Skimming
Skimming is faster than reading but slower than scanning.
I focus more on the captions and subtitles for the photographs.
I read each paragraph's opening and closing sentences.
I examined the code samples.
I attempt to grasp each section's basic points without getting bogged down in the specifics.
Throughout the entire reading period, I make an effort to make mental notes of what may require additional attention and what may not. Because I don't want to spend time taking physical notes, kindly notice that I am using the term "mental" here. It is much simpler to recall. You may think that this is more significant than typing or writing “Pay attention to X.”
I move on quickly. This is something I considered crucial because, when trying to skim, it is simple to start reading the entire thing.
3. Complete reading
Previous steps pay off.
I finished reading the chapter.
I concentrate on the passages that I mentally underlined when skimming.
I put the book away and make my own notes. It is typically more difficult than it seems for me. But it's important to speak in your own words. You must choose the right words to adequately summarize what you have read. How do those words make you feel? Additionally, you must be able to summarize your notes while you are taking them. Sometimes as I'm writing my notes, I realize I have no words to convey what I'm thinking or, even worse, I start to doubt what I'm writing down. This is a good indication that I haven't internalized that idea thoroughly enough.
I jot my inquiries down. Normally, I read on while compiling my questions in the hopes that I will learn the answers as I read. I'll explore those issues more if I wasn't able to find the answers to my inquiries while reading the book.
Bonus!
Best part: If you take lovely notes like I do, you can publish them as a blog post with a few tweaks.
Conclusion
This is my learning journey. I wanted to show you. This post may help someone with a similar learning style. You can alter the principles above for any technical material.

Ray Dalio
4 years ago
The latest “bubble indicator” readings.
As you know, I like to turn my intuition into decision rules (principles) that can be back-tested and automated to create a portfolio of alpha bets. I use one for bubbles. Having seen many bubbles in my 50+ years of investing, I described what makes a bubble and how to identify them in markets—not just stocks.
A bubble market has a high degree of the following:
- High prices compared to traditional values (e.g., by taking the present value of their cash flows for the duration of the asset and comparing it with their interest rates).
- Conditons incompatible with long-term growth (e.g., extrapolating past revenue and earnings growth rates late in the cycle).
- Many new and inexperienced buyers were drawn in by the perceived hot market.
- Broad bullish sentiment.
- Debt financing a large portion of purchases.
- Lots of forward and speculative purchases to profit from price rises (e.g., inventories that are more than needed, contracted forward purchases, etc.).
I use these criteria to assess all markets for bubbles. I have periodically shown you these for stocks and the stock market.
What Was Shown in January Versus Now
I will first describe the picture in words, then show it in charts, and compare it to the last update in January.
As of January, the bubble indicator showed that a) the US equity market was in a moderate bubble, but not an extreme one (ie., 70 percent of way toward the highest bubble, which occurred in the late 1990s and late 1920s), and b) the emerging tech companies (ie. As well, the unprecedented flood of liquidity post-COVID financed other bubbly behavior (e.g. SPACs, IPO boom, big pickup in options activity), making things bubbly. I showed which stocks were in bubbles and created an index of those stocks, which I call “bubble stocks.”
Those bubble stocks have popped. They fell by a third last year, while the S&P 500 remained flat. In light of these and other market developments, it is not necessarily true that now is a good time to buy emerging tech stocks.
The fact that they aren't at a bubble extreme doesn't mean they are safe or that it's a good time to get long. Our metrics still show that US stocks are overvalued. Once popped, bubbles tend to overcorrect to the downside rather than settle at “normal” prices.
The following charts paint the picture. The first shows the US equity market bubble gauge/indicator going back to 1900, currently at the 40% percentile. The charts also zoom in on the gauge in recent years, as well as the late 1920s and late 1990s bubbles (during both of these cases the gauge reached 100 percent ).
The chart below depicts the average bubble gauge for the most bubbly companies in 2020. Those readings are down significantly.
The charts below compare the performance of a basket of emerging tech bubble stocks to the S&P 500. Prices have fallen noticeably, giving up most of their post-COVID gains.
The following charts show the price action of the bubble slice today and in the 1920s and 1990s. These charts show the same market dynamics and two key indicators. These are just two examples of how a lot of debt financing stock ownership coupled with a tightening typically leads to a bubble popping.
Everything driving the bubbles in this market segment is classic—the same drivers that drove the 1920s bubble and the 1990s bubble. For instance, in the last couple months, it was how tightening can act to prick the bubble. Review this case study of the 1920s stock bubble (starting on page 49) from my book Principles for Navigating Big Debt Crises to grasp these dynamics.
The following charts show the components of the US stock market bubble gauge. Since this is a proprietary indicator, I will only show you some of the sub-aggregate readings and some indicators.
Each of these six influences is measured using a number of stats. This is how I approach the stock market. These gauges are combined into aggregate indices by security and then for the market as a whole. The table below shows the current readings of these US equity market indicators. It compares current conditions for US equities to historical conditions. These readings suggest that we’re out of a bubble.
1. How High Are Prices Relatively?
This price gauge for US equities is currently around the 50th percentile.
2. Is price reduction unsustainable?
This measure calculates the earnings growth rate required to outperform bonds. This is calculated by adding up the readings of individual securities. This indicator is currently near the 60th percentile for the overall market, higher than some of our other readings. Profit growth discounted in stocks remains high.
Even more so in the US software sector. Analysts' earnings growth expectations for this sector have slowed, but remain high historically. P/Es have reversed COVID gains but remain high historical.
3. How many new buyers (i.e., non-existing buyers) entered the market?
Expansion of new entrants is often indicative of a bubble. According to historical accounts, this was true in the 1990s equity bubble and the 1929 bubble (though our data for this and other gauges doesn't go back that far). A flood of new retail investors into popular stocks, which by other measures appeared to be in a bubble, pushed this gauge above the 90% mark in 2020. The pace of retail activity in the markets has recently slowed to pre-COVID levels.
4. How Broadly Bullish Is Sentiment?
The more people who have invested, the less resources they have to keep investing, and the more likely they are to sell. Market sentiment is now significantly negative.
5. Are Purchases Being Financed by High Leverage?
Leveraged purchases weaken the buying foundation and expose it to forced selling in a downturn. The leverage gauge, which considers option positions as a form of leverage, is now around the 50% mark.
6. To What Extent Have Buyers Made Exceptionally Extended Forward Purchases?
Looking at future purchases can help assess whether expectations have become overly optimistic. This indicator is particularly useful in commodity and real estate markets, where forward purchases are most obvious. In the equity markets, I look at indicators like capital expenditure, or how much businesses (and governments) invest in infrastructure, factories, etc. It reflects whether businesses are projecting future demand growth. Like other gauges, this one is at the 40th percentile.
What one does with it is a tactical choice. While the reversal has been significant, future earnings discounting remains high historically. In either case, bubbles tend to overcorrect (sell off more than the fundamentals suggest) rather than simply deflate. But I wanted to share these updated readings with you in light of recent market activity.