


More on Entrepreneurship/Creators

Khoi Ho
3 years ago
After working at seven startups, here are the early-stage characteristics that contributed to profitability, unicorn status or successful acquisition.

I've worked in a People role at seven early-stage firms for over 15 years (I enjoy chasing a dream!). Few of the seven achieved profitability, including unicorn status or acquisition.
Did early-stage startups share anything? Was there a difference between winners and losers? YES.
I support founders and entrepreneurs building financially sustainable enterprises with a compelling cause. This isn't something everyone would do. A company's success demands more than guts. Founders drive startup success.
Six Qualities of Successful Startups
Successful startup founders either innately grasped the correlation between strong team engagement and a well-executed business model, or they knew how to ask and listen to others (executive coaches, other company leaders, the team itself) to learn about it.
Successful startups:
1. Co-founders agreed and got along personally.
Multi-founder startups are common. When co-founders agree on strategic decisions and are buddies, there's less friction and politics at work.
As a co-founder, ask your team if you're aligned. They'll explain.
I've seen C-level leaders harbor personal resentments over disagreements. A co-departure founder's caused volatile leadership and work disruptions that the team struggled to manage during and after.
2. Team stayed.
Successful startups have low turnover. Nobody is leaving. There may be a termination for performance, but other team members will have observed the issues and agreed with the decision.
You don't want organizational turnover of 30%+, with leaders citing performance issues but the team not believing them. This breeds suspicion.
Something is wrong if many employees leave voluntarily or involuntarily. You may hear about lack of empowerment, support, or toxic leadership in exit interviews and from the existing team. Intellectual capital loss and resource instability harm success.
3. Team momentum.
A successful startup's team is excited about its progress. Consistently achieving goals and having trackable performance metrics. Some describe this period of productivity as magical, with great talents joining the team and the right people in the right places. Increasing momentum.
I've also seen short-sighted decisions where only some departments, like sales and engineering, had goals. Lack of a unified goals system created silos and miscommunication. Some employees felt apathetic because they didn't know how they contributed to team goals.
4. Employees advanced in their careers.
Even if you haven't created career pathing or professional development programs, early-stage employees will grow and move into next-level roles. If you hire more experienced talent and leaders, expect them to mentor existing team members. Growing companies need good performers.
New talent shouldn't replace and discard existing talent. This creates animosity and makes existing employees feel unappreciated for their early contributions to the company.
5. The company lived its values.
Culture and identity are built on lived values. A company's values affect hiring, performance management, rewards, and other processes. Identify, practice, and believe in company values. Starting with team values instead of management or consultants helps achieve this. When a company's words and actions match, it builds trust.
When company values are beautifully displayed on a wall but few employees understand them, the opposite is true. If an employee can't name the company values, they're useless.
6. Communication was clear.
When necessary information is shared with the team, they feel included, trusted, and like owners. Transparency means employees have the needed information to do their jobs. Disclosure builds trust. The founders answer employees' questions honestly.
Information accessibility decreases office politics. Without transparency, even basic information is guarded and many decisions are made in secret. I've seen founders who don't share financial, board meeting, or compensation and equity information. The founders' lack of trust in the team wasn't surprising, so it was reciprocated.
The Choices
Finally. All six of the above traits (leadership alignment, minimal turnover, momentum, professional advancement, values, and transparency) were high in the profitable startups I've worked at, including unicorn status or acquisition.
I've seen these as the most common and constant signals of startup success or failure.
These characteristics are the product of founders' choices. These decisions lead to increased team engagement and business execution.
Here's something to consider for startup employees and want-to-bes. 90% of startups fail, despite the allure of building something new and gaining ownership. With the emotional and time investment in startup formation, look for startups with these traits to reduce your risk.
Both you and the startup will thrive in these workplaces.

Kaitlin Fritz
3 years ago
The Entrepreneurial Chicken and Egg
University entrepreneurship is like a Willy Wonka Factory of ideas. Classes, roommates, discussions, and the cafeteria all inspire new ideas. I've seen people establish a business without knowing its roots.
Chicken or egg? On my mind: I've asked university founders around the world whether the problem or solution came first.
The Problem
One African team I met started with the “instant noodles” problem in their academic ecosystem. Many of us have had money issues in college, which may have led to poor nutritional choices.
Many university students in a war-torn country ate quick noodles or pasta for dinner.

Noodles required heat, water, and preparation in the boarding house. Unreliable power from one hot plate per blue moon. What's healthier, easier, and tastier than sodium-filled instant pots?
BOOM. They were fixing that. East African kids need affordable, nutritious food.
This is a real difficulty the founders faced every day with hundreds of comrades.
This sparked their serendipitous entrepreneurial journey and became their business's cornerstone.
The Solution
I asked a UK team about their company idea. They said the solution fascinated them.
The crew was fiddling with social media algorithms. Why are some people more popular? They were studying platforms and social networks, which offered a way for them.

Solving a problem? Yes. Long nights of university research lead them to it. Is this like world hunger? Social media influencers confront this difficulty regularly.
It made me ponder something. Is there a correct response?
In my heart, yes, but in my head…maybe?
I believe you should lead with empathy and embrace the problem, not the solution. Big or small, businesses should solve problems. This should be your focus. This is especially true when building a social company with an audience in mind.
Philosophically, invention and innovation are occasionally accidental. Also not penalized. Think about bugs and the creation of Velcro, or the inception of Teflon. They tackle difficulties we overlook. The route to the problem may look different, but there is a path there.
There's no golden ticket to the Chicken-Egg debate, but I'll keep looking this summer.

Matthew O'Riordan
3 years ago
Trends in SaaS Funding from 2016 to 2022
Christopher Janz of Point Nine Capital created the SaaS napkin in 2016. This post shows how founders have raised cash in the last 6 years. View raw data.
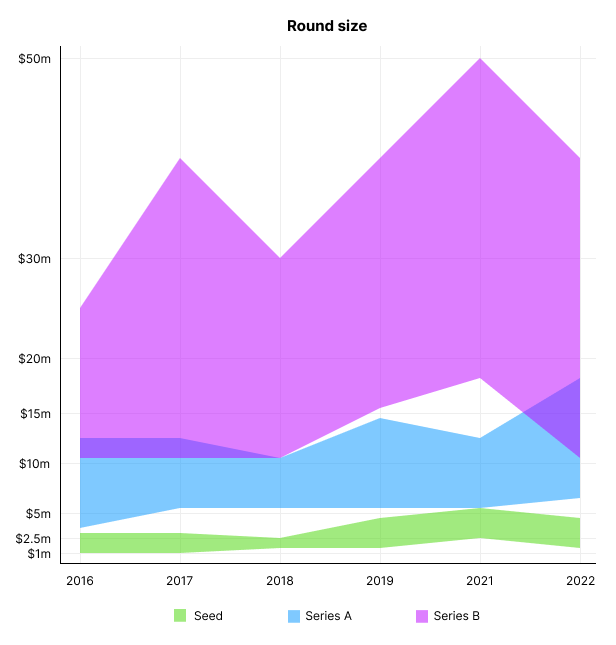
Round size
Unsurprisingly, round sizes have expanded and will taper down in 2022. In 2016, pre-seed rounds were $200k to $500k; currently, they're $1-$2m. Despite the macroeconomic scenario, Series A have expanded from $3m to $12m in 2016 to $6m and $18m in 2022.
Valuation
There are hints that valuations are rebounding this year. Pre-seed valuations in 2022 are $12m from $3m in 2016, and Series B prices are $270m from $100m in 2016.
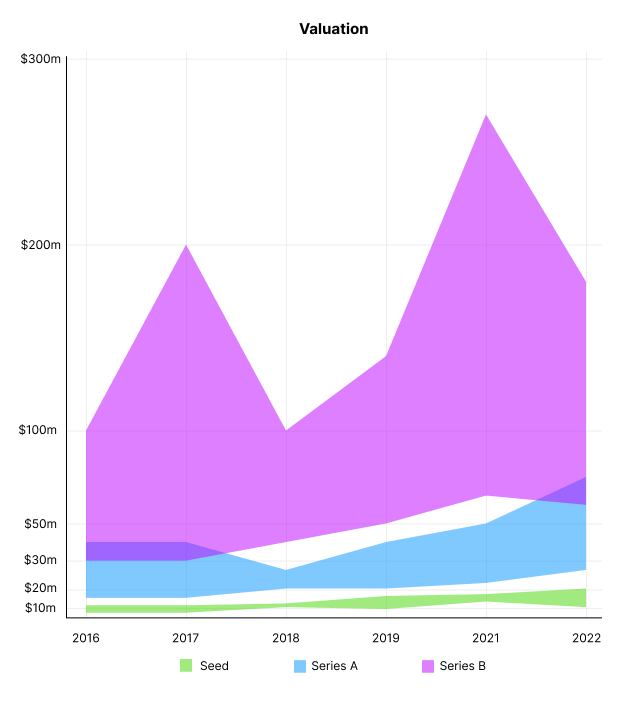
Compared to public SaaS multiples, Series B valuations more closely reflect the market, but Seed and Series A prices seem to be inflated regardless of the market.
I'd like to know how each annual cohort performed for investors, based on the year they invested and the valuations. I can't access this information.
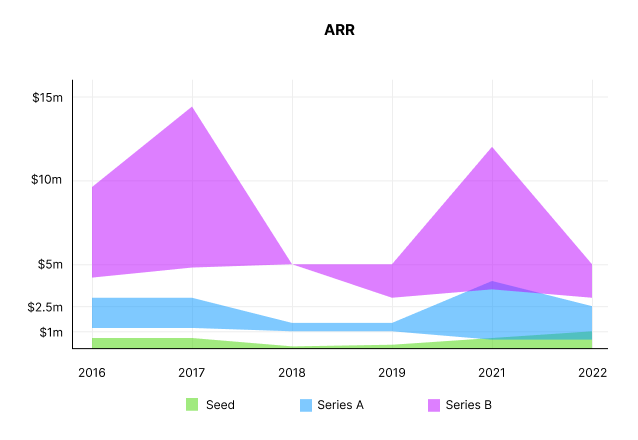
ARR
Seed firms' ARR forecasts have risen from $0 to $0.6m to $0 to $1m. 2016 expected $1.2m to $3m, 2021 $0.5m to $4m, and this year $0.5m to $2.5m, suggesting that Series A firms may raise with less ARR today. Series B minutes fell from $4.2m to $3m.
Capitalization Rate
2022 is the year that VCs start discussing capital efficiency in portfolio meetings. Given the economic shift in the markets and the stealthy VC meltdown, it's not surprising. Christopher Janz added capital efficiency to the SaaS Napkin as a new statistic for Series A (3.5x) and Series B. (2.5x). Your investors must live under a rock if they haven't asked about capital efficiency. If you're unsure:
The Capital Efficiency Ratio is the ratio of how much a company has spent growing revenue and how much they’re receiving in return. It is the broadest measure of company effectiveness in generating ARR
What next?
No one knows what's next, including me. All startup and growing enterprises around me are tightening their belts and extending their runways in anticipation of a difficult fundraising ride. If you're wanting to raise money but can wait, wait till the market is more stable and access to money is easier.
You might also like

Jano le Roux
3 years ago
The Real Reason Adobe Just Paid $20 billion for Figma
Sketch or Figma?
Designers are pissed.
The beast ate the beauty.
Figma deserves $20B.
Do designers deserve Adobe?
Adobe devours new creative tools and spits them out with a slimy Adobe aftertaste.
Frame.io — $1.3B
Magento — $1.7B
Macromedia — $3.6B
Nothing compares to the risky $20B acquisition.
If they can't be beaten, buy them.
And then make them boring.
Adobe's everywhere.
Like that friend who dabbles in everything creatively, there's not enough time to master one thing.
Figma was Adobe's thigh-mounted battle axe.
a UX design instrument with a sizable free tier.
a UX design tool with a simple and quick user interface.
a tool for fluid collaboration in user experience design.
a web-based UX design tool that functions well.
a UX design tool with a singular goal of perfection.
UX design software that replaced Adobe XD.
Adobe XD could do many of Figma's things, but it didn't focus on the details. This is a major issue when working with detail-oriented professionals.
UX designers.
Design enthusiasts first used Figma. More professionals used it. Institutions taught it. Finally, major brands adopted Figma.
Adobe hated that.
Adobe dispatched a team of lawyers to resolve the Figma issue, as big companies do. Figma didn’t bite for months.
Oh no.
Figma resisted.
Figma helped designers leave Adobe. Figma couldn't replace Photoshop, but most designers used it to remove backgrounds.
Online background removal tools improved.
The Figma problem grew into a thorn, a knife, and a battle ax in Adobe's soft inner thigh.
Figma appeared to be going public. Adobe couldn’t allow that. It bought Figma for $20B during the IPO drought.
Adobe has a new issue—investors are upset.
The actual cause of investors' ire toward Adobe
Spoiler: The math just doesn’t add up.
According to Adobe's press release, Figma's annual recurring revenue (ARR) is $400M and growing rapidly.
The $20B valuation requires a 50X revenue multiple, which is unheard of.
Venture capitalists typically use:
10% to 29% growth per year: ARR multiplied by 1 to 5
30% to 99% growth per year: ARR multiplied by 6 to 10
100% to 400% growth per year: ARR multiplied by 10 to 20
Showing an investor a 50x multiple is like telling friends you saw a UFO. They'll think you're crazy.
Adobe's stock fell immediately after the acquisition because it didn't make sense to a number-cruncher.
Designers started a Tweet storm in the digital town hall where VCs and designers often meet.
Adobe acquired Workfront for $1.5 billion at the end of 2020. This purchase made sense for investors.
Many investors missed the fact that Adobe is acquiring Figma not only for its ARR but also for its brilliant collaboration tech.
Adobe could use Figmas web app technology to make more products web-based to compete with Canva.
Figma's high-profile clients could switch to Adobe's enterprise software.
However, questions arise:
Will Adobe make Figma boring?
Will Adobe tone down Figma to boost XD?
Would you ditch Adobe and Figma for Sketch?

nft now
3 years ago
Instagram NFTs Are Here… How does this affect artists?
Instagram (IG) is officially joining NFT. With the debut of new in-app NFT functionalities, influential producers can interact with blockchain tech on the social media platform.
Meta unveiled intentions for an Instagram NFT marketplace in March, but these latest capabilities focus more on content sharing than commerce. And why shouldn’t they? IG's entry into the NFT market is overdue, given that Twitter and Discord are NFT hotspots.
The NFT marketplace/Web3 social media race has continued to expand, with the expected Coinbase NFT Beta now live and blazing a trail through the NFT ecosystem.
IG's focus is on visual art. It's unlike any NFT marketplace or platform. IG NFTs and artists: what's the deal? Let’s take a look.
What are Instagram’s NFT features anyways?
As said, not everyone has Instagram's new features. 16 artists, NFT makers, and collectors can now post NFTs on IG by integrating third-party digital wallets (like Rainbow or MetaMask) in-app. IG doesn't charge to publish or share digital collectibles.
NFTs displayed on the app have a "shimmer" aesthetic effect. NFT posts also have a "digital collectable" badge that lists metadata such as the creator and/or owner, the platform it was created on, a brief description, and a blockchain identification.
Meta's social media NFTs have launched on Instagram, but the company is also preparing to roll out digital collectibles on Facebook, with more on the way for IG. Currently, only Ethereum and Polygon are supported, but Flow and Solana will be added soon.
How will artists use these new features?
Artists are publishing NFTs they developed or own on IG by linking third-party digital wallets. These features have no NFT trading aspects built-in, but are aimed to let authors share NFTs with IG audiences.
Creators, like IG-native aerial/street photographer Natalie Amrossi (@misshattan), are discovering novel uses for IG NFTs.
Amrossi chose to not only upload his own NFTs but also encourage other artists in the field. "That's the beauty of connecting your wallet and sharing NFTs. It's not just what you make, but also what you accumulate."
Amrossi has been producing and posting Instagram art for years. With IG's NFT features, she can understand Instagram's importance in supporting artists.
Web2 offered Amrossi the tools to become an artist and make a life. "Before 'influencer' existed, I was just making art. Instagram helped me reach so many individuals and brands, giving me a living.
Even artists without millions of viewers are encouraged to share NFTs on IG. Wilson, a relatively new name in the NFT space, seems to have already gone above and beyond the scope of these new IG features. By releasing "Losing My Mind" via IG NFT posts, she has evaded the lack of IG NFT commerce by using her network to market her multi-piece collection.
"'Losing My Mind' is a long-running photo series. Wilson was preparing to release it as NFTs before IG approached him, so it was a perfect match.
Wilson says the series is about Black feminine figures and media depiction. Respectable effort, given POC artists have been underrepresented in NFT so far.
“Over the past year, I've had mental health concerns that made my emotions so severe it was impossible to function in daily life, therefore that prompted this photo series. Every Wednesday and Friday for three weeks, I'll release a new Meta photo for sale.
Wilson hopes these new IG capabilities will help develop a connection between the NFT community and other internet subcultures that thrive on Instagram.
“NFTs can look scary as an outsider, but seeing them on your daily IG feed makes it less foreign,” adds Wilson. I think Instagram might become a hub for NFT aficionados, making them more accessible to artists and collectors.
What does it all mean for the NFT space?
Meta's NFT and metaverse activities will continue to impact Instagram's NFT ecosystem. Many think it will be for the better, as IG NFT frauds are another problem hurting the NFT industry.
IG's new NFT features seem similar to Twitter's PFP NFT verifications, but Instagram's tools should help cut down on scams as users can now verify the creation and ownership of whole NFT collections included in IG posts.
Given the number of visual artists and NFT creators on IG, it might become another hub for NFT fans, as Wilson noted. If this happens, it raises questions about Instagram success. Will artists be incentivized to distribute NFTs? Or will those with a large fanbase dominate?
Elise Swopes (@swopes) believes these new features should benefit smaller artists. Swopes was one of the first profiles placed to Instagram's original suggested user list in 2012.
Swopes says she wants IG to be a magnet for discovery and understands the value of NFT artists and producers.
"I'd love to see IG become a focus of discovery for everyone, not just the Beeples and Apes and PFPs. That's terrific for them, but [IG NFT features] are more about using new technology to promote emerging artists, Swopes added.
“Especially music artists. It's everywhere. Dancers, writers, painters, sculptors, musicians. My element isn't just for digital artists; it can be anything. I'm delighted to witness people's creativity."
Swopes, Wilson, and Amrossi all believe IG's new features can help smaller artists. It remains to be seen how these new features will effect the NFT ecosystem once unlocked for the rest of the IG NFT community, but we will likely see more social media NFT integrations in the months and years ahead.
Read the full article here

William Brucee
3 years ago
This person is probably Satoshi Nakamoto.
Who founded bitcoin is the biggest mystery in technology today, not how it works.
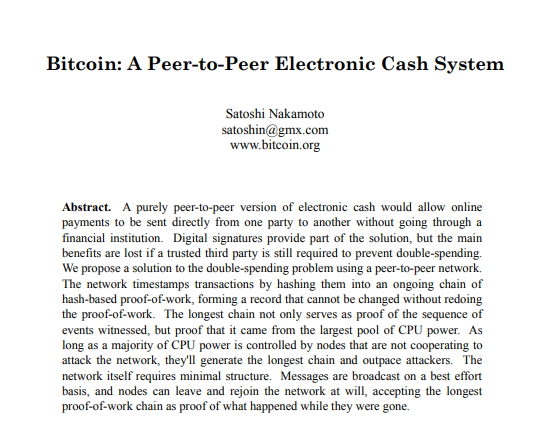
On October 31, 2008, Satoshi Nakamoto posted a whitepaper to a cryptography email list. Still confused by the mastermind who changed monetary history.
Journalists and bloggers have tried in vain to uncover bitcoin's creator. Some candidates self-nominated. We're still looking for the mystery's perpetrator because none of them have provided proof.
One person. I'm confident he invented bitcoin. Let's assess Satoshi Nakamoto before I reveal my pick. Or what he wants us to know.
Satoshi's P2P Foundation biography says he was born in 1975. He doesn't sound or look Japanese. First, he wrote the whitepaper and subsequent articles in flawless English. His sleeping habits are unusual for a Japanese person.
Stefan Thomas, a Bitcoin Forum member, displayed Satoshi's posting timestamps. Satoshi Nakamoto didn't publish between 2 and 8 p.m., Japanese time. Satoshi's identity may not be real.
Why would he disguise himself?
There is a legitimate explanation for this
Phil Zimmermann created PGP to give dissidents an open channel of communication, like Pretty Good Privacy. US government seized this technology after realizing its potential. Police investigate PGP and Zimmermann.
This technology let only two people speak privately. Bitcoin technology makes it possible to send money for free without a bank or other intermediary, removing it from government control.
How much do we know about the person who invented bitcoin?
Here's what we know about Satoshi Nakamoto now that I've covered my doubts about his personality.
Satoshi Nakamoto first appeared with a whitepaper on metzdowd.com. On Halloween 2008, he presented a nine-page paper on a new peer-to-peer electronic monetary system.
Using the nickname satoshi, he created the bitcointalk forum. He kept developing bitcoin and created bitcoin.org. Satoshi mined the genesis block on January 3, 2009.
Satoshi Nakamoto worked with programmers in 2010 to change bitcoin's protocol. He engaged with the bitcoin community. Then he gave Gavin Andresen the keys and codes and transferred community domains. By 2010, he'd abandoned the project.
The bitcoin creator posted his goodbye on April 23, 2011. Mike Hearn asked Satoshi if he planned to rejoin the group.
“I’ve moved on to other things. It’s in good hands with Gavin and everyone.”
Nakamoto Satoshi
The man who broke the banking system vanished. Why?

Satoshi's wallets held 1,000,000 BTC. In December 2017, when the price peaked, he had over US$19 billion. Nakamoto had the 44th-highest net worth then. He's never cashed a bitcoin.
This data suggests something happened to bitcoin's creator. I think Hal Finney is Satoshi Nakamoto .
Hal Finney had ALS and died in 2014. I suppose he created the future of money, then he died, leaving us with only rumors about his identity.
Hal Finney, who was he?
Hal Finney graduated from Caltech in 1979. Student peers voted him the smartest. He took a doctoral-level gravitational field theory course as a freshman. Finney's intelligence meets the first requirement for becoming Satoshi Nakamoto.
Students remember Finney holding an Ayn Rand book. If he'd read this, he may have developed libertarian views.
His beliefs led him to a small group of freethinking programmers. In the 1990s, he joined Cypherpunks. This action promoted the use of strong cryptography and privacy-enhancing technologies for social and political change. Finney helped them achieve a crypto-anarchist perspective as self-proclaimed privacy defenders.
Zimmermann knew Finney well.
Hal replied to a Cypherpunk message about Phil Zimmermann and PGP. He contacted Phil and became PGP Corporation's first member, retiring in 2011. Satoshi Nakamoto quit bitcoin in 2011.
Finney improved the new PGP protocol, but he had to do so secretly. He knew about Phil's PGP issues. I understand why he wanted to hide his identity while creating bitcoin.
Why did he pretend to be from Japan?
His envisioned persona was spot-on. He resided near scientist Dorian Prentice Satoshi Nakamoto. Finney could've assumed Nakamoto's identity to hide his. Temple City has 36,000 people, so what are the chances they both lived there? A cryptographic genius with the same name as Bitcoin's creator: coincidence?
Things went differently, I think.
I think Hal Finney sent himself Satoshis messages. I know it's odd. If you want to conceal your involvement, do as follows. He faked messages and transferred the first bitcoins to himself to test the transaction mechanism, so he never returned their money.
Hal Finney created the first reusable proof-of-work system. The bitcoin protocol. In the 1990s, Finney was intrigued by digital money. He invented CRypto cASH in 1993.
Legacy
Hal Finney's contributions should not be forgotten. Even if I'm wrong and he's not Satoshi Nakamoto, we shouldn't forget his bitcoin contribution. He helped us achieve a better future.