


ERC721R: A new ERC721 contract for random minting so people don’t snipe all the rares!
That is, how to snipe all the rares without using ERC721R!
Introduction: Blessed and Lucky
Mphers was the first mfers derivative, and as a Phunks derivative, I wanted one.
I wanted an alien. And there are only 8 in the 6,969 collection. I got one!
In case it wasn't clear from the tweet, I meant that I was lucky to have figured out how to 100% guarantee I'd get an alien without any extra luck.
Read on to find out how I did it, how you can too, and how developers can avoid it!
How to make rare NFTs without luck.
# How to mint rare NFTs without needing luck
The key to minting a rare NFT is knowing the token's id ahead of time.
For example, once I knew my alien was #4002, I simply refreshed the mint page until #3992 was minted, and then mint 10 mphers.
How did I know #4002 was extraterrestrial? Let's go back.
First, go to the mpher contract's Etherscan page and look up the tokenURI of a previously issued token, token #1:
As you can see, mphers creates metadata URIs by combining the token id and an IPFS hash.
This method gives you the collection's provenance in every URI, and while that URI can be changed, it affects everyone and is public.
Consider a token URI without a provenance hash, like https://mphers.art/api?tokenId=1.
As a collector, you couldn't be sure the devs weren't changing #1's metadata at will.
The API allows you to specify “if #4002 has not been minted, do not show any information about it”, whereas IPFS does not allow this.
It's possible to look up the metadata of any token, whether or not it's been minted.
Simply replace the trailing “1” with your desired id.
Mpher #4002
These files contain all the information about the mpher with the specified id. For my alien, we simply search all metadata files for the string “alien mpher.”
Take a look at the 6,969 meta-data files I'm using OpenSea's IPFS gateway, but you could use ipfs.io or something else.
Use curl to download ten files at once. Downloading thousands of files quickly can lead to duplicates or errors. But with a little tweaking, you should be able to get everything (and dupes are fine for our purposes).
Now that you have everything in one place, grep for aliens:
The numbers are the file names that contain “alien mpher” and thus the aliens' ids.
The entire process takes under ten minutes. This technique works on many NFTs currently minting.
In practice, manually minting at the right time to get the alien is difficult, especially when tokens mint quickly. Then write a bot to poll totalSupply() every second and submit the mint transaction at the exact right time.
You could even look for the token you need in the mempool before it is minted, and get your mint into the same block!
However, in my experience, the “big” approach wins 95% of the time—but not 100%.
“Am I being set up all along?”
Is a question you might ask yourself if you're new to this.
It's disheartening to think you had no chance of minting anything that someone else wanted.
But, did you have no opportunity? You had an equal chance as everyone else!
Take me, for instance: I figured this out using open-source tools and free public information. Anyone can do this, and not understanding how a contract works before minting will lead to much worse issues.
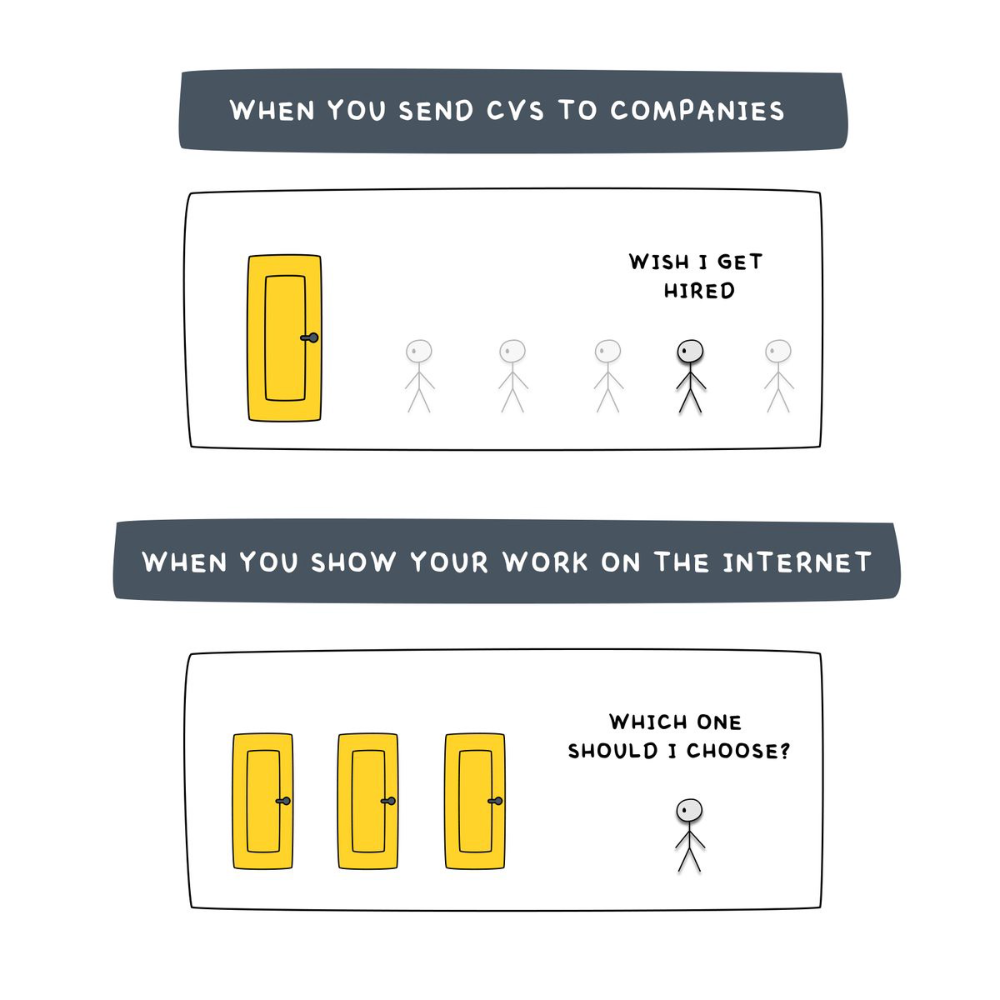
The mpher mint was fair.
While a fair game, “snipe the alien” may not have been everyone's cup of tea.
People may have had more fun playing the “mint lottery” where tokens were distributed at random and no one could gain an advantage over someone simply clicking the “mint” button.
How might we proceed?
Minting For Fashion Hats Punks, I wanted to create a random minting experience without sacrificing fairness. In my opinion, a predictable mint beats an unfair one. Above all, participants must be equal.
Sadly, the most common method of creating a random experience—the post-mint “reveal”—is deeply unfair. It works as follows:
- During the mint, token metadata is unavailable. Instead, tokenURI() returns a blank JSON file for each id.
- An IPFS hash is updated once all tokens are minted.
- You can't tell how the contract owner chose which token ids got which metadata, so it appears random.
Because they alone decide who gets what, the person setting the metadata clearly has a huge unfair advantage over the people minting. Unlike the mpher mint, you have no chance of winning here.
But what if it's a well-known, trusted, doxxed dev team? Are reveals okay here?
No! No one should be trusted with such power. Even if someone isn't consciously trying to cheat, they have unconscious biases. They might also make a mistake and not realize it until it's too late, for example.
You should also not trust yourself. Imagine doing a reveal, thinking you did it correctly (nothing is 100%! ), and getting the rarest NFT. Isn't that a tad odd Do you think you deserve it? An NFT developer like myself would hate to be in this situation.
Reveals are bad*
UNLESS they are done without trust, meaning everyone can verify their fairness without relying on the developers (which you should never do).
An on-chain reveal powered by randomness that is verifiably outside of anyone's control is the most common way to achieve a trustless reveal (e.g., through Chainlink).
Tubby Cats did an excellent job on this reveal, and I highly recommend their contract and launch reflections. Their reveal was also cool because it was progressive—you didn't have to wait until the end of the mint to find out.
In his post-launch reflections, @DefiLlama stated that he made the contract as trustless as possible, removing as much trust as possible from the team.
In my opinion, everyone should know the rules of the game and trust that they will not be changed mid-stream, while trust minimization is critical because smart contracts were designed to reduce trust (and it makes it impossible to hack even if the team is compromised). This was a huge mistake because it limited our flexibility and our ability to correct mistakes.
And @DefiLlama is a superstar developer. Imagine how much stress maximizing trustlessness will cause you!
That leaves me with a bad solution that works in 99 percent of cases and is much easier to implement: random token assignments.
Introducing ERC721R: A fully compliant IERC721 implementation that picks token ids at random.
ERC721R implements the opposite of a reveal: we mint token ids randomly and assign metadata deterministically.
This allows us to reveal all metadata prior to minting while reducing snipe chances.
Then import the contract and use this code:
What is ERC721R and how does it work
First, a disclaimer: ERC721R isn't truly random. In this sense, it creates the same “game” as the mpher situation, where minters compete to exploit the mint. However, ERC721R is a much more difficult game.
To game ERC721R, you need to be able to predict a hash value using these inputs:
This is impossible for a normal person because it requires knowledge of the block timestamp of your mint, which you do not have.
To do this, a miner must set the timestamp to a value in the future, and whatever they do is dependent on the previous block's hash, which expires in about ten seconds when the next block is mined.
This pseudo-randomness is “good enough,” but if big money is involved, it will be gamed. Of course, the system it replaces—predictable minting—can be manipulated.
The token id is chosen in a clever implementation of the Fisher–Yates shuffle algorithm that I copied from CryptoPhunksV2.
Consider first the naive solution: (a 10,000 item collection is assumed):
- Make an array with 0–9999.
- To create a token, pick a random item from the array and use that as the token's id.
- Remove that value from the array and shorten it by one so that every index corresponds to an available token id.
This works, but it uses too much gas because changing an array's length and storing a large array of non-zero values is expensive.
How do we avoid them both? What if we started with a cheap 10,000-zero array? Let's assign an id to each index in that array.
Assume we pick index #6500 at random—#6500 is our token id, and we replace the 0 with a 1.
But what if we chose #6500 again? A 1 would indicate #6500 was taken, but then what? We can't just "roll again" because gas will be unpredictable and high, especially later mints.
This allows us to pick a token id 100% of the time without having to keep a separate list. Here's how it works:
- Make a 10,000 0 array.
- Create a 10,000 uint numAvailableTokens.
- Pick a number between 0 and numAvailableTokens. -1
- Think of #6500—look at index #6500. If it's 0, the next token id is #6500. If not, the value at index #6500 is your next token id (weird!)
- Examine the array's last value, numAvailableTokens — 1. If it's 0, move the value at #6500 to the end of the array (#9999 if it's the first token). If the array's last value is not zero, update index #6500 to store it.
- numAvailableTokens is decreased by 1.
- Repeat 3–6 for the next token id.
So there you go! The array stays the same size, but we can choose an available id reliably. The Solidity code is as follows:
Unfortunately, this algorithm uses more gas than the leading sequential mint solution, ERC721A.
This is most noticeable when minting multiple tokens in one transaction—a 10 token mint on ERC721R costs 5x more than on ERC721A. That said, ERC721A has been optimized much further than ERC721R so there is probably room for improvement.
Conclusion
Listed below are your options:
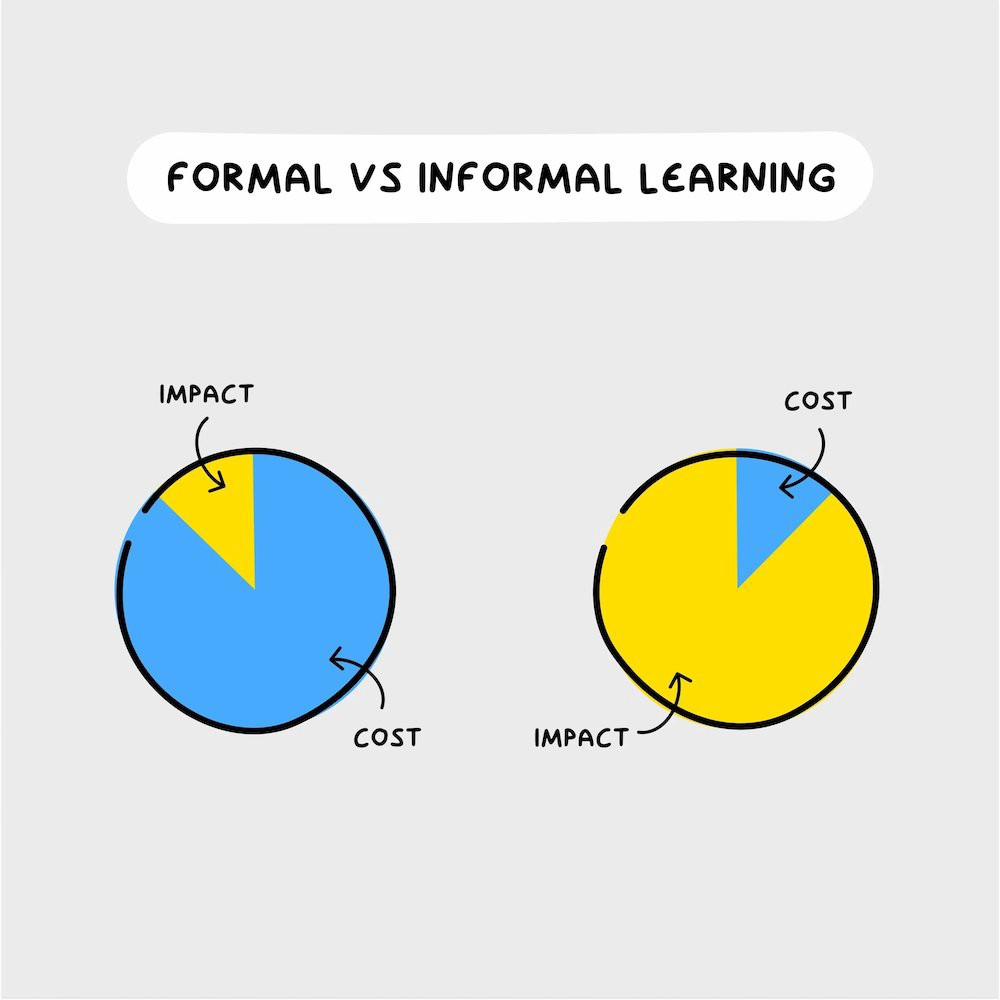
- ERC721A: Minters pay lower gas but must spend time and energy devising and executing a competitive minting strategy or be comfortable with worse minting results.
- ERC721R: Higher gas, but the easy minting strategy of just clicking the button is optimal in all but the most extreme cases. If miners game ERC721R it’s the worst of both worlds: higher gas and a ton of work to compete.
- ERC721A + standard reveal: Low gas, but not verifiably fair. Please do not do this!
- ERC721A + trustless reveal: The best solution if done correctly, highly-challenging for dev, potential for difficult-to-correct errors.
Did I miss something? Comment or tweet me @dumbnamenumbers.
Check out the code on GitHub to learn more! Pull requests are welcome—I'm sure I've missed many gas-saving opportunities.
Thanks!
Read the original post here
More on NFTs & Art

shivsak
3 years ago
A visual exploration of the REAL use cases for NFTs in the Future
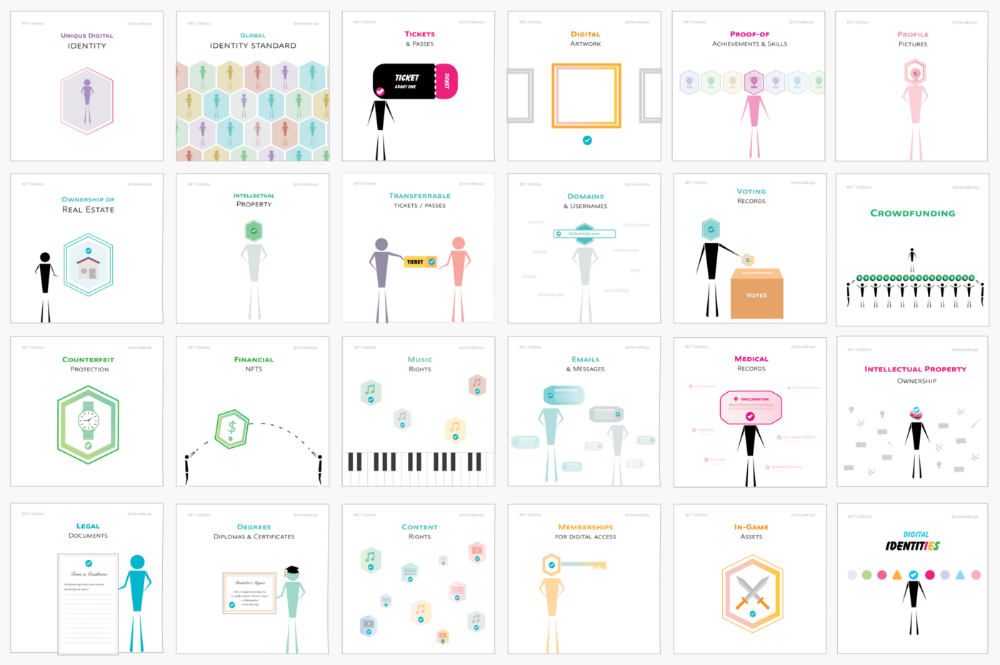
In this essay, I studied REAL NFT use examples and their potential uses.
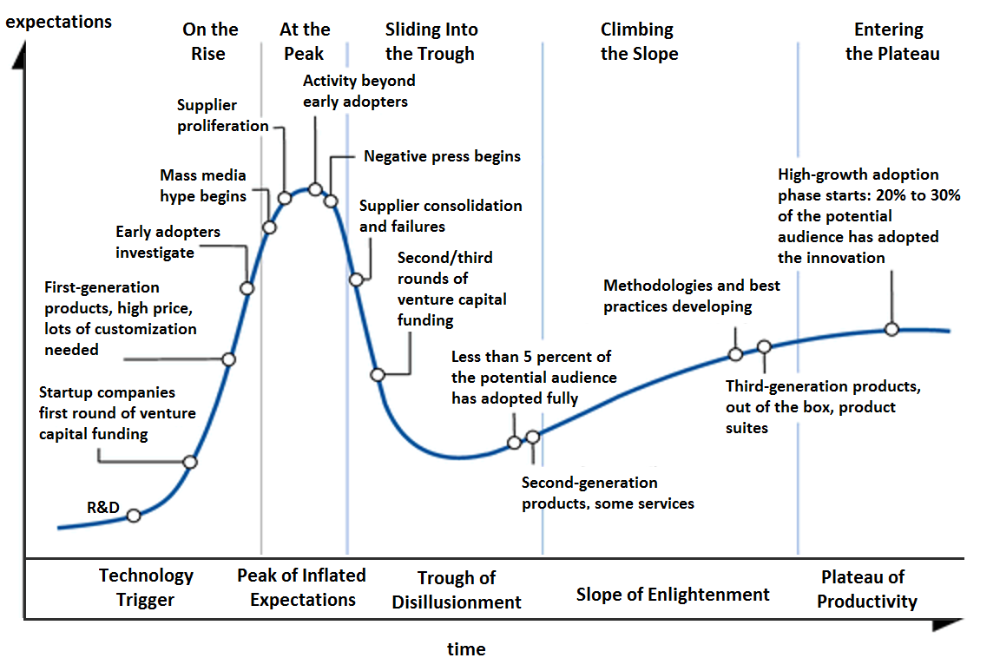
Knowledge of the Hype Cycle
Gartner's Hype Cycle.
It proposes 5 phases for disruptive technology.
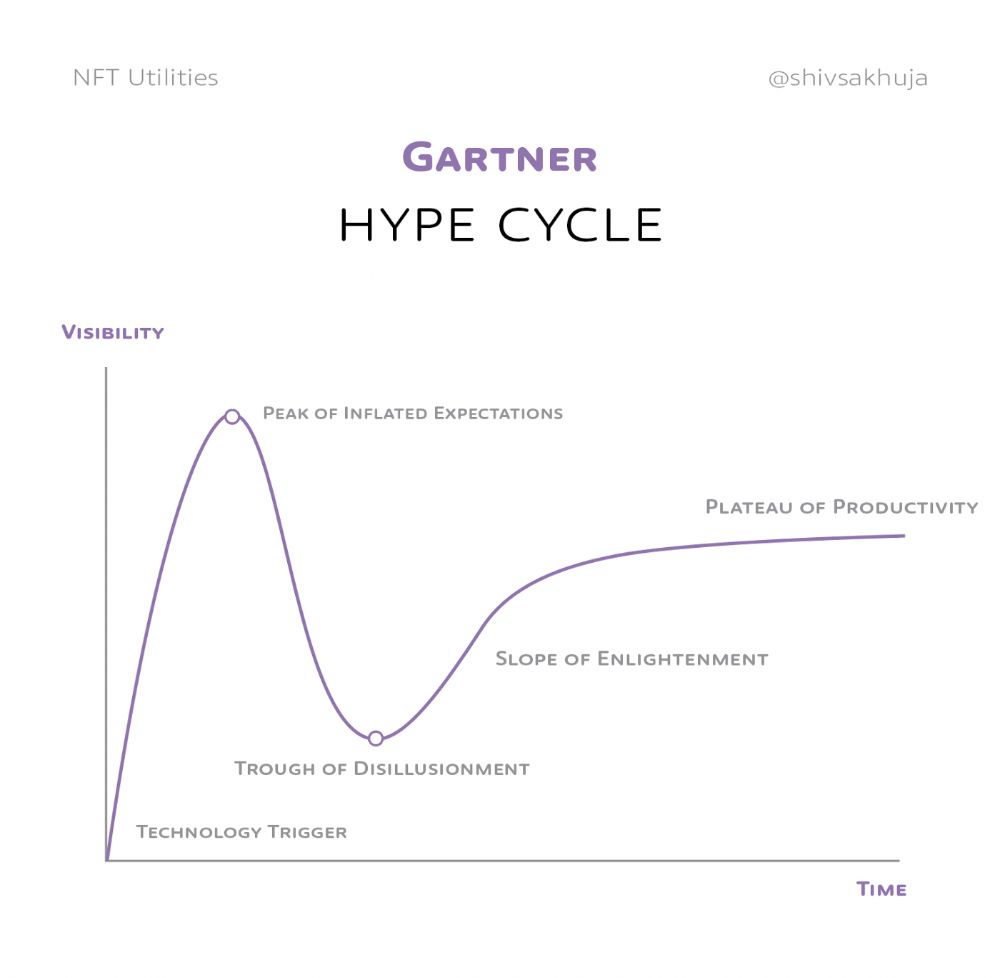
1. Technology Trigger: the emergence of potentially disruptive technology.
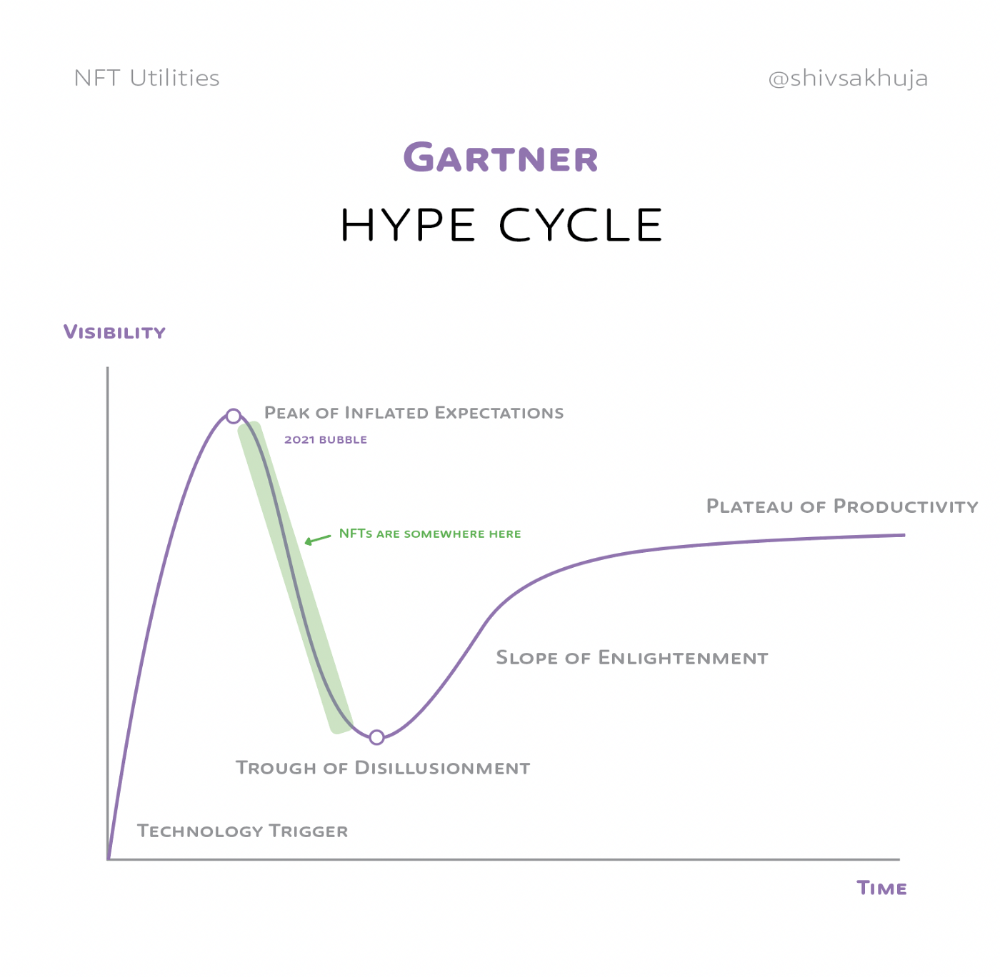
2. Peak of Inflated Expectations: Early publicity creates hype. (Ex: 2021 Bubble)
3. Trough of Disillusionment: Early projects fail to deliver on promises and the public loses interest. I suspect NFTs are somewhere around this trough of disillusionment now.
4. Enlightenment slope: The tech shows successful use cases.
5. Plateau of Productivity: Mainstream adoption has arrived and broader market applications have proven themselves. Here’s a more detailed visual of the Gartner Hype Cycle from Wikipedia.
In the speculative NFT bubble of 2021, @beeple sold Everydays: the First 5000 Days for $69 MILLION in 2021's NFT bubble.
@nbatopshot sold millions in video collectibles.
This is when expectations peaked.
Let's examine NFTs' real-world applications.
Watch this video if you're unfamiliar with NFTs.
Online Art
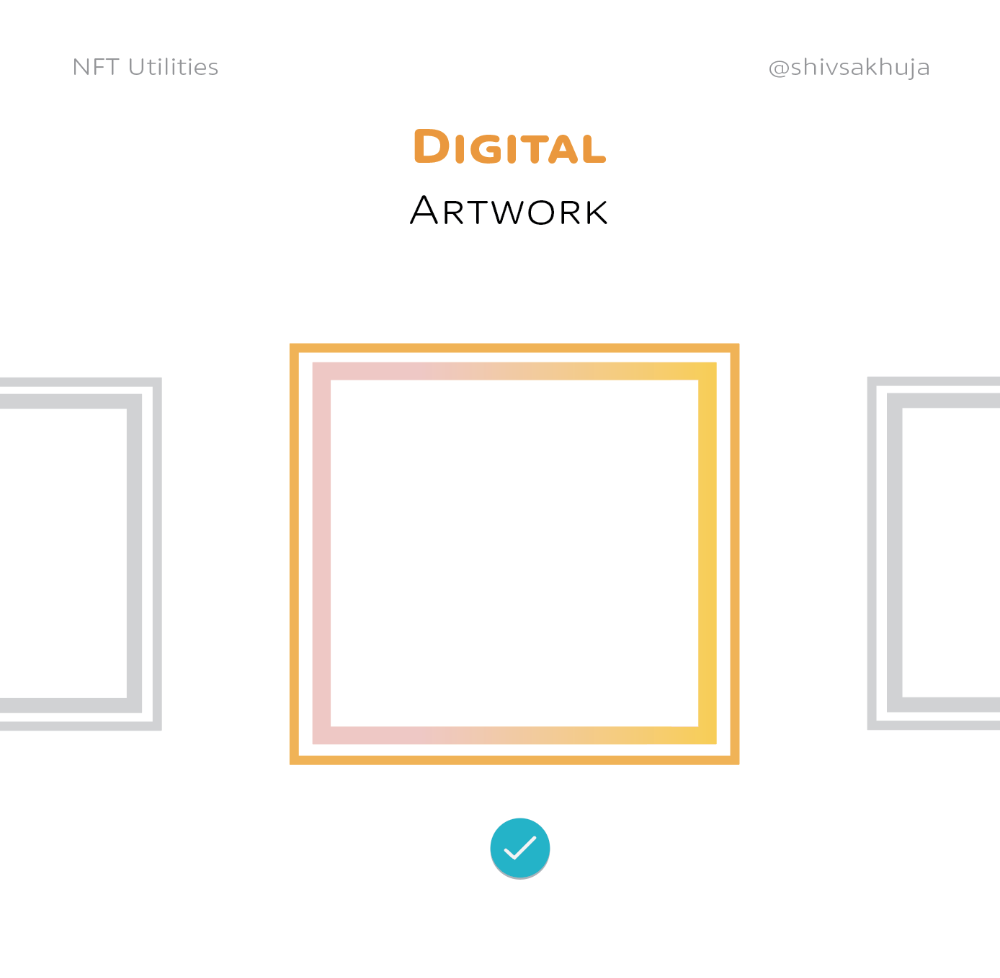
Most people think NFTs are rich people buying worthless JPEGs and MP4s.
Digital artwork and collectibles are revolutionary for creators and enthusiasts.
NFT Profile Pictures
You might also have seen NFT profile pictures on Twitter.
My profile picture is an NFT I coined with @skogards factoria app, which helps me avoid bogus accounts.
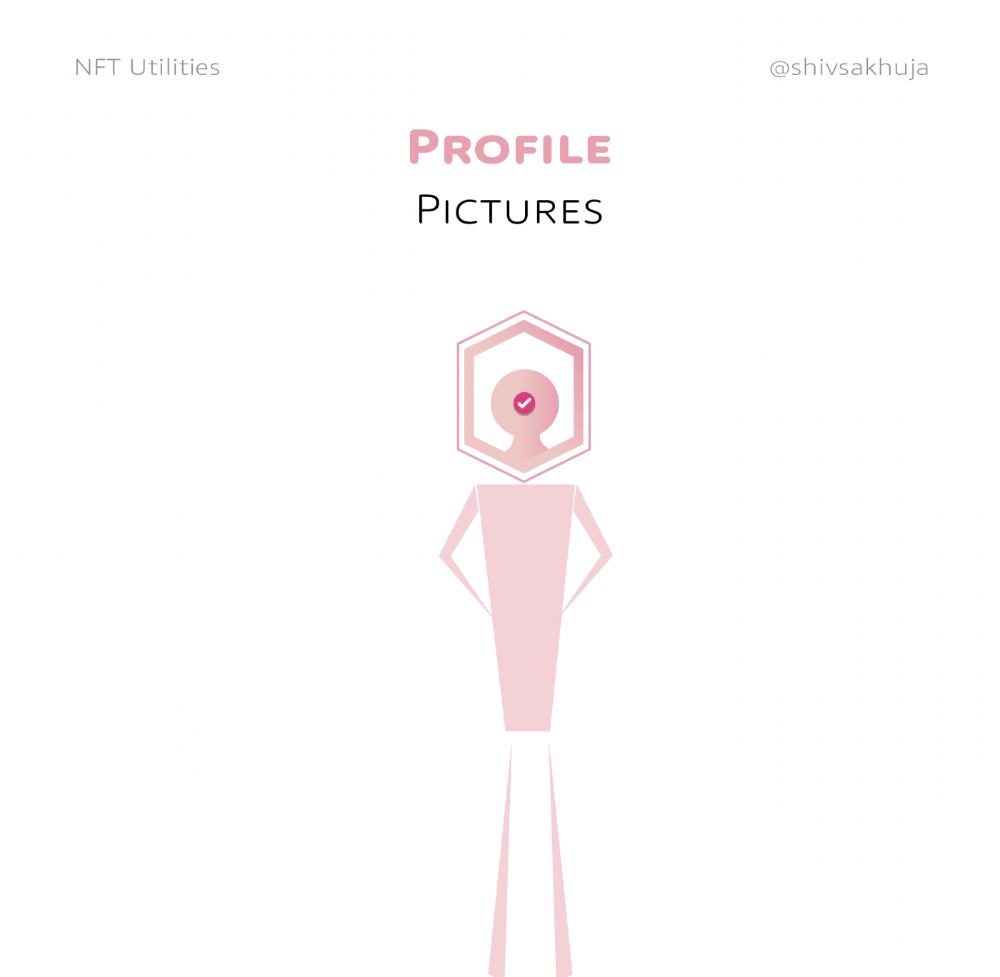
Profile pictures are a good beginning point because they're unique and clearly yours.
NFTs are a way to represent proof-of-ownership. It’s easier to prove ownership of digital assets than physical assets, which is why artwork and pfps are the first use cases.
They can do much more.
NFTs can represent anything with a unique owner and digital ownership certificate. Domains and usernames.
Usernames & Domains
@unstoppableweb, @ensdomains, @rarible sell NFT domains.
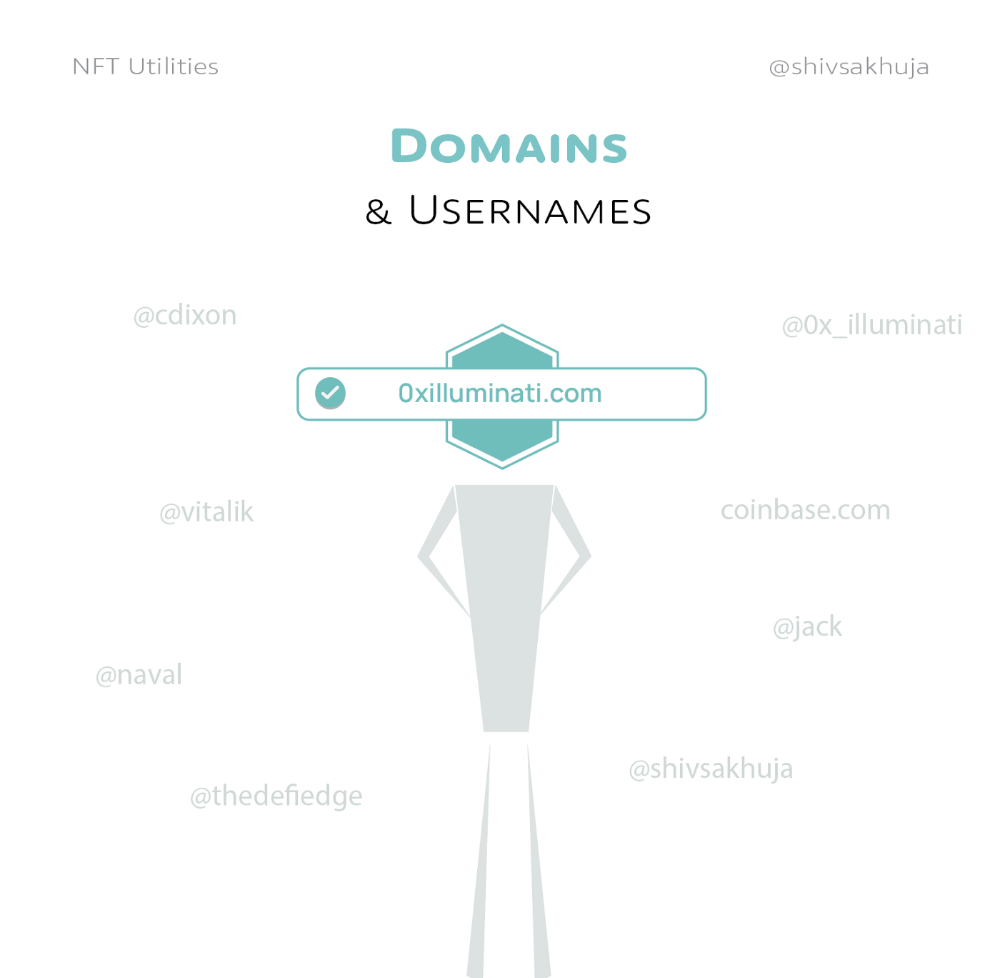
NFT domains are transferable, which is a benefit.
Godaddy and other web2 providers have difficult-to-transfer domains. Domains are often leased instead of purchased.
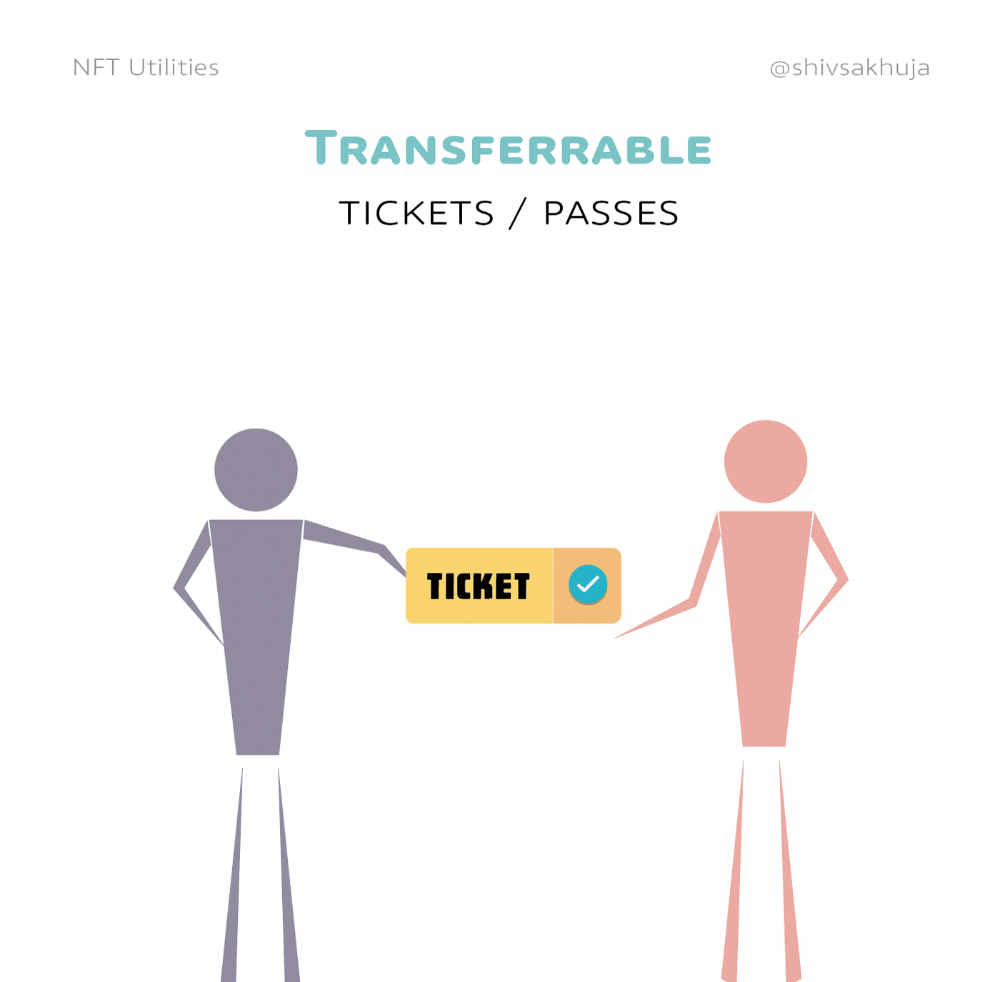
Tickets
NFTs can also represent concert tickets and event passes.
There's a limited number, and entry requires proof.
NFTs can eliminate the problem of forgery and make it easy to verify authenticity and ownership.
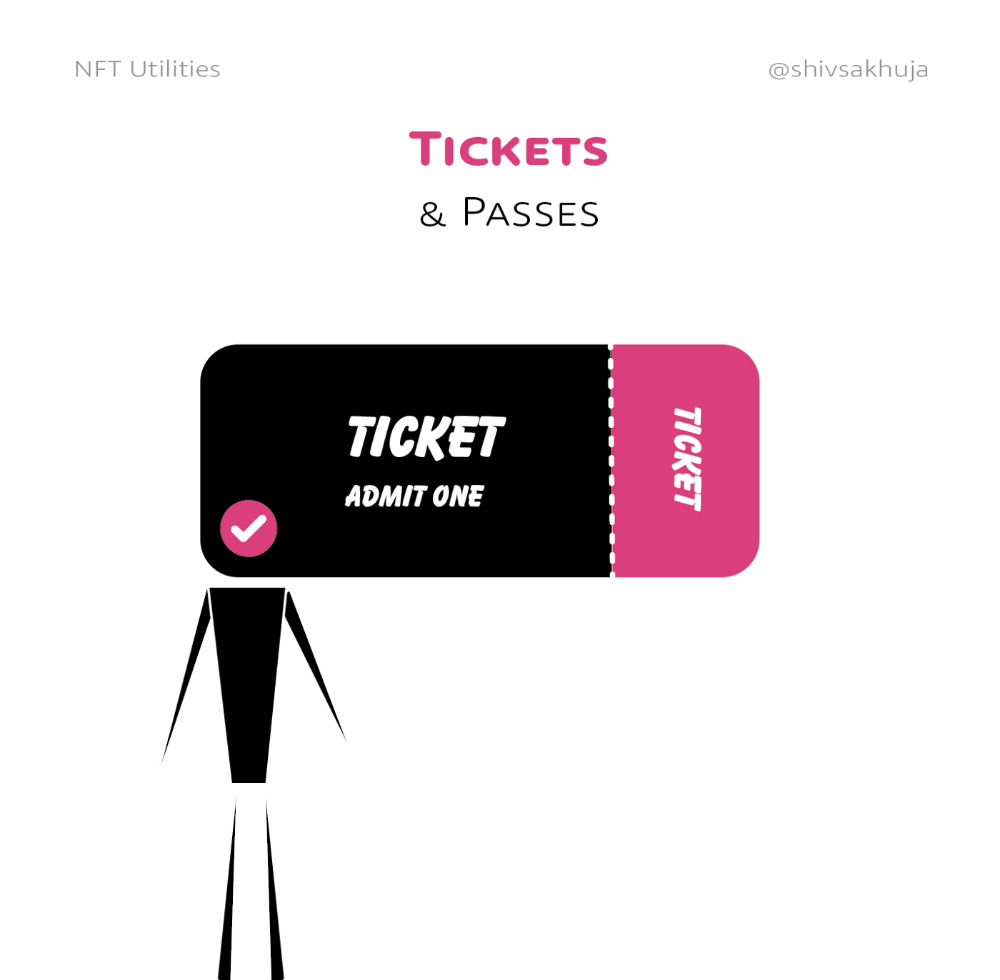
NFT tickets can be traded on the secondary market, which allows for:
marketplaces that are uniform and offer the seller and buyer security (currently, tickets are traded on inefficient markets like FB & craigslist)
unbiased pricing
Payment of royalties to the creator
4. Historical ticket ownership data implies performers can airdrop future passes, discounts, etc.
5. NFT passes can be a fandom badge.
The $30B+ online tickets business is increasing fast.
NFT-based ticketing projects:
Gaming Assets
NFTs also help in-game assets.
Imagine someone spending five years collecting a rare in-game blade, then outgrowing or quitting the game. Gamers value that collectible.
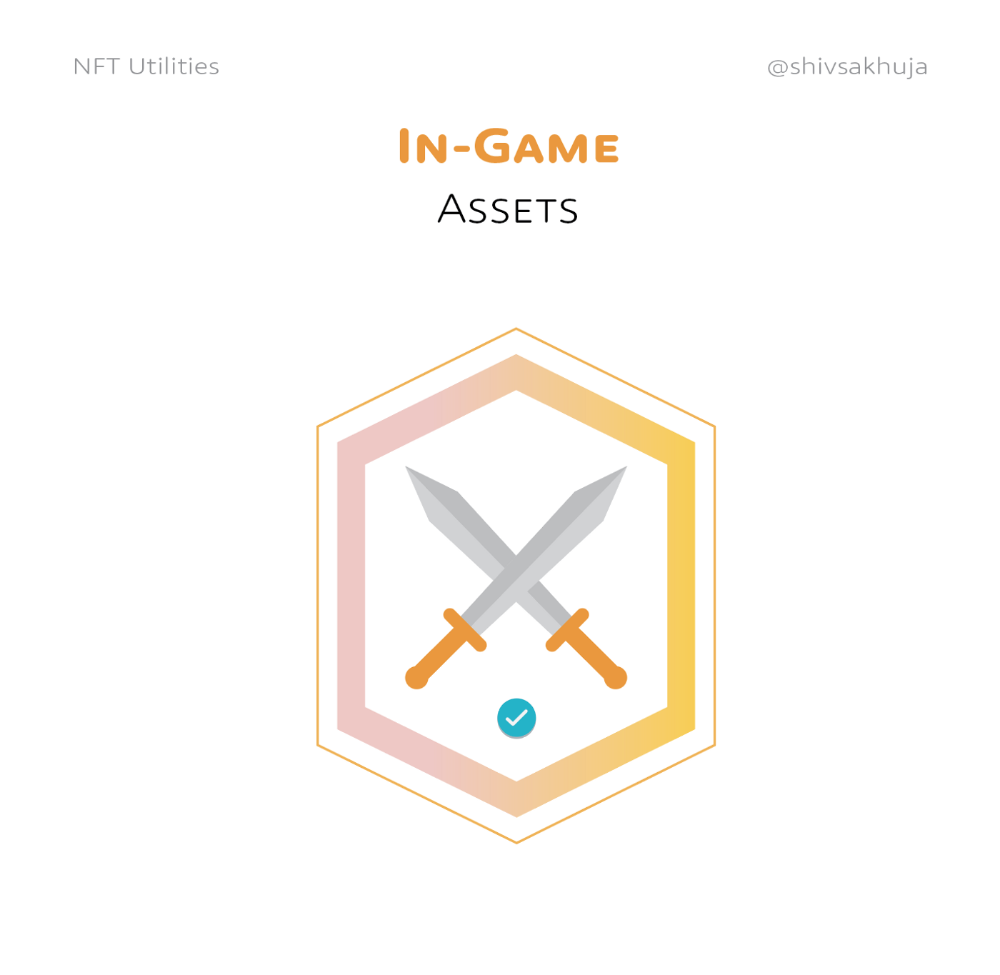
The gaming industry is expected to make $200 BILLION in revenue this year, a significant portion of which comes from in-game purchases.
Royalties on secondary market trading of gaming assets encourage gaming businesses to develop NFT-based ecosystems.
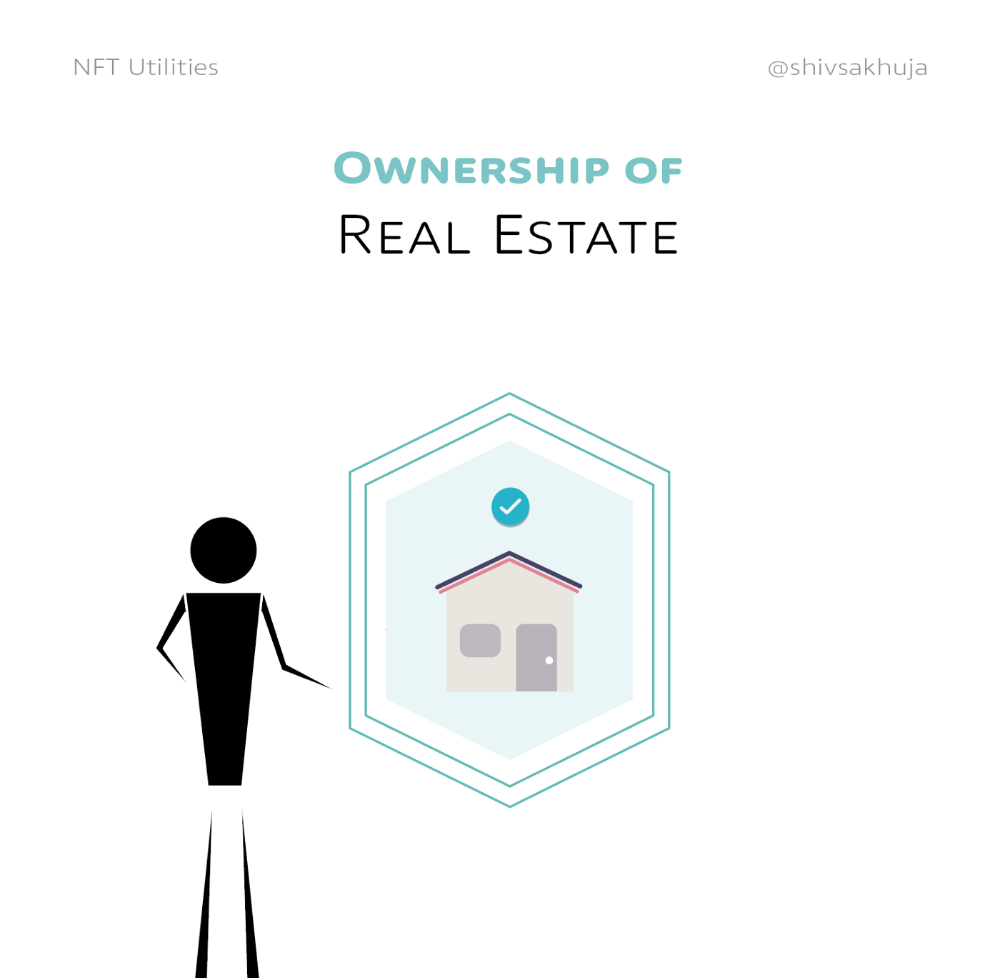
Digital assets are the start. On-chain NFTs can represent real-world assets effectively.
Real estate has a unique owner and requires ownership confirmation.
Real Estate
Tokenizing property has many benefits.
1. Can be fractionalized to increase access, liquidity
2. Can be collateralized to increase capital efficiency and access to loans backed by an on-chain asset
3. Allows investors to diversify or make bets on specific neighborhoods, towns or cities +++
I've written about this thought exercise before.
I made an animated video explaining this.
We've just explored NFTs for transferable assets. But what about non-transferrable NFTs?
SBTs are Soul-Bound Tokens. Vitalik Buterin (Ethereum co-founder) blogged about this.
NFTs are basically verifiable digital certificates.
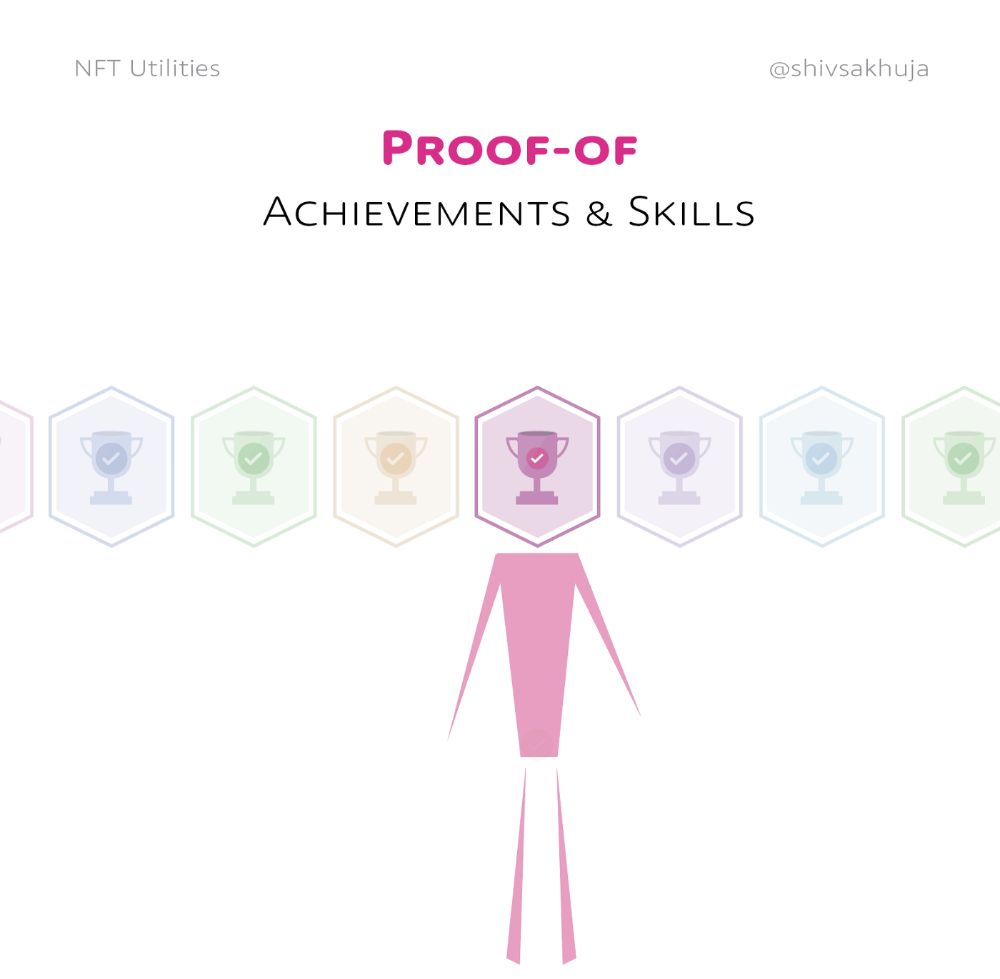
Diplomas & Degrees
That fits Degrees & Diplomas. These shouldn't be marketable, thus they can be non-transferable SBTs.
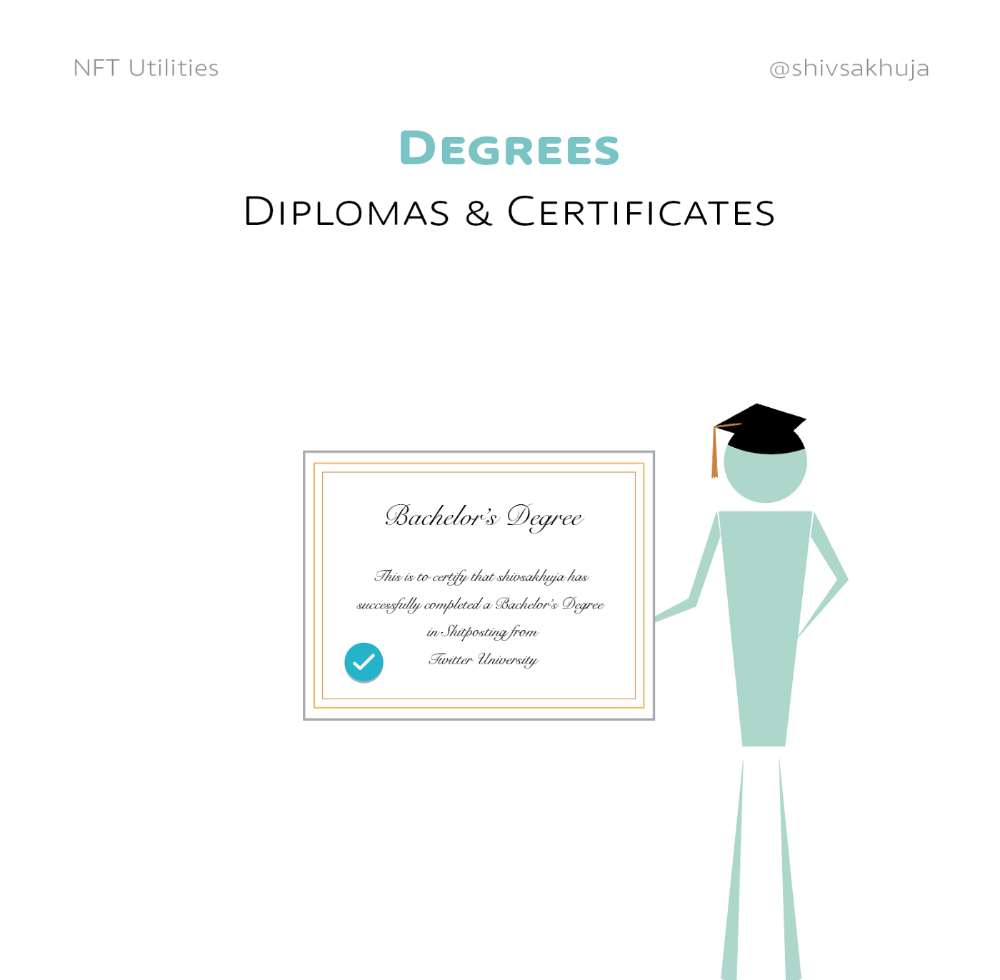
Anyone can verify the legitimacy of on-chain credentials, degrees, abilities, and achievements.
The same goes for other awards.
For example, LinkedIn could give you a verified checkmark for your degree or skills.
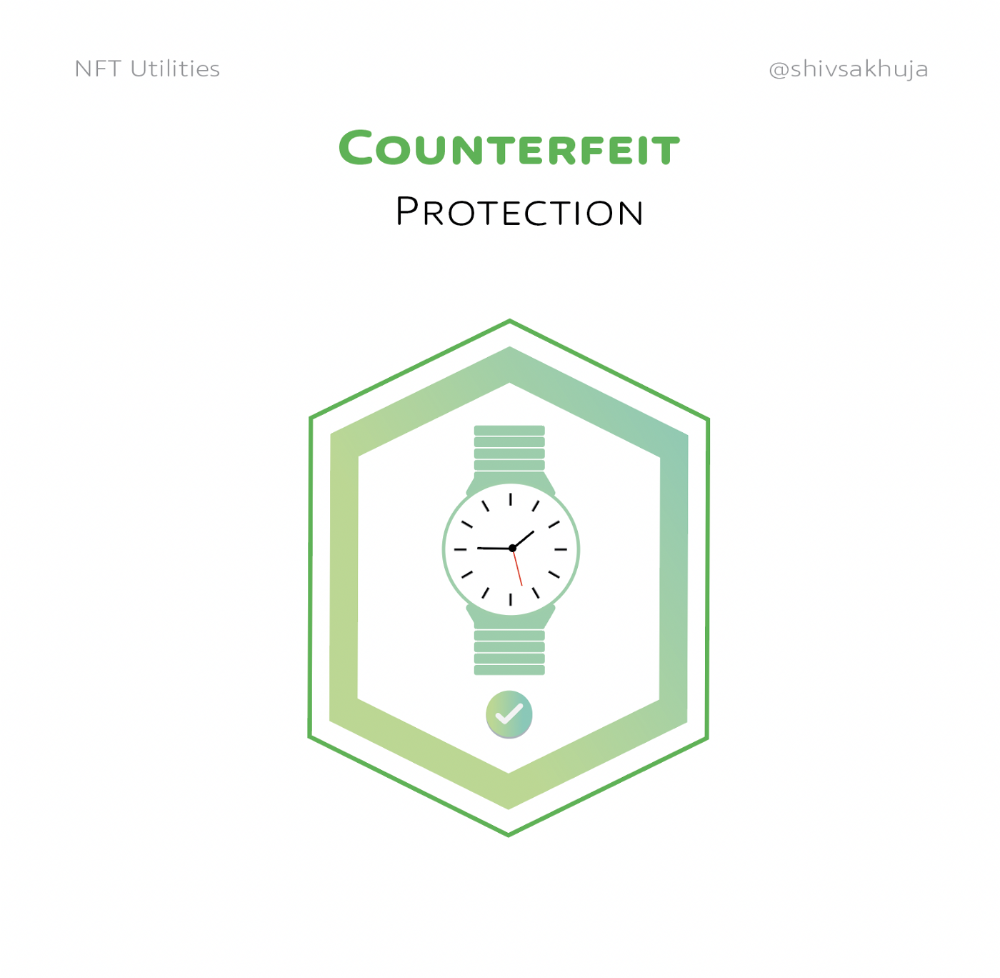
Authenticity Protection
NFTs can also safeguard against counterfeiting.
Counterfeiting is the largest criminal enterprise in the world, estimated to be $2 TRILLION a year and growing.
Anti-counterfeit tech is valuable.
This is one of @ORIGYNTech's projects.
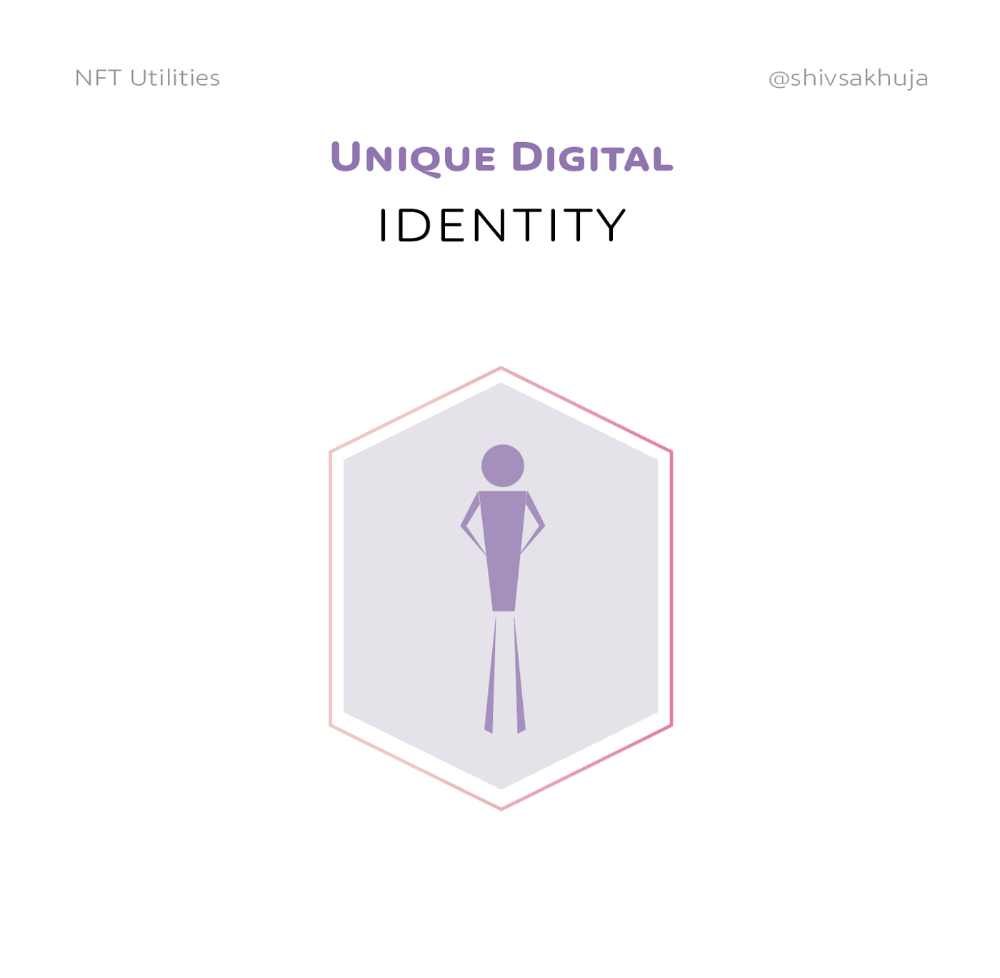
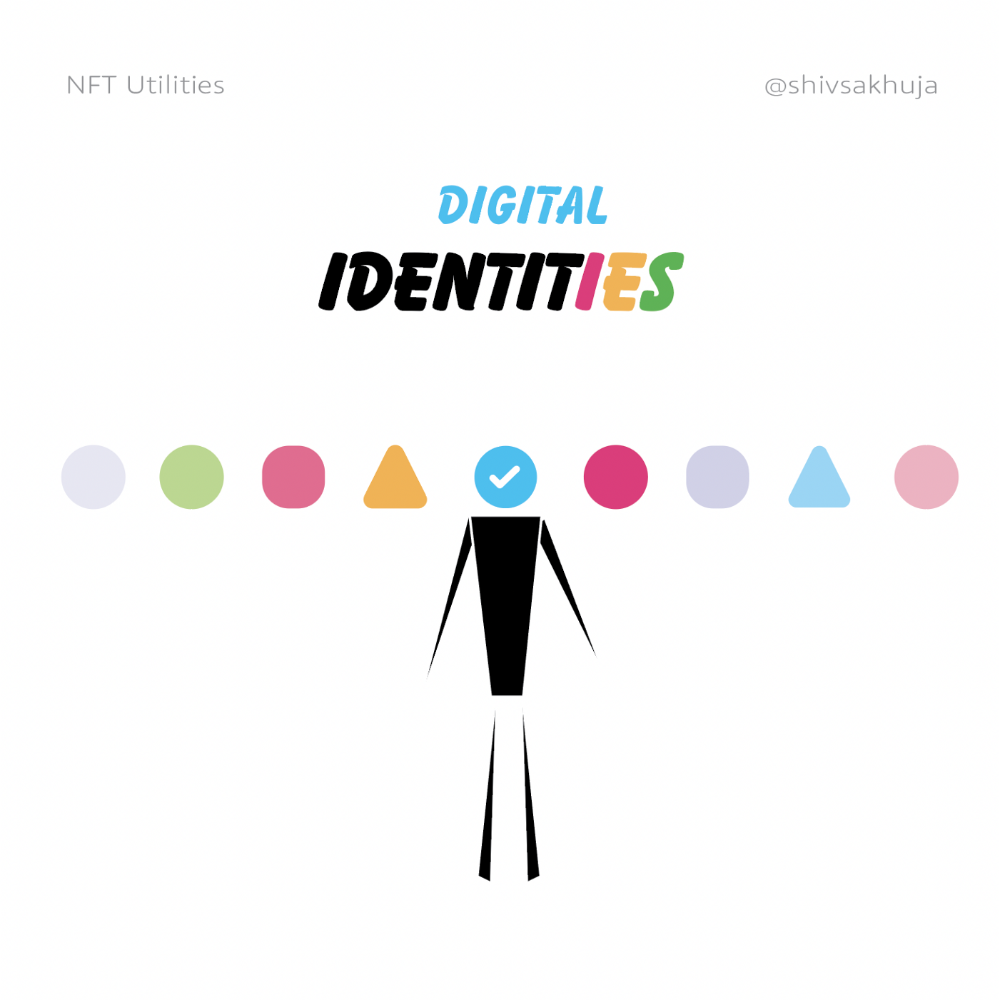
Identity
Identity theft/verification is another real-world problem NFTs can handle.
In the US, 15 million+ citizens face identity theft every year, suffering damages of over $50 billion a year.
This isn't surprising considering all you need for US identity theft is a 9-digit number handed around in emails, documents, on the phone, etc.
Identity NFTs can fix this.
NFTs are one-of-a-kind and unforgeable.
NFTs offer a universal standard.
NFTs are simple to verify.
SBTs, or non-transferrable NFTs, are tied to a particular wallet.
In the event of wallet loss or theft, NFTs may be revoked.
This could be one of the biggest use cases for NFTs.
Imagine a global identity standard that is standardized across countries, cannot be forged or stolen, is digital, easy to verify, and protects your private details.
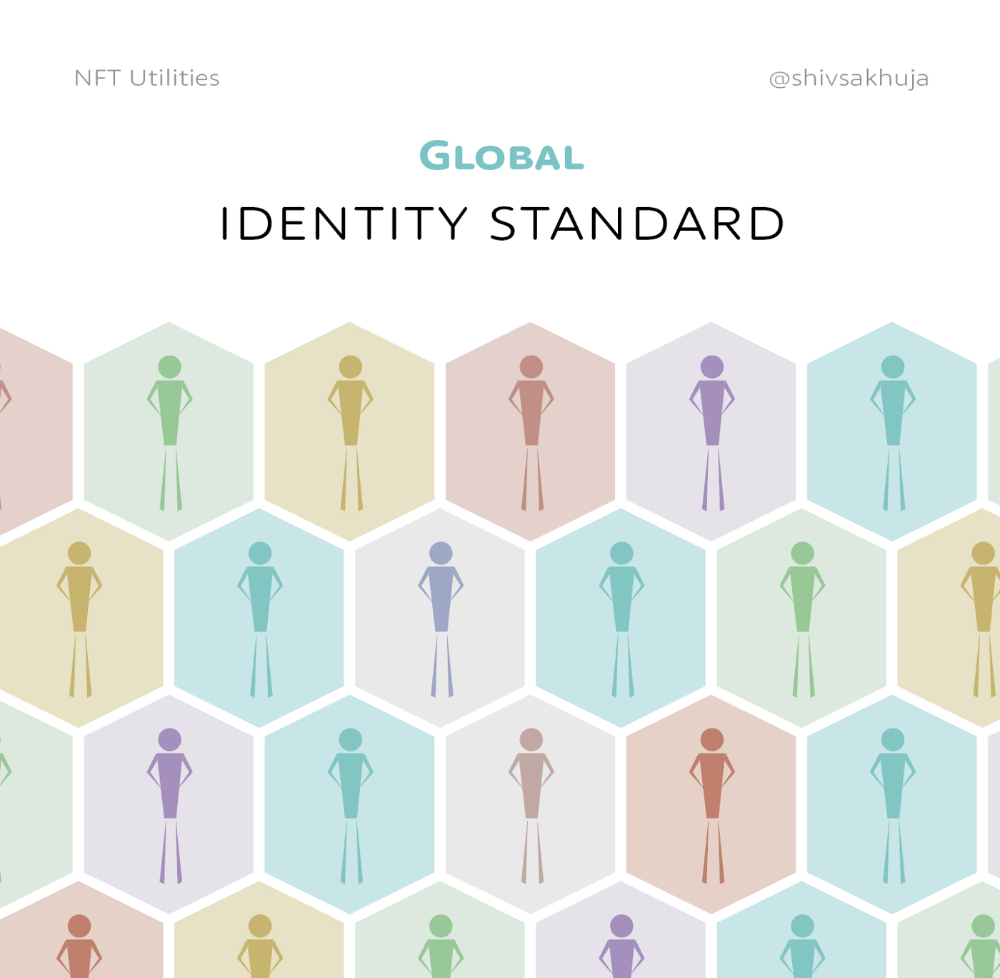
Since your identity is more than your government ID, you may have many NFTs.
@0xPolygon and @civickey are developing on-chain identity.
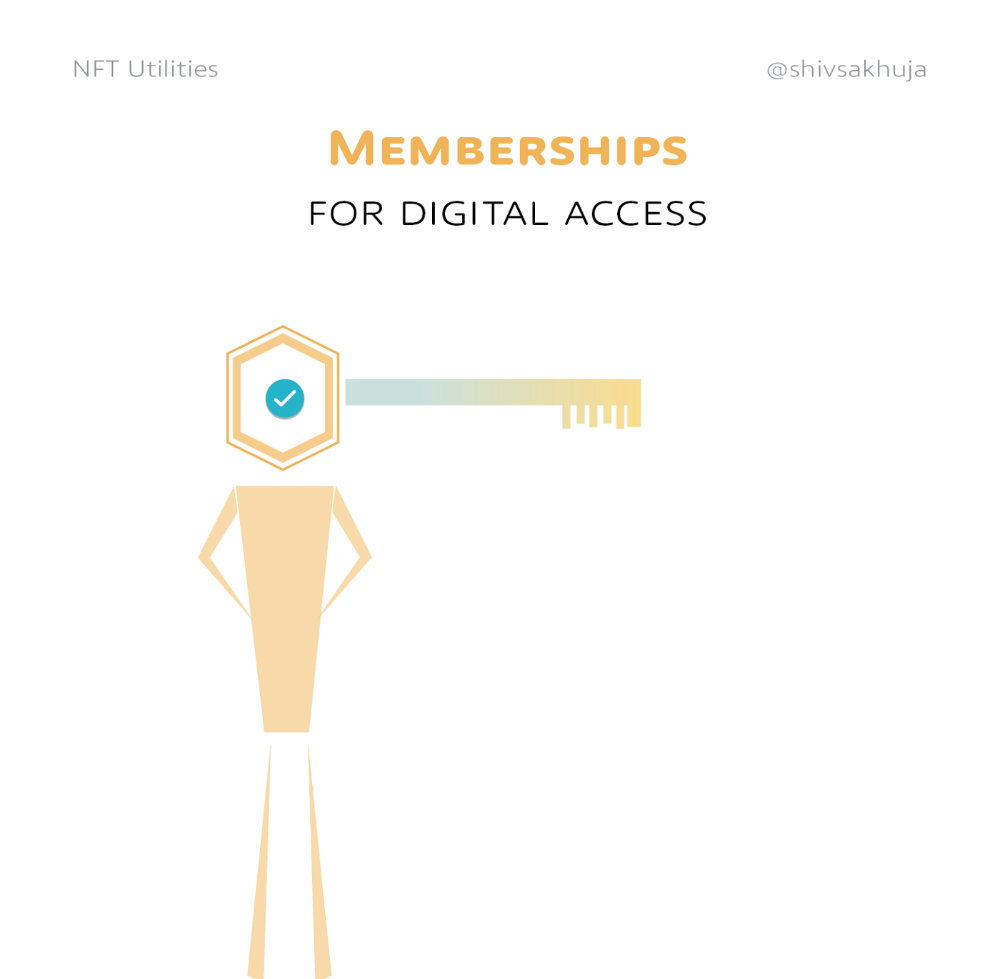
Memberships
NFTs can authenticate digital and physical memberships.
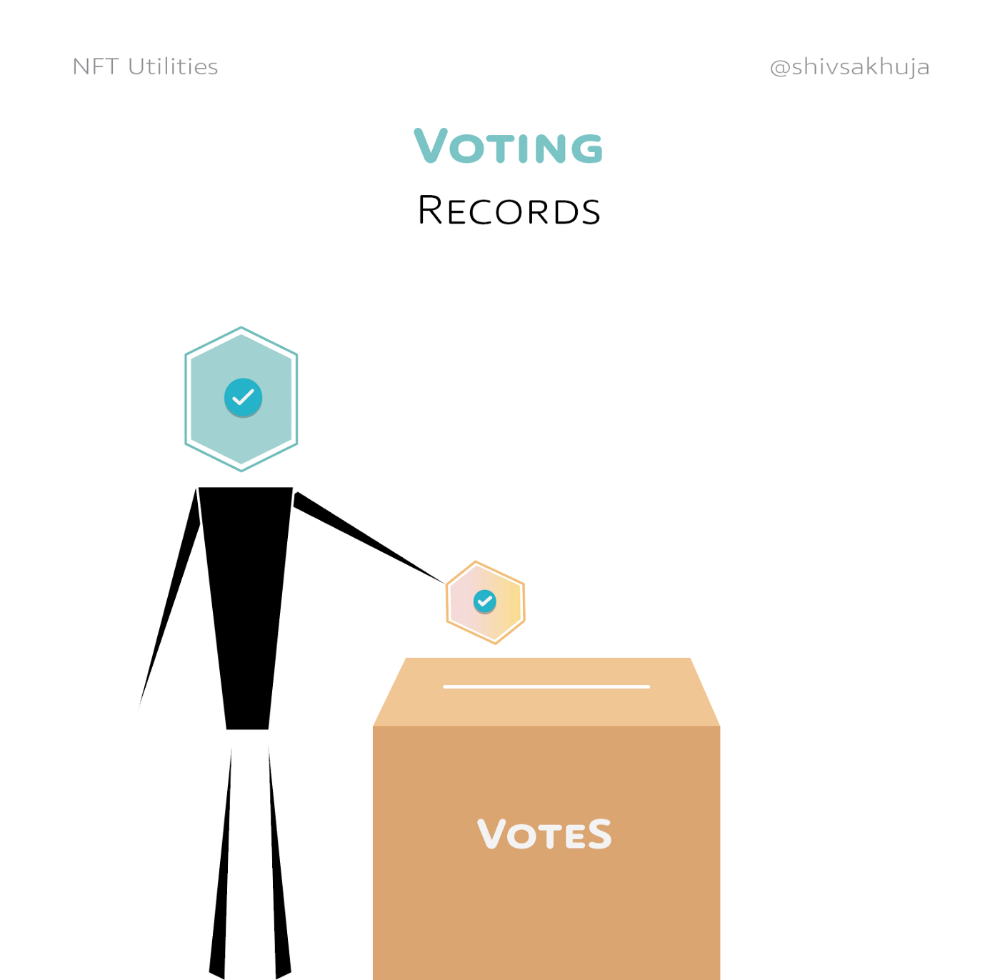
Voting
NFT IDs can verify votes.
If you remember 2020, you'll know why this is an issue.
Online voting's ease can boost turnout.
Informational property
NFTs can protect IP.
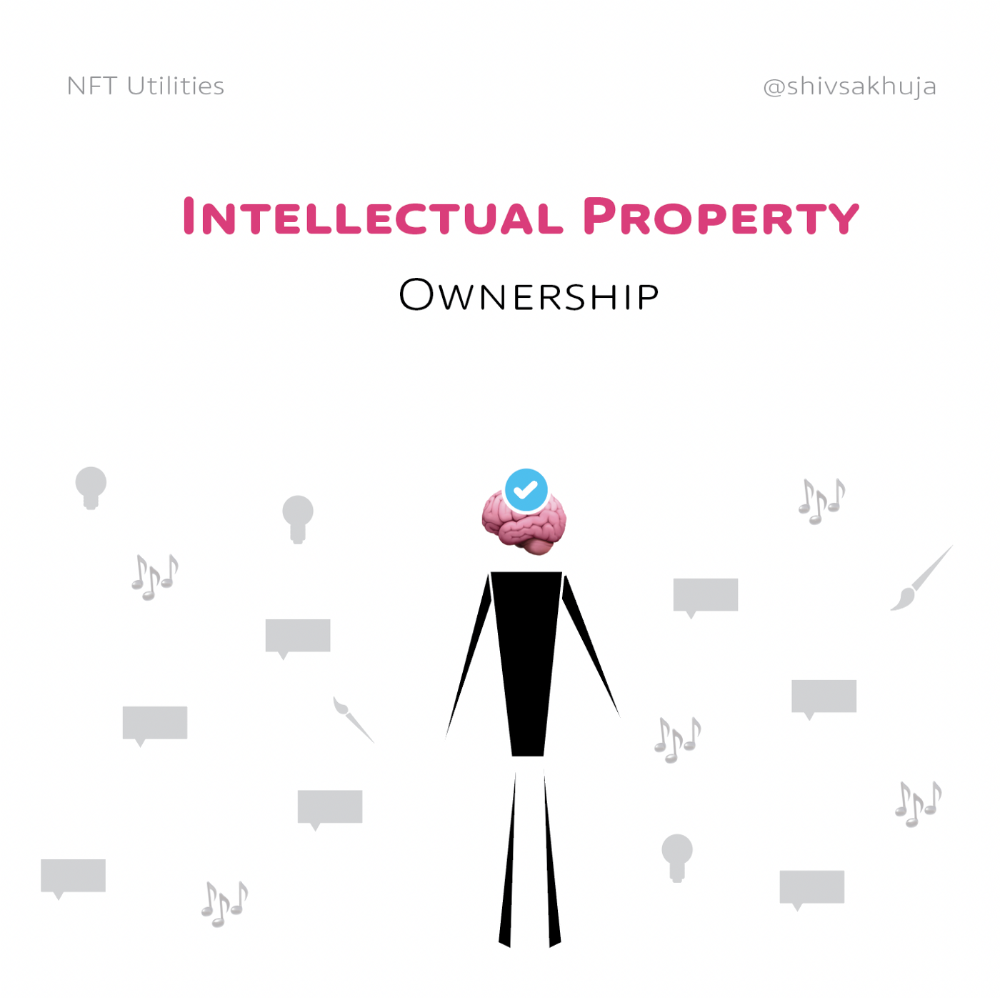
This can earn creators royalties.
NFTs have 2 important properties:
Verifiability IP ownership is unambiguously stated and publicly verified.
Platforms that enable authors to receive royalties on their IP can enter the market thanks to standardization.
Content Rights
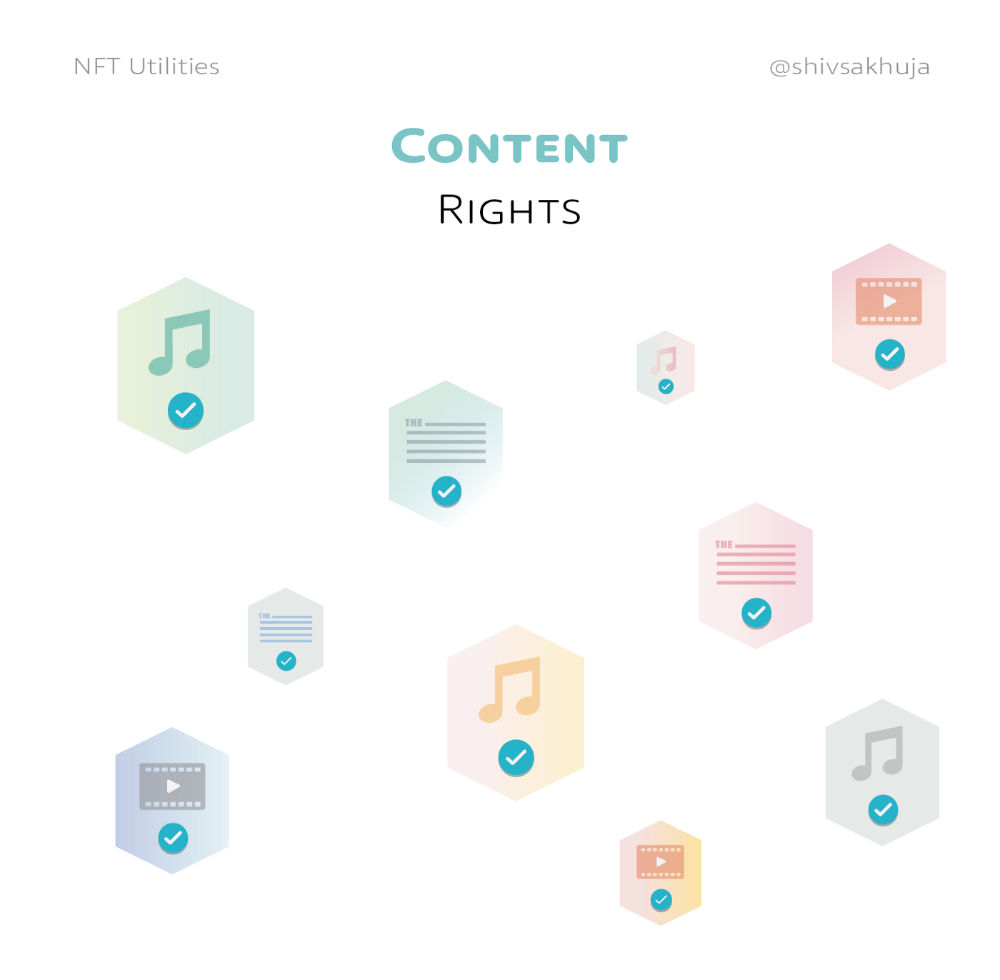
Monetization without copyrighting = more opportunities for everyone.
This works well with the music.
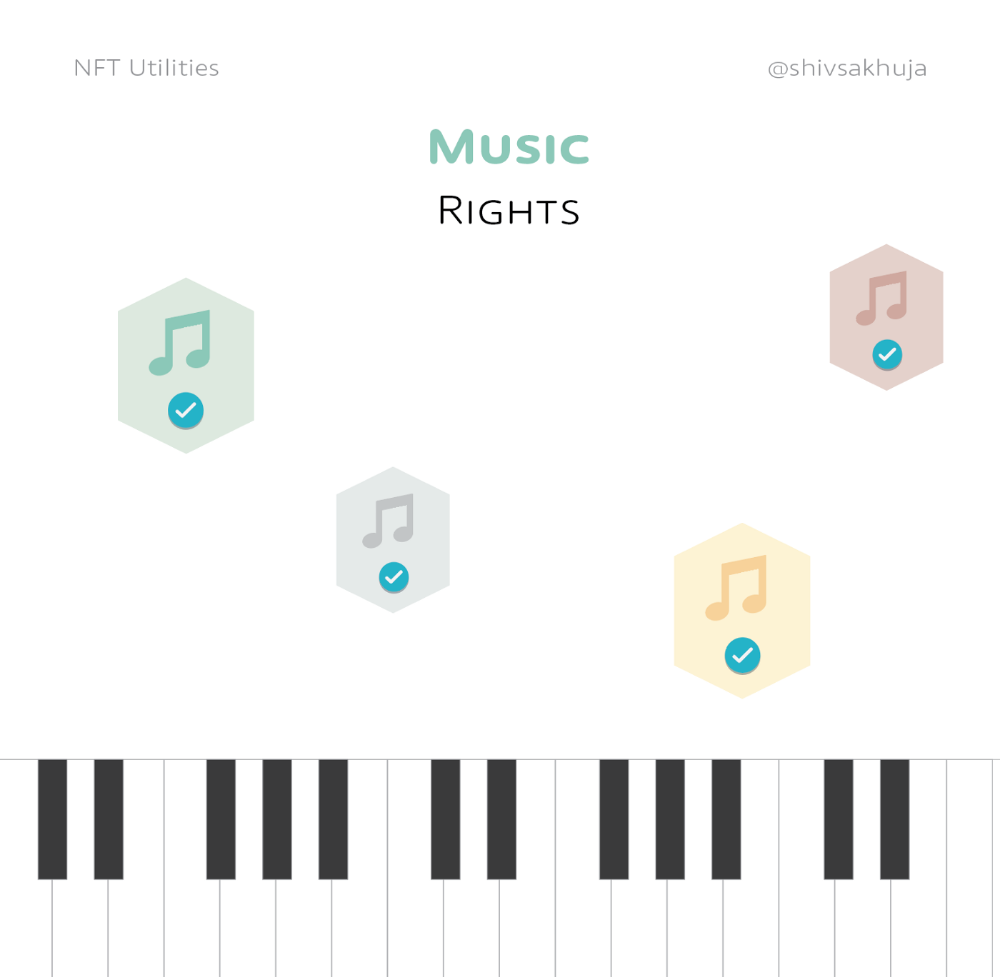
Spotify and Apple Music pay creators very little.
Crowdfunding
Creators can crowdfund with NFTs.
NFTs can represent future royalties for investors.
This is particularly useful for fields where people who are not in the top 1% can’t make money. (Example: Professional sports players)
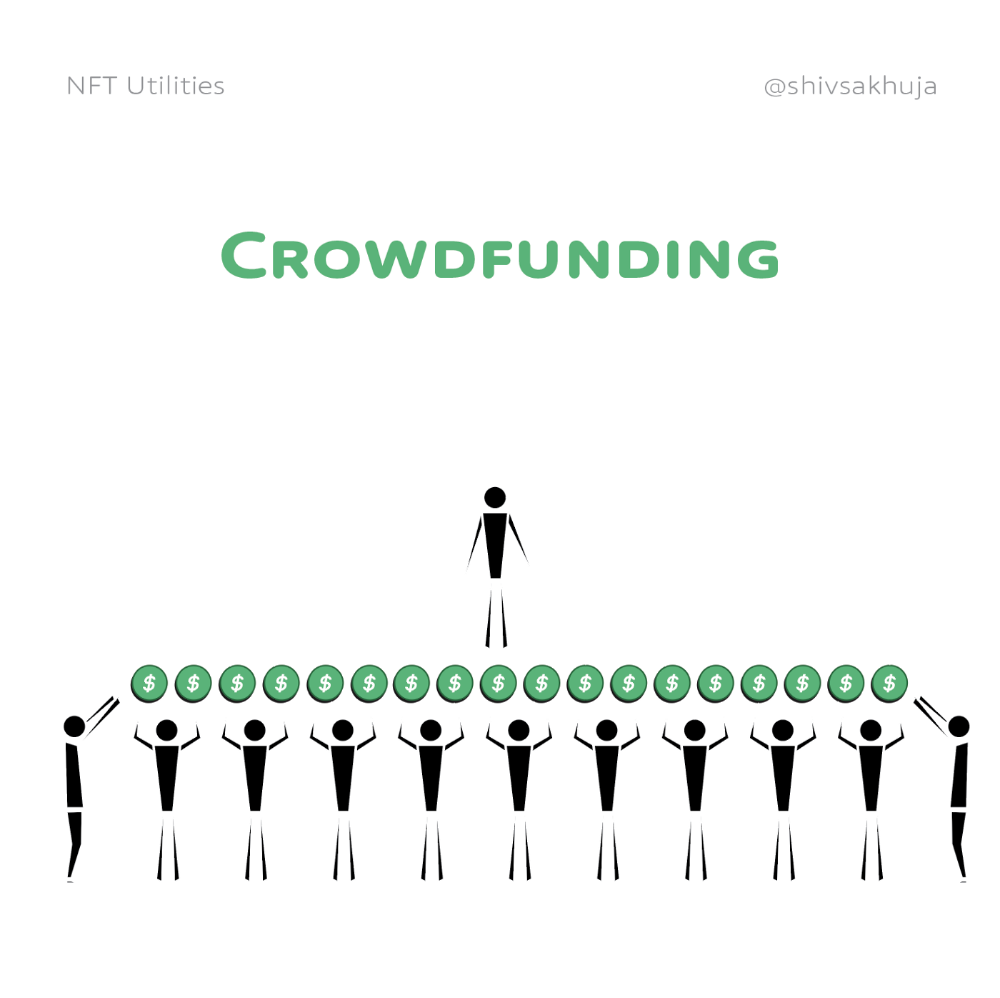
Mirror.xyz allows blog-based crowdfunding.
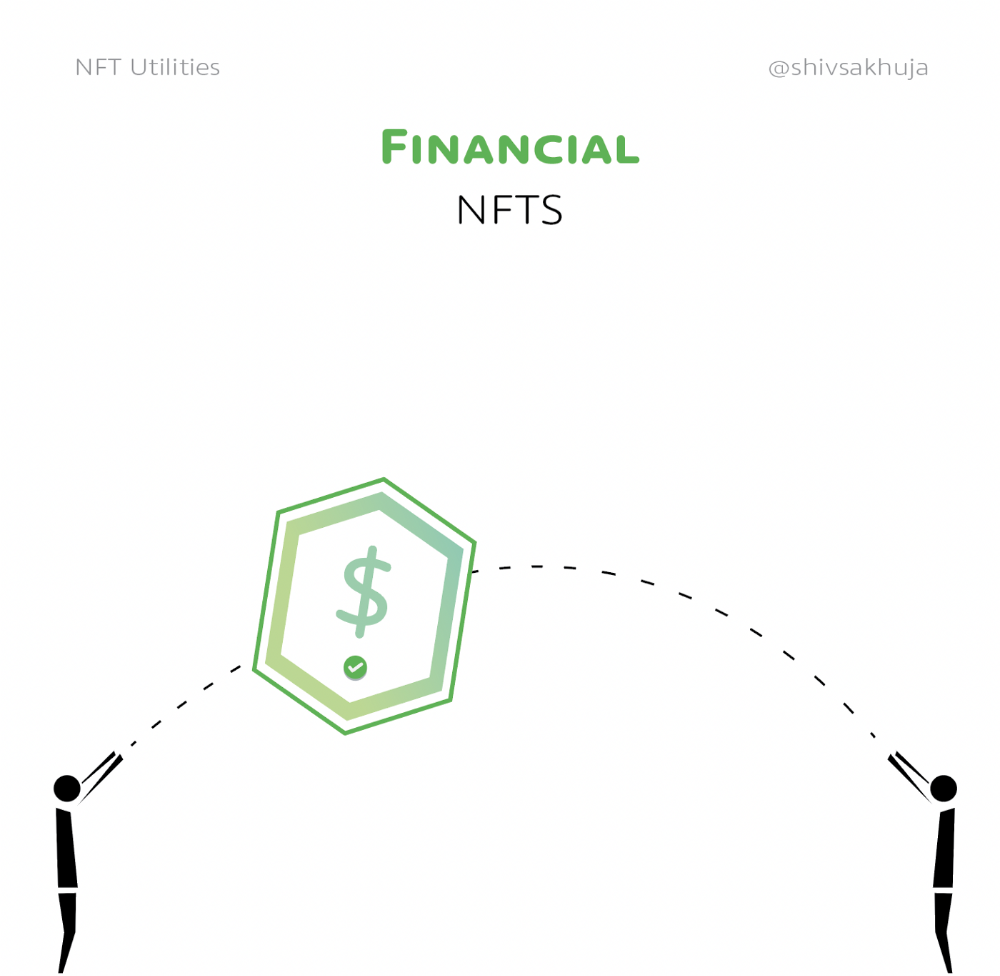
Financial NFTs
This introduces Financial NFTs (fNFTs). Unique financial contracts abound.
Examples:
a person's collection of assets (unique portfolio)
A loan contract that has been partially repaid with a lender
temporal tokens (ex: veCRV)
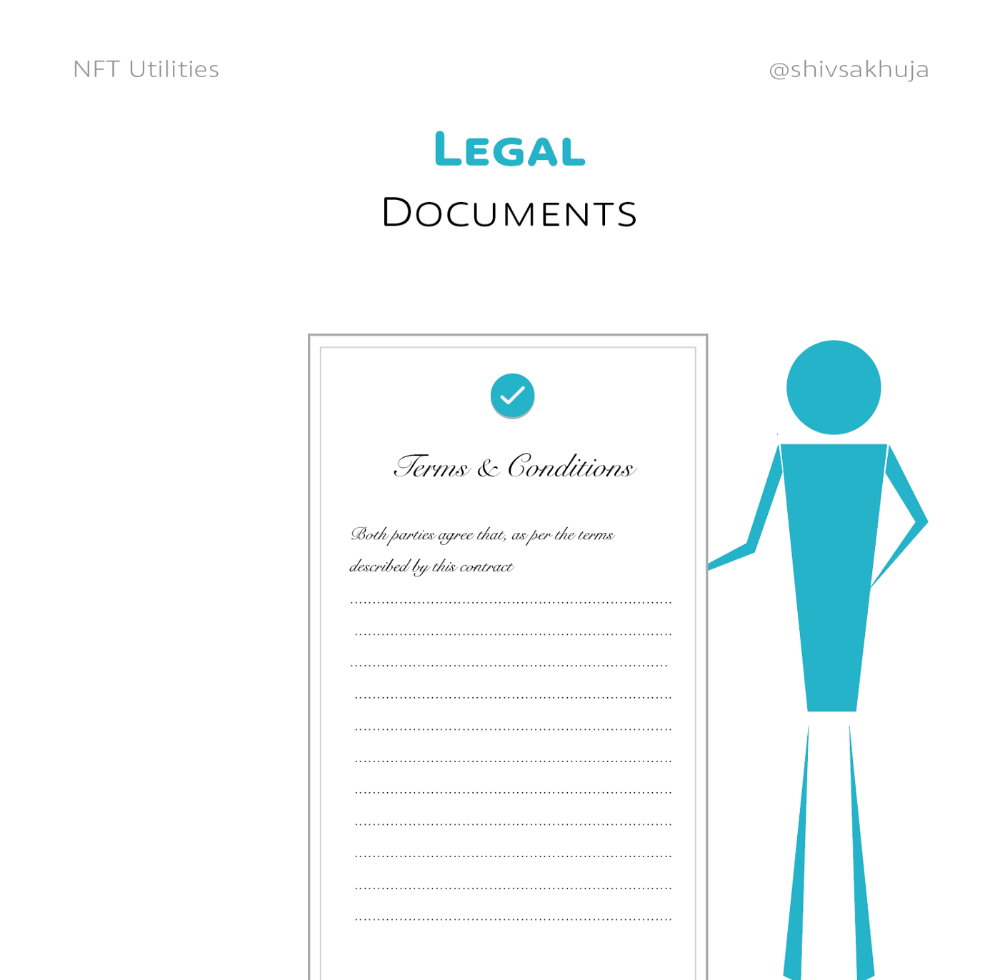
Legal Agreements
Not just financial contracts.
NFT can represent any legal contract or document.
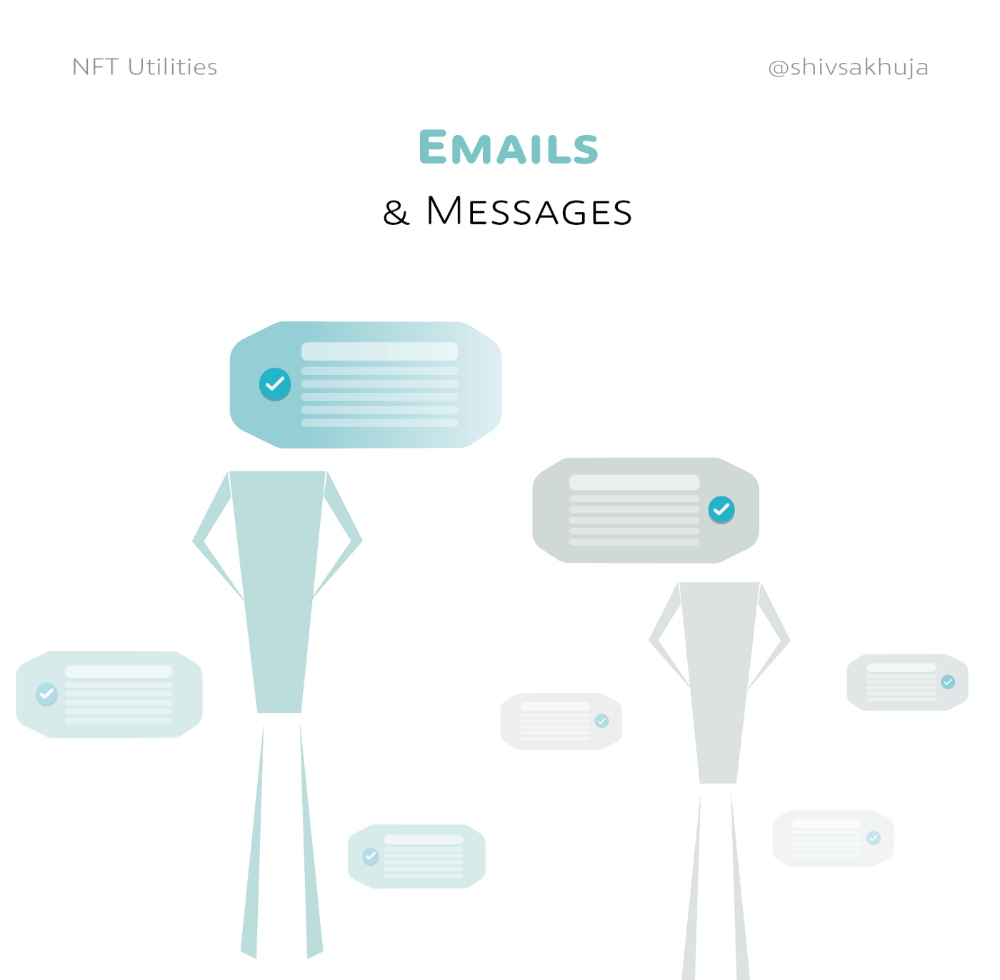
Messages & Emails
What about other agreements? Verbal agreements through emails and messages are likewise unique, but they're easily lost and fabricated.
Health Records
Medical records or prescriptions are another types of documentation that has to be verified but isn't.
Medical NFT examples:
Immunization records
Covid test outcomes
Prescriptions
health issues that may affect one's identity
Observations made via health sensors
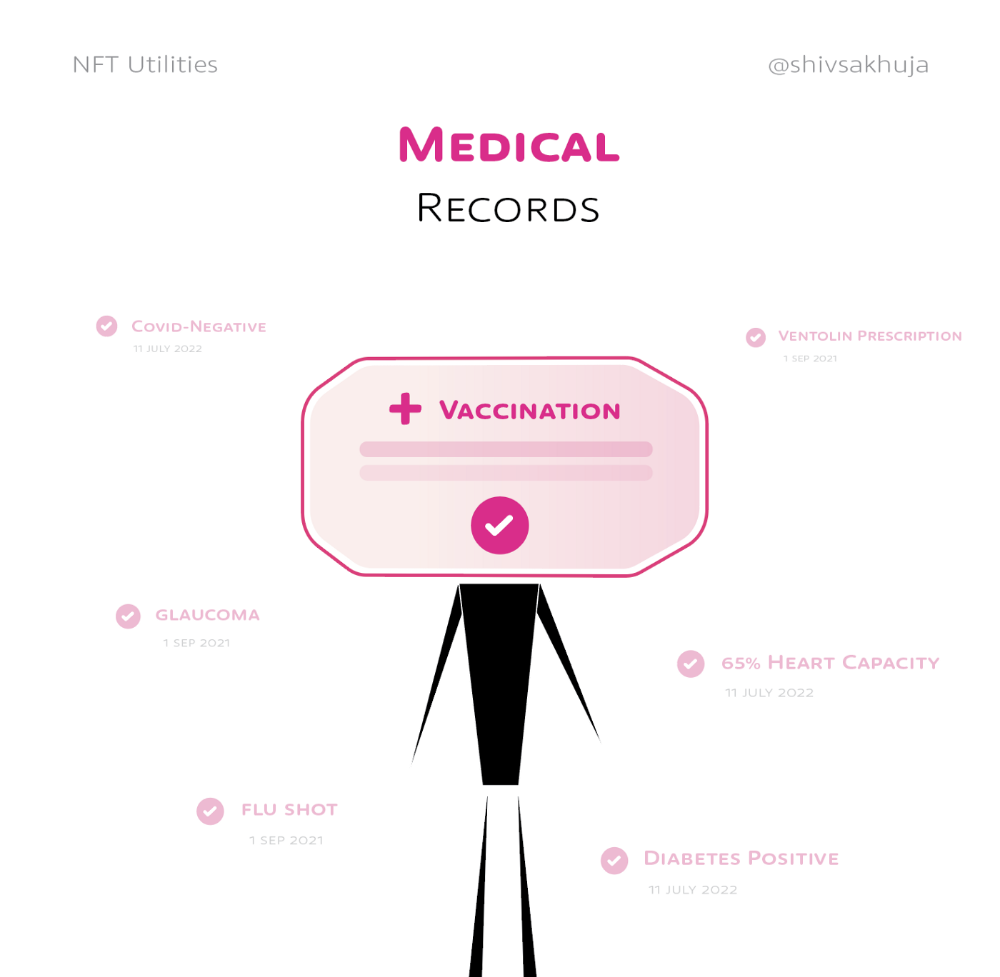
Existing systems of proof by paper / PDF have photoshop-risk.
I tried to include most use scenarios, but this is just the beginning.
NFTs have many innovative uses.
For example: @ShaanVP minted an NFT called “5 Minutes of Fame” 👇
Here are 2 Twitter threads about NFTs:
This piece of gold by @chriscantino
2. This conversation between @punk6529 and @RaoulGMI on @RealVision“The World According to @punk6529”
If you're wondering why NFTs are better than web2 databases for these use scenarios, see this Twitter thread I wrote:
If you liked this, please share it.

Sea Launch
4 years ago
A guide to NFT pre-sales and whitelists
Before we dig through NFT whitelists and pre-sales, if you know absolutely nothing about NFTs, check our NFT Glossary.
What are pre-sales and whitelists on NFTs?
An NFT pre-sale, as the name implies, allows community members or early supporters of an NFT project to mint before the public, usually via a whitelist or mint pass.
Coin collectors can use mint passes to claim NFTs during the public sale. Because the mint pass is executed by “burning” an NFT into a specific crypto wallet, the collector is not concerned about gas price spikes.
A whitelist is used to approve a crypto wallet address for an NFT pre-sale. In a similar way to an early access list, it guarantees a certain number of crypto wallets can mint one (or more) NFT.
New NFT projects can do a pre-sale without a whitelist, but whitelists are good practice to avoid gas wars and a fair shot at minting an NFT before launching in competitive NFT marketplaces like Opensea, Magic Eden, or CNFT.
Should NFT projects do pre-sales or whitelists? 👇
The reasons to do pre-sales or a whitelist for NFT creators:
Time the market and gain traction.
Pre-sale or whitelists can help NFT projects gauge interest early on.
Whitelist spots filling up quickly is usually a sign of a successful launch, though it does not guarantee NFT longevity (more on that later). Also, full whitelists create FOMO and momentum for the public sale among non-whitelisted NFT collectors.
If whitelist signups are low or slow, projects may need to work on their vision, community, or product. Or the market is in a bear cycle. In either case, it aids NFT projects in market timing.
Reward the early NFT Community members.
Pre-sale and whitelists can help NFT creators reward early supporters.
First, by splitting the minting process into two phases, early adopters get a chance to mint one or more NFTs from their collection at a discounted or even free price.
Did you know that BAYC started at 0.08 eth each? A serum that allowed you to mint a Mutant Ape has become as valuable as the original BAYC.
(2) Whitelists encourage early supporters to help build a project's community in exchange for a slot or status. If you invite 10 people to the NFT Discord community, you get a better ranking or even a whitelist spot.
Pre-sale and whitelisting have become popular ways for new projects to grow their communities and secure future buyers.
Prevent gas wars.
Most new NFTs are created on the Ethereum blockchain, which has the highest transaction fees (also known as gas) (Solana, Cardano, Polygon, Binance Smart Chain, etc).
An NFT public sale is a gas war when a large number of NFT collectors (or bots) try to mint an NFT at the same time.
Competing collectors are willing to pay higher gas fees to prioritize their transaction and out-price others when upcoming NFT projects are hyped and very popular.
Pre-sales and whitelisting prevent gas wars by breaking the minting process into smaller batches of members or season launches.
The reasons to do pre-sales or a whitelists for NFT collectors:
How do I get on an NFT whitelist?
- Popular NFT collections act as a launchpad for other new or hyped NFT collections.
Example: Interfaces NFTs gives out 100 whitelist spots to Deadfellaz NFTs holders. Both NFT projects win. Interfaces benefit from Deadfellaz's success and brand equity.
In this case, to get whitelisted NFT collectors need to hold that specific NFT that is acting like a launchpad.
- A NFT studio or collection that launches a new NFT project and rewards previous NFT holders with whitelist spots or pre-sale access.
The whitelist requires previous NFT holders or community members.
NFT Alpha Groups are closed, small, tight-knit Discord servers where members share whitelist spots or giveaways from upcoming NFTs.
The benefit of being in an alpha group is getting information about new NFTs first and getting in on pre-sale/whitelist before everyone else.
There are some entry barriers to alpha groups, but if you're active in the NFT community, you'll eventually bump into, be invited to, or form one.
- A whitelist spot is awarded to members of an NFT community who are the most active and engaged.
This participation reward is the most democratic. To get a chance, collectors must work hard and play to their strengths.
Whitelisting participation examples:
- Raffle, games and contest: NFT Community raffles, games, and contests. To get a whitelist spot, invite 10 people to X NFT Discord community.
- Fan art: To reward those who add value and grow the community by whitelisting the best fan art and/or artists is only natural.
- Giveaways: Lucky number crypto wallet giveaways promoted by an NFT community. To grow their communities and for lucky collectors, NFT projects often offer free NFT.
- Activate your voice in the NFT Discord Community. Use voice channels to get NFT teams' attention and possibly get whitelisted.
The advantage of whitelists or NFT pre-sales.
Chainalysis's NFT stats quote is the best answer:
“Whitelisting isn’t just some nominal reward — it translates to dramatically better investing results. OpenSea data shows that users who make the whitelist and later sell their newly-minted NFT gain a profit 75.7% of the time, versus just 20.8% for users who do so without being whitelisted. Not only that, but the data suggests it’s nearly impossible to achieve outsized returns on minting purchases without being whitelisted.” Full report here.
Sure, it's not all about cash. However, any NFT collector should feel secure in their investment by owning a piece of a valuable and thriving NFT project. These stats help collectors understand that getting in early on an NFT project (via whitelist or pre-sale) will yield a better and larger return.
The downsides of pre-sales & whitelists for NFT creators.
Pre-sales and whitelist can cause issues for NFT creators and collectors.
NFT flippers
NFT collectors who only want to profit from early minting (pre-sale) or low mint cost (via whitelist). To sell the NFT in a secondary market like Opensea or Solanart, flippers go after the discounted price.
For example, a 1000 Solana NFT collection allows 100 people to mint 1 Solana NFT at 0.25 SOL. The public sale price for the remaining 900 NFTs is 1 SOL. If an NFT collector sells their discounted NFT for 0.5 SOL, the secondary market floor price is below the public mint.
This may deter potential NFT collectors. Furthermore, without a cap in the pre-sale minting phase, flippers can get as many NFTs as possible to sell for a profit, dumping them in secondary markets and driving down the floor price.
Hijacking NFT sites, communities, and pre-sales phase
People try to scam the NFT team and their community by creating oddly similar but fake websites, whitelist links, or NFT's Discord channel.
Established and new NFT projects must be vigilant to always make sure their communities know which are the official links, how a whitelist or pre-sale rules and how the team will contact (or not) community members.
Another way to avoid the scams around the pre-sale phase, NFT projects opt to create a separate mint contract for the whitelisted crypto wallets and then another for the public sale phase.
Scam NFT projects
We've seen a lot of mid-mint or post-launch rug pulls, indicating that some bad NFT projects are trying to scam NFT communities and marketplaces for quick profit. What happened to Magic Eden's launchpad recently will help you understand the scam.
We discussed the benefits and drawbacks of NFT pre-sales and whitelists for both projects and collectors.
Finally, some practical tools and tips for finding new NFTs 👇
Tools & resources to find new NFT on pre-sale or to get on a whitelist:
In order to never miss an update, important pre-sale dates, or a giveaway, create a Tweetdeck or Tweeten Twitter dashboard with hyped NFT project pages, hashtags ( #NFTGiveaways , #NFTCommunity), or big NFT influencers.
Search for upcoming NFT launches that have been vetted by the marketplace and try to get whitelisted before the public launch.
Save-timing discovery platforms like sealaunch.xyz for NFT pre-sales and upcoming launches. How can we help 100x NFT collectors get projects? A project's official social media links, description, pre-sale or public sale dates, price and supply. We're also working with Dune on NFT data analysis to help NFT collectors make better decisions.
Don't invest what you can't afford to lose because a) the project may fail or become rugged. Find NFTs projects that you want to be a part of and support.
Read original post here

xuanling11
3 years ago
Reddit NFT Achievement

Reddit's NFT market is alive and well.
NFT owners outnumber OpenSea on Reddit.
Reddit NFTs flip in OpenSea in days:
Fast-selling.
NFT sales will make Reddit's current communities more engaged.
I don't think NFTs will affect existing groups, but they will build hype for people to acquire them.
The first season of Collectibles is unique, but many missed the first season.
Second-season NFTs are less likely to be sold for a higher price than first-season ones.
If you use Reddit, it's fun to own NFTs.
You might also like

Will Lockett
3 years ago
The world will be changed by this molten salt battery.
Four times the energy density and a fraction of lithium-cost ion's
As the globe abandons fossil fuels, batteries become more important. EVs, solar, wind, tidal, wave, and even local energy grids will use them. We need a battery revolution since our present batteries are big, expensive, and detrimental to the environment. A recent publication describes a battery that solves these problems. But will it be enough?
Sodium-sulfur molten salt battery. It has existed for a long time and uses molten salt as an electrolyte (read more about molten salt batteries here). These batteries are cheaper, safer, and more environmentally friendly because they use less eco-damaging materials, are non-toxic, and are non-flammable.
Previous molten salt batteries used aluminium-sulphur chemistries, which had a low energy density and required high temperatures to keep the salt liquid. This one uses a revolutionary sodium-sulphur chemistry and a room-temperature-melting salt, making it more useful, affordable, and eco-friendly. To investigate this, researchers constructed a button-cell prototype and tested it.
First, the battery was 1,017 mAh/g. This battery is four times as energy dense as high-density lithium-ion batteries (250 mAh/g).
No one knows how much this battery would cost. A more expensive molten-salt battery costs $15 per kWh. Current lithium-ion batteries cost $132/kWh. If this new molten salt battery costs the same as present cells, it will be 90% cheaper.
This room-temperature molten salt battery could be utilized in an EV. Cold-weather heaters just need a modest backup battery.
The ultimate EV battery? If used in a Tesla Model S, you could install four times the capacity with no weight gain, offering a 1,620-mile range. This huge battery pack would cost less than Tesla's. This battery would nearly perfect EVs.
Or would it?
The battery's capacity declined by 50% after 1,000 charge cycles. This means that our hypothetical Model S would suffer this decline after 1.6 million miles, but for more cheap vehicles that use smaller packs, this would be too short. This test cell wasn't supposed to last long, so this is shocking. Future versions of this cell could be modified to live longer.
This affordable and eco-friendly cell is best employed as a grid-storage battery for renewable energy. Its safety and affordable price outweigh its short lifespan. Because this battery is made of easily accessible materials, it may be utilized to boost grid-storage capacity without causing supply chain concerns or EV battery prices to skyrocket.
Researchers are designing a bigger pouch cell (like those in phones and laptops) for this purpose. The battery revolution we need could be near. Let’s just hope it isn’t too late.

Jenn Leach
3 years ago
I created a faceless TikTok account. Six months later.
Follower count, earnings, and more

I created my 7th TikTok account six months ago. TikTok's great. I've developed accounts for Amazon products, content creators/brand deals education, website flipping, and more.
Introverted or shy people use faceless TikTok accounts.
Maybe they don't want millions of people to see their face online, or they want to remain anonymous so relatives and friends can't locate them.
Going faceless on TikTok can help you grow a following, communicate your message, and make money online.
Here are 6 steps I took to turn my Tik Tok account into a $60,000/year side gig.
From nothing to $60K in 6 months
It's clickbait, but it’s true. Here’s what I did to get here.
Quick context:
I've used social media before. I've spent years as a social creator and brand.
I've built Instagram, TikTok, and YouTube accounts to nearly 100K.
How I did it
First, select a niche.
If you can focus on one genre on TikTok, you'll have a better chance of success, however lifestyle creators do well too.
Niching down is easier, in my opinion.
Examples:
Travel
Food
Kids
Earning cash
Finance
You can narrow these niches if you like.
During the pandemic, a travel blogger focused on Texas-only tourism and gained 1 million subscribers.
Couponing might be a finance specialization.
One of my finance TikTok accounts gives credit tips and grants and has 23K followers.
Tons of ways you can get more specific.
Consider how you'll monetize your TikTok account. I saw many enormous TikTok accounts that lose money.
Why?
They can't monetize their niche. Not impossible to commercialize, but tough enough to inhibit action.
First, determine your goal.
In this first step, consider what your end goal is.
Are you trying to promote your digital products or social media management services?
You want brand deals or e-commerce sales.
This will affect your TikTok specialty.
This is the first step to a TikTok side gig.
Step 2: Pick a content style
Next, you want to decide on your content style.
Do you do voiceover and screenshots?
You'll demonstrate a product?
Will you faceless vlog?
Step 3: Look at the competition
Find anonymous accounts and analyze what content works, where they thrive, what their audience wants, etc.
This can help you make better content.
Like the skyscraper method for TikTok.
Step 4: Create a content strategy.
Your content plan is where you sit down and decide:
How many videos will you produce each day or each week?
Which links will you highlight in your biography?
What amount of time can you commit to this project?
You may schedule when to post videos on a calendar. Make videos.
5. Create videos.
No video gear needed.
Using a phone is OK, and I think it's preferable than posting drafts from a computer or phone.
TikTok prefers genuine material.
Use their app, tools, filters, and music to make videos.
And imperfection is preferable. Tik okers like to see videos made in a bedroom, not a film studio.
Make sense?
When making videos, remember this.
I personally use my phone and tablet.
Step 6: Monetize
Lastly, it’s time to monetize How will you make money? You decided this in step 1.
Time to act!
For brand agreements
Include your email in the bio.
Share several sites and use a beacons link in your bio.
Make cold calls to your favorite companies to get them to join you in a TikTok campaign.
For e-commerce
Include a link to your store's or a product's page in your bio.
For client work
Include your email in the bio.
Use a beacons link to showcase your personal website, portfolio, and other resources.
For affiliate marketing
Include affiliate product links in your bio.
Join the Amazon Influencer program and provide a link to your storefront in your bio.
$60,000 per year from Tik Tok?
Yes, and some creators make much more.
Tori Dunlap (herfirst100K) makes $100,000/month on TikTok.
My TikTok adventure took 6 months, but by month 2 I was making $1,000/month (or $12K/year).
By year's end, I want this account to earn $100K/year.
Imagine if my 7 TikTok accounts made $100K/year.
7 Tik Tok accounts X $100K/yr = $700,000/year

Tim Denning
3 years ago
Bills are paid by your 9 to 5. 6 through 12 help you build money.
40 years pass. After 14 years of retirement, you die. Am I the only one who sees the problem?

I’m the Jedi master of escaping the rat race.
Not to impress. I know this works since I've tried it. Quitting a job to make money online is worse than Kim Kardashian's internet-burning advice.
Let me help you rethink the move from a career to online income to f*ck you money.
To understand why a job is a joke, do some life math.
Without a solid why, nothing makes sense.
The retirement age is 65. Our processed food consumption could shorten our 79-year average lifespan.
You spend 40 years working.
After 14 years of retirement, you die.
Am I alone in seeing the problem?
Life is too short to work a job forever, especially since most people hate theirs. After-hours skills are vital.
Money equals unrestricted power, f*ck you.
F*ck you money is the answer.
Jack Raines said it first. He says we can do anything with the money. Jack, a young rebel straight out of college, can travel and try new foods.
F*ck you money signifies not checking your bank account before buying.
F*ck you” money is pure, unadulterated freedom with no strings attached.
Jack claims you're rich when you rarely think about money.
Avoid confusion.
This doesn't imply you can buy a Lamborghini. It indicates your costs, income, lifestyle, and bank account are balanced.
Jack established an online portfolio while working for UPS in Atlanta, Georgia. So he gained boundless power.
The portion that many erroneously believe
Yes, you need internet abilities to make money, but they're not different from 9-5 talents.
Sahil Lavingia, Gumroad's creator, explains.
A job is a way to get paid to learn.
Mistreat your boss 9-5. Drain his skills. Defuse him. Love and leave him (eventually).
Find another employment if yours is hazardous. Pick an easy job. Make sure nothing sneaks into your 6-12 time slot.
The dumb game that makes you a sheep
A 9-5 job requires many job interviews throughout life.
You email your résumé to employers and apply for jobs through advertisements. This game makes you a sheep.
You're competing globally. Work-from-home makes the competition tougher. If you're not the cheapest, employers won't hire you.
After-hours online talents (say, 6 pm-12 pm) change the game. This graphic explains it better:
Online talents boost after-hours opportunities.
You go from wanting to be picked to picking yourself. More chances equal more money. Your f*ck you fund gets the extra cash.
A novel method of learning is essential.
College costs six figures and takes a lifetime to repay.
Informal learning is distinct. 6-12pm:
Observe the carefully controlled Twitter newsfeed.
Make use of Teachable and Gumroad's online courses.
Watch instructional YouTube videos
Look through the top Substack newsletters.
Informal learning is more effective because it's not obvious. It's fun to follow your curiosity and hobbies.
The majority of people lack one attitude. It's simple to learn.
One big impediment stands in the way of f*ck you money and time independence. So often.
Too many people plan after 6-12 hours. Dreaming. Big-thinkers. Strategically. They fill their calendar with meetings.
This is after-hours masturb*tion.
Sahil Bloom reminded me that a bias towards action will determine if this approach works for you.
The key isn't knowing what to do from 6-12 a.m. Trust yourself and develop abilities as you go. It's for building the parachute after you jump.
Sounds risky. We've eliminated the risk by finishing this process after hours while you work 9-5.
With no risk, you can have an I-don't-care attitude and still be successful.
When you choose to move forward, this occurs.
Once you try 9-5/6-12, you'll tell someone.
It's bad.
Few of us hang out with problem-solvers.
It's how much of society operates. So they make reasons so they can feel better about not giving you money.
Matthew Kobach told me chasing f*ck you money is easier with like-minded folks.
Without f*ck you money friends, loneliness will take over and you'll think you've messed up when you just need to keep going.
Steal this easy guideline
Let's act. No more fluffing and caressing.
1. Learn
If you detest your 9-5 talents or don't think they'll work online, get new ones. If you're skilled enough, continue.
Easlo recommends these skills:
Designer for Figma
Designer Canva
bubble creators
editor in Photoshop
Automation consultant for Zapier
Designer of Webflow
video editor Adobe
Ghostwriter for Twitter
Idea consultant
Artist in Blender Studio
2. Develop the ability
Every night from 6-12, apply the skill.
Practicing ghostwriting? Write someone's tweets for free. Do someone's website copy to learn copywriting. Get a website to the top of Google for a keyword to understand SEO.
Free practice is crucial. Your 9-5 pays the money, so work for free.
3. Take off stealthily like a badass
Another mistake. Sell to few. Don't be the best. Don't claim expertise.
Sell your new expertise to others behind you.
Two ways:
Using a digital good
By providing a service,
Point 1 also includes digital service examples. Digital products include eBooks, communities, courses, ad-supported podcasts, and templates. It's easy. Your 9-5 job involves one of these.
Take ideas from work.
Why? They'll steal your time for profit.
4. Iterate while feeling awful
First-time launches always fail. You'll feel terrible. Okay. Remember your 9-5?
Find improvements. Ask free and paying consumers what worked.
Multiple relaunches, each 1% better.
5. Discover more
Never stop learning. Improve your skill. Add a relevant skill. Learn copywriting if you write online.
After-hours students earn the most.
6. Continue
Repetition is key.
7. Make this one small change.
Consistently. The 6-12 momentum won't make you rich in 30 days; that's success p*rn.
Consistency helps wage slaves become f*ck you money. Most people can't switch between the two.
Putting everything together
It's easy. You're probably already doing some.
This formula explains why, how, and what to do. It's a 5th-grade-friendly blueprint. Good.
Reduce financial risk with your 9-to-5. Replace Netflix with 6-12 money-making talents.
Life is short; do whatever you want. Today.