


More on NFTs & Art

Amelia Winger-Bearskin
3 years ago
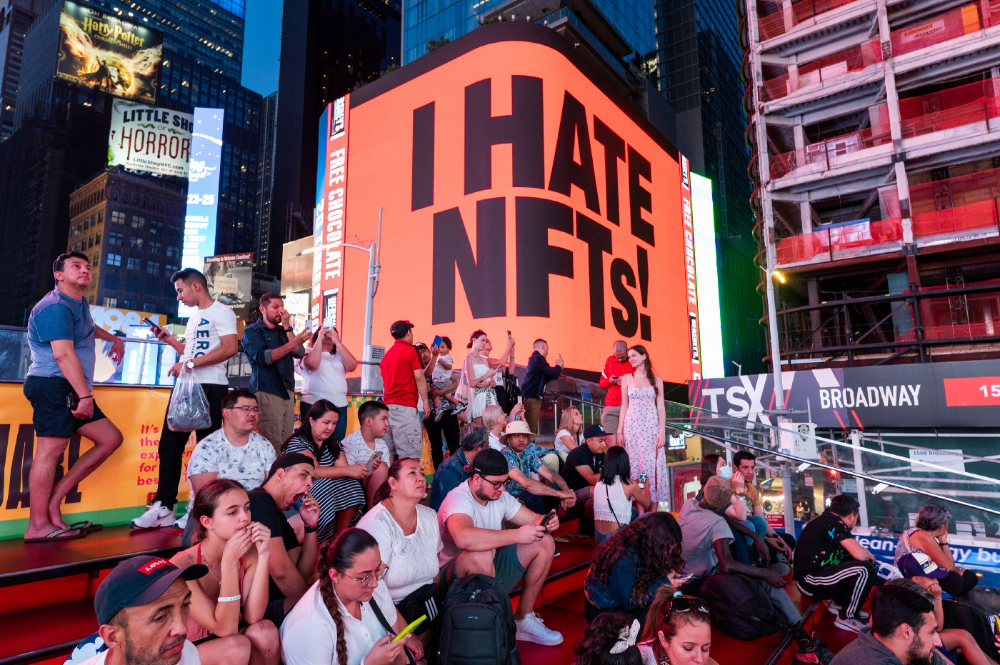
Hate NFTs? I must break some awful news to you...
If you think NFTs are awful, check out the art market.
The fervor around NFTs has subsided in recent months due to the crypto market crash and the media's short attention span. They were all anyone could talk about earlier this spring. Last semester, when passions were high and field luminaries were discussing "slurp juices," I asked my students and students from over 20 other universities what they thought of NFTs.
According to many, NFTs were either tasteless pyramid schemes or a new way for artists to make money. NFTs contributed to the climate crisis and harmed the environment, but so did air travel, fast fashion, and smartphones. Some students complained that NFTs were cheap, tasteless, algorithmically generated schlock, but others asked how this was different from other art.
I'm not sure what I expected, but the intensity of students' reactions surprised me. They had strong, emotional opinions about a technology I'd always considered administrative. NFTs address ownership and accounting, like most crypto/blockchain projects.
Art markets can be irrational, arbitrary, and subject to the same scams and schemes as any market. And maybe a few shenanigans that are unique to the art world.
The Fairness Question
Fairness, a deflating moral currency, was the general sentiment (the less of it in circulation, the more ardently we clamor for it.) These students, almost all of whom are artists, complained to the mismatch between the quality of the work in some notable NFT collections and the excessive amounts these items were fetching on the market. They can sketch a Bored Ape or Lazy Lion in their sleep. Why should they buy ramen with school loans while certain swindlers get rich?

I understand students. Art markets are unjust. They can be irrational, arbitrary, and governed by chance and circumstance, like any market. And art-world shenanigans.
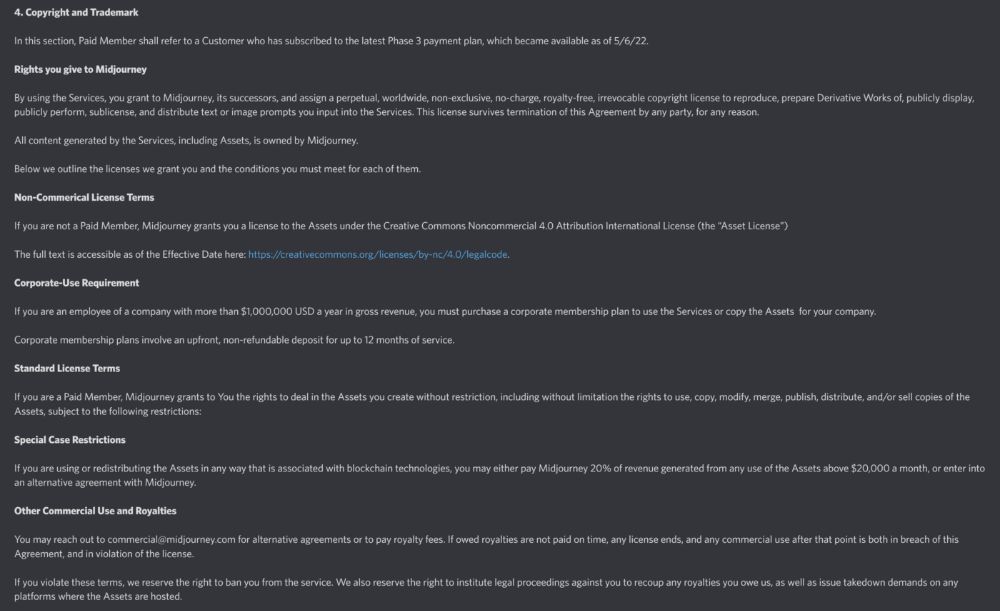
Almost every mainstream critique leveled against NFTs applies just as easily to art markets
Over 50% of artworks in circulation are fake, say experts. Sincere art collectors and institutions are upset by the prevalence of fake goods on the market. Not everyone. Wealthy people and companies use art as investments. They can use cultural institutions like museums and galleries to increase the value of inherited art collections. People sometimes buy artworks and use family ties or connections to museums or other cultural taste-makers to hype the work in their collection, driving up the price and allowing them to sell for a profit. Money launderers can disguise capital flows by using market whims, hype, and fluctuating asset prices.
Almost every mainstream critique leveled against NFTs applies just as easily to art markets.
Art has always been this way. Edward Kienholz's 1989 print series satirized art markets. He stamped 395 identical pieces of paper from $1 to $395. Each piece was initially priced as indicated. Kienholz was joking about a strange feature of art markets: once the last print in a series sells for $395, all previous works are worth at least that much. The entire series is valued at its highest auction price. I don't know what a Kienholz print sells for today (inquire with the gallery), but it's more than $395.
I love Lee Lozano's 1969 "Real Money Piece." Lozano put cash in various denominations in a jar in her apartment and gave it to visitors. She wrote, "Offer guests coffee, diet pepsi, bourbon, half-and-half, ice water, grass, and money." "Offer real money as candy."
Lee Lozano kept track of who she gave money to, how much they took, if any, and how they reacted to the offer of free money without explanation. Diverse reactions. Some found it funny, others found it strange, and others didn't care. Lozano rarely says:
Apr 17 Keith Sonnier refused, later screws lid very tightly back on. Apr 27 Kaltenbach takes all the money out of the jar when I offer it, examines all the money & puts it all back in jar. Says he doesn’t need money now. Apr 28 David Parson refused, laughing. May 1 Warren C. Ingersoll refused. He got very upset about my “attitude towards money.” May 4 Keith Sonnier refused, but said he would take money if he needed it which he might in the near future. May 7 Dick Anderson barely glances at the money when I stick it under his nose and says “Oh no thanks, I intend to earn it on my own.” May 8 Billy Bryant Copley didn’t take any but then it was sort of spoiled because I had told him about this piece on the phone & he had time to think about it he said.
Smart Contracts (smart as in fair, not smart as in Blockchain)
Cornell University's Cheryl Finley has done a lot of research on secondary art markets. I first learned about her research when I met her at the University of Florida's Harn Museum, where she spoke about smart contracts (smart as in fair, not smart as in Blockchain) and new protocols that could help artists who are often left out of the economic benefits of their own work, including women and women of color.

Her talk included findings from her ArtNet op-ed with Lauren van Haaften-Schick, Christian Reeder, and Amy Whitaker.
NFTs allow us to think about and hack on formal contractual relationships outside a system of laws that is currently not set up to service our community.
The ArtNet article The Recent Sale of Amy Sherald's ‘Welfare Queen' Symbolizes the Urgent Need for Resale Royalties and Economic Equity for Artists discussed Sherald's 2012 portrait of a regal woman in a purple dress wearing a sparkling crown and elegant set of pearls against a vibrant red background.
Amy Sherald sold "Welfare Queen" to Princeton professor Imani Perry. Sherald agreed to a payment plan to accommodate Perry's budget.
Amy Sherald rose to fame for her 2016 portrait of Michelle Obama and her full-length portrait of Breonna Taylor, one of the most famous works of the past decade.
As is common, Sherald's rising star drove up the price of her earlier works. Perry's "Welfare Queen" sold for $3.9 million in 2021.
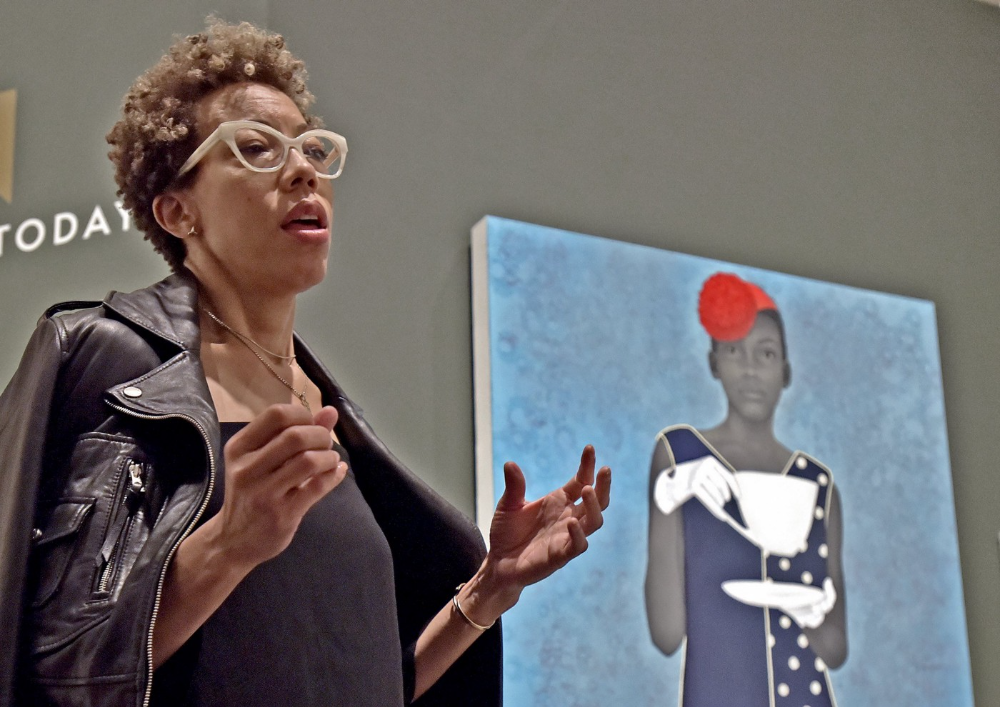
Imani Perry's early investment paid off big-time. Amy Sherald, whose work directly increased the painting's value and who was on an artist's shoestring budget when she agreed to sell "Welfare Queen" in 2012, did not see any of the 2021 auction money. Perry and the auction house got that money.
Sherald sold her Breonna Taylor portrait to the Smithsonian and Louisville's Speed Art Museum to fund a $1 million scholarship. This is a great example of what an artist can do for the community if they can amass wealth through their work.
NFTs haven't solved all of the art market's problems — fakes, money laundering, market manipulation — but they didn't create them. Blockchain and NFTs are credited with making these issues more transparent. More ideas emerge daily about what a smart contract should do for artists.
NFTs are a copyright solution. They allow us to hack formal contractual relationships outside a law system that doesn't serve our community.
Amy Sherald shows the good smart contracts can do (as in, well-considered, self-determined contracts, not necessarily blockchain contracts.) Giving back to our community, deciding where and how our work can be sold or displayed, and ensuring artists share in the equity of our work and the economy our labor creates.

CyberPunkMetalHead
3 years ago
Why Bitcoin NFTs Are Incomprehensible yet Likely Here to Stay
I'm trying to understand why Bitcoin NFTs aren't ready.
Ordinals, a new Bitcoin protocol, has been controversial. NFTs can be added to Bitcoin transactions using the protocol. They are not tokens or fungible. Bitcoin NFTs are transaction metadata. Yes. They're not owned.
In January, the Ordinals protocol allowed data like photos to be directly encoded onto sats, the smallest units of Bitcoin worth 0.00000001 BTC, on the Bitcoin blockchain. Ordinals does not need a sidechain or token like other techniques. The Ordinals protocol has encoded JPEG photos, digital art, new profile picture (PFP) projects, and even 1993 DOOM onto the Bitcoin network.
Ordinals inscriptions are permanent digital artifacts preserved on the Bitcoin blockchain. It differs from Ethereum, Solana, and Stacks NFT technologies that allow smart contract creators to change information. Ordinals store the whole image or content on the blockchain, not just a link to an external server, unlike centralized databases, which can change the linked image, description, category, or contract identifier.
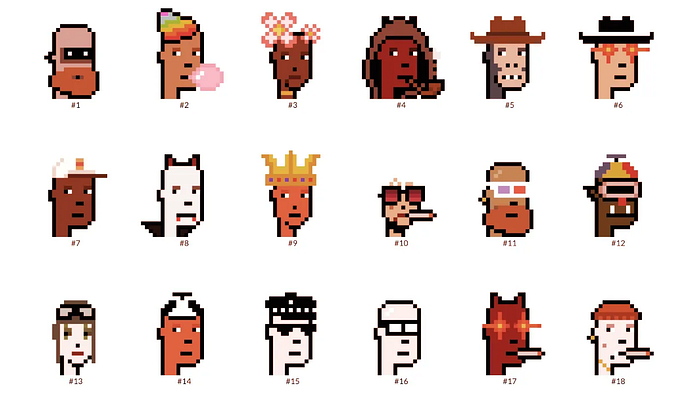
So far, more than 50,000 ordinals have been produced on the Bitcoin blockchain, and some of them have already been sold for astronomical amounts. The Ethereum-based CryptoPunks NFT collection spawned Ordinal Punk. Inscription 620 sold for 9.5 BTC, or $218,000, the most.

Segwit and Taproot, two important Bitcoin blockchain updates, enabled this. These protocols store transaction metadata, unlike Ethereum, where the NFT is the token. Bitcoin's NFT is a sat's transaction details.
What effects do ordinary values and NFTs have on the Bitcoin blockchain?
Ordinals will likely have long-term effects on the Bitcoin Ecosystem since they store, transact, and compute more data.
Charges Ordinals introduce scalability challenges. The Bitcoin network has limited transaction throughput and increased fees during peak demand. NFTs could make network transactions harder and more expensive. Ordinals currently occupy over 50% of block space, according to Glassnode.
One of the protocols that supported Ordinals Taproot has also seen a huge uptick:
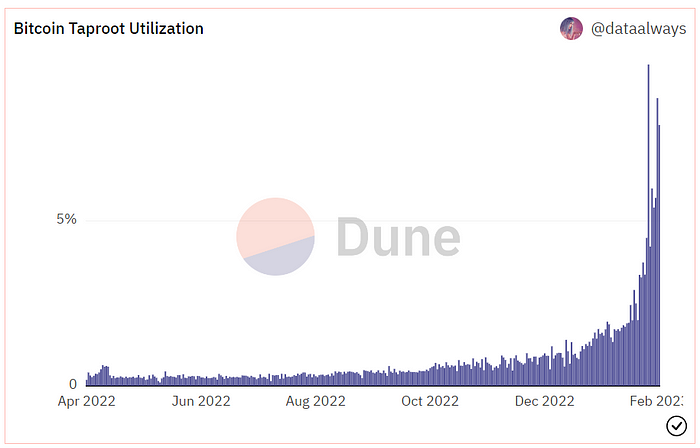
Taproot use increases block size and transaction costs.
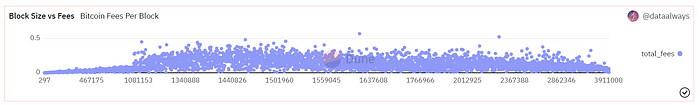
This could cause network congestion but also support more L2s with Ordinals-specific use cases. Dune info here.
Storage Needs The Bitcoin blockchain would need to store more data to store NFT data directly. Since ordinals were introduced, blocksize has tripled from 0.7mb to over 2.2mb, which could increase storage costs and make it harder for nodes to join the network.
Use Case Diversity On the other hand, NFTs on the Bitcoin blockchain could broaden Bitcoin's use cases beyond storage and payment. This could expand Bitcoin's user base. This is two-sided. Bitcoin was designed to be trustless, decentralized, peer-to-peer money.
Chain to permanently store NFTs as ordinals will change everything.
Popularity rise This new use case will boost Bitcoin appeal, according to some. This argument fails since Bitcoin is the most popular cryptocurrency. Popularity doesn't require a new use case. Cryptocurrency adoption boosts Bitcoin. It need not compete with Ethereum or provide extra benefits to crypto investors. If there was a need for another chain that supports NFTs (there isn't), why would anyone choose the slowest and most expensive network? It appears contradictory and unproductive.
Nonetheless, holding an NFT on the Bitcoin blockchain is more secure than any other blockchain, but this has little utility.
Bitcoin NFTs are undoubtedly controversial. NFTs are strange and perhaps harmful to Bitcoin's mission. If Bitcoin NFTs are here to stay, I hope a sidechain or rollup solution will take over and leave the base chain alone.

Alex Carter
3 years ago
Metaverse, Web 3, and NFTs are BS
Most crypto is probably too.

The goals of Web 3 and the metaverse are admirable and attractive. Who doesn't want an internet owned by users? Who wouldn't want a digital realm where anything is possible? A better way to collaborate and visit pals.
Companies pursue profits endlessly. Infinite growth and revenue are expected, and if a corporation needs to sacrifice profits to safeguard users, the CEO, board of directors, and any executives will lose to the system of incentives that (1) retains workers with shares and (2) makes a company answerable to all of its shareholders. Only the government can guarantee user protections, but we know how successful that is. This is nothing new, just a problem with modern capitalism and tech platforms that a user-owned internet might remedy. Moxie, the founder of Signal, has a good articulation of some of these current Web 2 tech platform problems (but I forget the timestamp); thoughts on JRE aside, this episode is worth listening to (it’s about a bunch of other stuff too).
Moxie Marlinspike, founder of Signal, on the Joe Rogan Experience podcast.
Source: https://open.spotify.com/episode/2uVHiMqqJxy8iR2YB63aeP?si=4962b5ecb1854288
Web 3 champions are premature. There was so much spectacular growth during Web 2 that the next wave of founders want to make an even bigger impact, while investors old and new want a chance to get a piece of the moonshot action. Worse, crypto enthusiasts believe — and financially need — the fact of its success to be true, whether or not it is.
I’m doubtful that it will play out like current proponents say. Crypto has been the white-hot focus of SV’s best and brightest for a long time yet still struggles to come up any mainstream use case other than ‘buy, HODL, and believe’: a store of value for your financial goals and wishes. Some kind of the metaverse is likely, but will it be decentralized, mostly in VR, or will Meta (previously FB) play a big role? Unlikely.
METAVERSE
The metaverse exists already. Our digital lives span apps, platforms, and games. I can design a 3D house, invite people, use Discord, and hang around in an artificial environment. Millions of gamers do this in Rust, Minecraft, Valheim, and Animal Crossing, among other games. Discord's voice chat and Slack-like servers/channels are the present social anchor, but the interface, integrations, and data portability will improve. Soon you can stream YouTube videos on digital house walls. You can doodle, create art, play Jackbox, and walk through a door to play Apex Legends, Fortnite, etc. Not just gaming. Digital whiteboards and screen sharing enable real-time collaboration. They’ll review code and operate enterprises. Music is played and made. In digital living rooms, they'll watch movies, sports, comedy, and Twitch. They'll tweet, laugh, learn, and shittalk.
The metaverse is the evolution of our digital life at home, the third place. The closest analog would be Discord and the integration of Facebook, Slack, YouTube, etc. into a single, 3D, customizable hangout space.
I'm not certain this experience can be hugely decentralized and smoothly choreographed, managed, and run, or that VR — a luxury, cumbersome, and questionably relevant technology — must be part of it. Eventually, VR will be pragmatic, achievable, and superior to real life in many ways. A total sensory experience like the Matrix or Sword Art Online, where we're physically hooked into the Internet yet in our imaginations we're jumping, flying, and achieving athletic feats we never could in reality; exploring realms far grander than our own (as grand as it is). That VR is different from today's.
Ben Thompson released an episode of Exponent after Facebook changed its name to Meta. Ben was suspicious about many metaverse champion claims, but he made a good analogy between Oculus and the PC. The PC was initially far too pricey for the ordinary family to afford. It began as a business tool. It got so powerful and pervasive that it affected our personal life. Price continues to plummet and so much consumer software was produced that it's impossible to envision life without a home computer (or in our pockets). If Facebook shows product market fit with VR in business, through use cases like remote work and collaboration, maybe VR will become practical in our personal lives at home.
Before PCs, we relied on Blockbuster, the Yellow Pages, cabs to get to the airport, handwritten taxes, landline phones to schedule social events, and other archaic methods. It is impossible for me to conceive what VR, in the form of headsets and hand controllers, stands to give both professional and especially personal digital experiences that is an order of magnitude better than what we have today. Is looking around better than using a mouse to examine a 3D landscape? Do the hand controls make x10 or x100 work or gaming more fun or efficient? Will VR replace scalable Web 2 methods and applications like Web 1 and Web 2 did for analog? I don't know.
My guess is that the metaverse will arrive slowly, initially on displays we presently use, with more app interoperability. I doubt that it will be controlled by the people or by Facebook, a corporation that struggles to properly innovate internally, as practically every large digital company does. Large tech organizations are lousy at hiring product-savvy employees, and if they do, they rarely let them explore new things.
These companies act like business schools when they seek founders' results, with bureaucracy and dependency. Which company launched the last popular consumer software product that wasn't a clone or acquisition? Recent examples are scarce.
Web 3
Investors and entrepreneurs of Web 3 firms are declaring victory: 'Web 3 is here!' Web 3 is the future! Many profitable Web 2 enterprises existed when Web 2 was defined. The word was created to explain user behavior shifts, not a personal pipe dream.
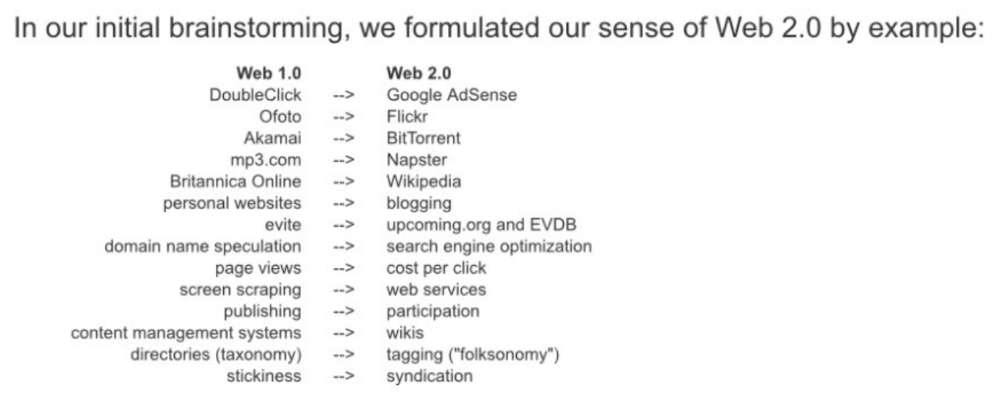
Origins of Web 2: http://www.oreilly.com/pub/a/web2/archive/what-is-web-20.html
One of these Web 3 startups may provide the connecting tissue to link all these experiences or become one of the major new digital locations. Even so, successful players will likely use centralized power arrangements, as Web 2 businesses do now. Some Web 2 startups integrated our digital lives. Rockmelt (2010–2013) was a customizable browser with bespoke connectors to every program a user wanted; imagine seeing Facebook, Twitter, Discord, Netflix, YouTube, etc. all in one location. Failure. Who knows what Opera's doing?
Silicon Valley and tech Twitter in general have a history of jumping on dumb bandwagons that go nowhere. Dot-com crash in 2000? The huge deployment of capital into bad ideas and businesses is well-documented. And live video. It was the future until it became a niche sector for gamers. Live audio will play out a similar reality as CEOs with little comprehension of audio and no awareness of lasting new user behavior deceive each other into making more and bigger investments on fool's gold. Twitter trying to buy Clubhouse for $4B, Spotify buying Greenroom, Facebook exploring live audio and 'Tiktok for audio,' and now Amazon developing a live audio platform. This live audio frenzy won't be worth their time or energy. Blind guides blind. Instead of learning from prior failures like Twitter buying Periscope for $100M pre-launch and pre-product market fit, they're betting on unproven and uncompelling experiences.
NFTs
NFTs are also nonsense. Take Loot, a time-limited bag drop of "things" (text on the blockchain) for a game that didn't exist, bought by rich techies too busy to play video games and foolish enough to think they're getting in early on something with a big reward. What gaming studio is incentivized to use these items? Who's encouraged to join? No one cares besides Loot owners who don't have NFTs. Skill, merit, and effort should be rewarded with rare things for gamers. Even if a small minority of gamers can make a living playing, the average game's major appeal has never been to make actual money - that's a profession.
No game stays popular forever, so how is this objective sustainable? Once popularity and usage drop, exclusive crypto or NFTs will fall. And if NFTs are designed to have cross-game appeal, incentives apart, 30 years from now any new game will need millions of pre-existing objects to build around before they start. It doesn’t work.
Many games already feature item economies based on real in-game scarcity, generally for cosmetic things to avoid pay-to-win, which undermines scaled gaming incentives for huge player bases. Counter-Strike, Rust, etc. may be bought and sold on Steam with real money. Since the 1990s, unofficial cross-game marketplaces have sold in-game objects and currencies. NFTs aren't needed. Making a popular, enjoyable, durable game is already difficult.
With NFTs, certain JPEGs on the internet went from useless to selling for $69 million. Why? Crypto, Web 3, early Internet collectibles. NFTs are digital Beanie Babies (unlike NFTs, Beanie Babies were a popular children's toy; their destinies are the same). NFTs are worthless and scarce. They appeal to crypto enthusiasts seeking for a practical use case to support their theory and boost their own fortune. They also attract to SV insiders desperate not to miss the next big thing, not knowing what it will be. NFTs aren't about paying artists and creators who don't get credit for their work.
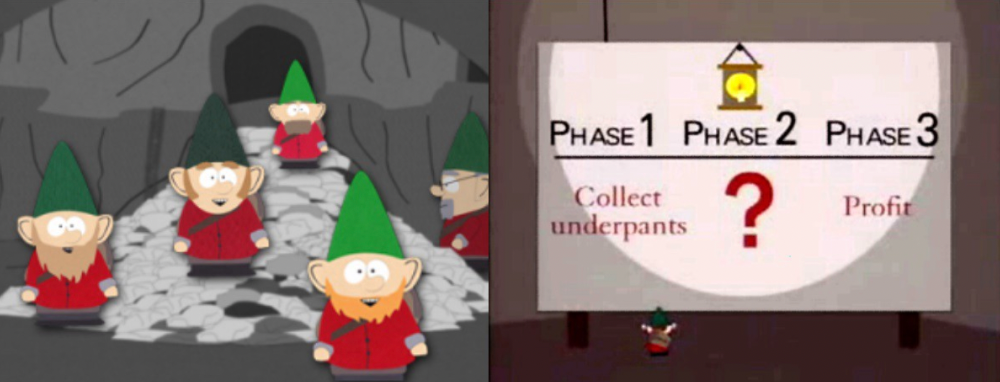
South Park's Underpants Gnomes
NFTs are a benign, foolish plan to earn money on par with South Park's underpants gnomes. At worst, they're the world of hucksterism and poor performers. Or those with money and enormous followings who, like everyone, don't completely grasp cryptocurrencies but are motivated by greed and status and believe Gary Vee's claim that CryptoPunks are the next Facebook. Gary's watertight logic: if NFT prices dip, they're on the same path as the most successful corporation in human history; buy the dip! NFTs aren't businesses or museum-worthy art. They're bs.

Gary Vee compares NFTs to Amazon.com. vm.tiktok.com/TTPdA9TyH2
We grew up collecting: Magic: The Gathering (MTG) cards printed in the 90s are now worth over $30,000. Imagine buying a digital Magic card with no underlying foundation. No one plays the game because it doesn't exist. An NFT is a contextless image someone conned you into buying a certificate for, but anyone may copy, paste, and use. Replace MTG with Pokemon for younger readers.
When Gary Vee strongarms 30 tech billionaires and YouTube influencers into buying CryptoPunks, they'll talk about it on Twitch, YouTube, podcasts, Twitter, etc. That will convince average folks that the product has value. These guys are smart and/or rich, so I'll get in early like them. Cryptography is similar. No solid, scaled, mainstream use case exists, and no one knows where it's headed, but since the global crypto financial bubble hasn't burst and many people have made insane fortunes, regular people are putting real money into something that is highly speculative and could be nothing because they want a piece of the action. Who doesn’t want free money? Rich techies and influencers won't be affected; normal folks will.
Imagine removing every $1 invested in Bitcoin instantly. What would happen? How far would Bitcoin fall? Over 90%, maybe even 95%, and Bitcoin would be dead. Bitcoin as an investment is the only scalable widespread use case: it's confidence that a better use case will arise and that being early pays handsomely. It's like pouring a trillion dollars into a company with no business strategy or users and a CEO who makes vague future references.
New tech and efforts may provoke a 'get off my lawn' mentality as you approach 40, but I've always prided myself on having a decent bullshit detector, and it's flying off the handle at this foolishness. If we can accomplish a functional, responsible, equitable, and ethical user-owned internet, I'm for it.
Postscript:
I wanted to summarize my opinions because I've been angry about this for a while but just sporadically tweeted about it. A friend handed me a Dan Olson YouTube video just before publication. He's more knowledgeable, articulate, and convincing about crypto. It's worth seeing:
This post is a summary. See the original one here.
You might also like

Entreprogrammer
3 years ago
The Steve Jobs Formula: A Guide to Everything
A must-read for everyone
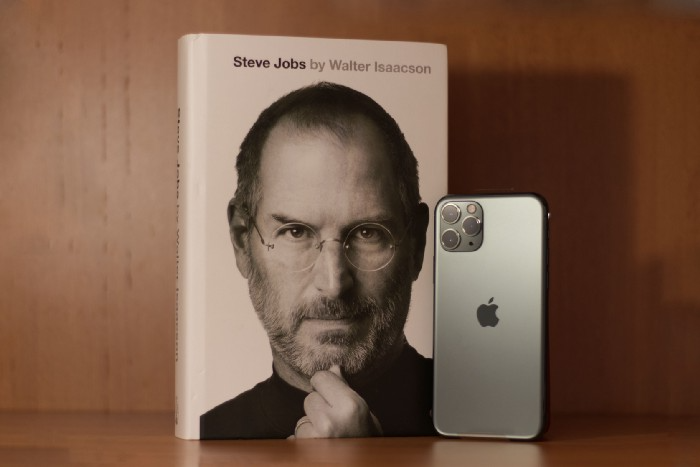
Jobs is well-known. You probably know the tall, thin guy who wore the same clothing every day. His influence is unavoidable. In fewer than 40 years, Jobs' innovations have impacted computers, movies, cellphones, music, and communication.
Steve Jobs may be more imaginative than the typical person, but if we can use some of his ingenuity, ambition, and good traits, we'll be successful. This essay explains how to follow his guidance and success secrets.
1. Repetition is necessary for success.
Be patient and diligent to master something. Practice makes perfect. This is why older workers are often more skilled.
When should you repeat a task? When you're confident and excited to share your product. It's when to stop tweaking and repeating.
Jobs stated he'd make the crowd sh** their pants with an iChat demo.
Use this in your daily life.
Start with the end in mind. You can put it in writing and be as detailed as you like with your plan's schedule and metrics. For instance, you have a goal of selling three coffee makers in a week.
Break it down, break the goal down into particular tasks you must complete, and then repeat those tasks. To sell your coffee maker, you might need to make 50 phone calls.
Be mindful of the amount of work necessary to produce the desired results. Continue doing this until you are happy with your product.
2. Acquire the ability to add and subtract.
How did Picasso invent cubism? Pablo Picasso was influenced by stylised, non-naturalistic African masks that depict a human figure.
Artists create. Constantly seeking inspiration. They think creatively about random objects. Jobs said creativity is linking things. Creative people feel terrible when asked how they achieved something unique because they didn't do it all. They saw innovation. They had mastered connecting and synthesizing experiences.
Use this in your daily life.
On your phone, there is a note-taking app. Ideas for what you desire to learn should be written down. It may be learning a new language, calligraphy, or anything else that inspires or intrigues you.
Note any ideas you have, quotations, or any information that strikes you as important.
Spend time with smart individuals, that is the most important thing. Jim Rohn, a well-known motivational speaker, has observed that we are the average of the five people with whom we spend the most time.
Learning alone won't get you very far. You need to put what you've learnt into practice. If you don't use your knowledge and skills, they are useless.
3. Develop the ability to refuse.
Steve Jobs deleted thousands of items when he created Apple's design ethic. Saying no to distractions meant upsetting customers and partners.
John Sculley, the former CEO of Apple, said something like this. According to Sculley, Steve’s methodology differs from others as he always believed that the most critical decisions are things you choose not to do.
Use this in your daily life.
Never be afraid to say "no," "I won't," or "I don't want to." Keep it simple. This method works well in some situations.
Give a different option. For instance, X might be interested even if I won't be able to achieve it.
Control your top priority. Before saying yes to anything, make sure your work schedule and priority list are up to date.
4. Follow your passion
“Follow your passion” is the worst advice people can give you. Steve Jobs didn't start Apple because he suddenly loved computers. He wanted to help others attain their maximum potential.
Great things take a lot of work, so quitting makes sense if you're not passionate. Jobs learned from history that successful people were passionate about their work and persisted through challenges.
Use this in your daily life.
Stay away from your passion. Allow it to develop daily. Keep working at your 9-5-hour job while carefully gauging your level of desire and endurance. Less risk exists.
The truth is that if you decide to work on a project by yourself rather than in a group, it will take you years to complete it instead of a week. Instead, network with others who have interests in common.
Prepare a fallback strategy in case things go wrong.
Success, this small two-syllable word eventually gives your life meaning, a perspective. What is success? For most, it's achieving their ambitions. However, there's a catch. Successful people aren't always happy.
Furthermore, where do people’s goals and achievements end? It’s a never-ending process. Success is a journey, not a destination. We wish you not to lose your way on this journey.

Tim Smedley
3 years ago
When Investment in New Energy Surpassed That in Fossil Fuels (Forever)
A worldwide energy crisis might have hampered renewable energy and clean tech investment. Nope.
BNEF's 2023 Energy Transition Investment Trends study surprised and encouraged. Global energy transition investment reached $1 trillion for the first time ($1.11t), up 31% from 2021. From 2013, the clean energy transition has come and cannot be reversed.
BNEF Head of Global Analysis Albert Cheung said our findings ended the energy crisis's influence on renewable energy deployment. Energy transition investment has reached a record as countries and corporations implement transition strategies. Clean energy investments will soon surpass fossil fuel investments.
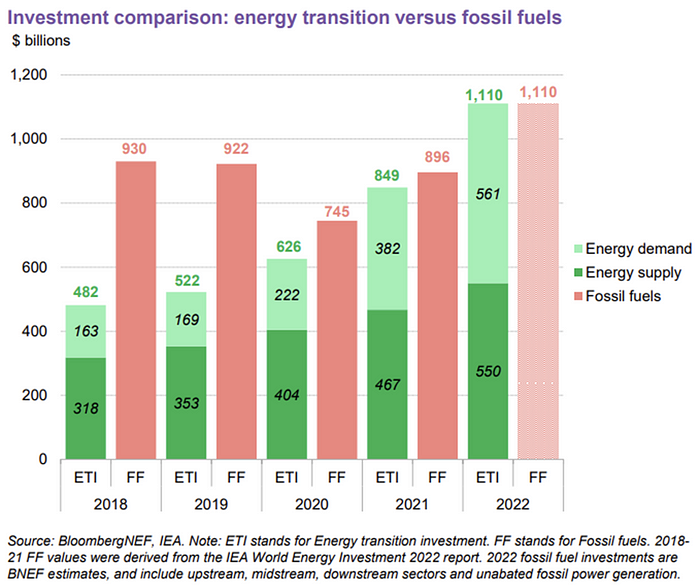
The table below indicates the tripping point, which means the energy shift is occuring today.
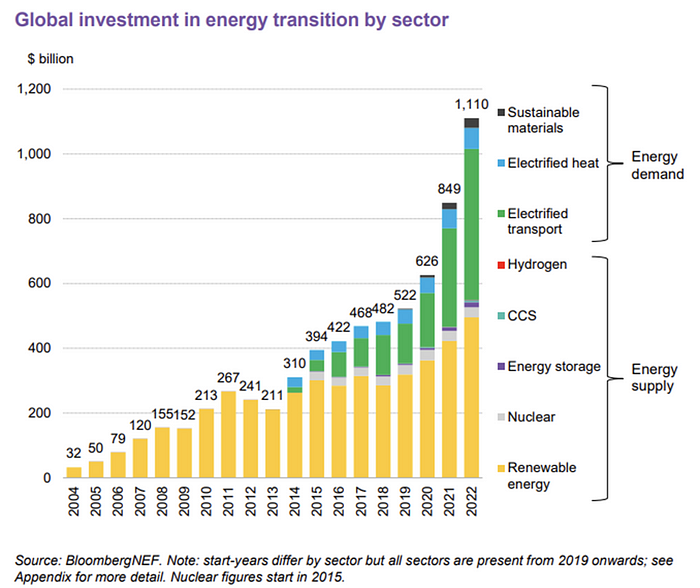
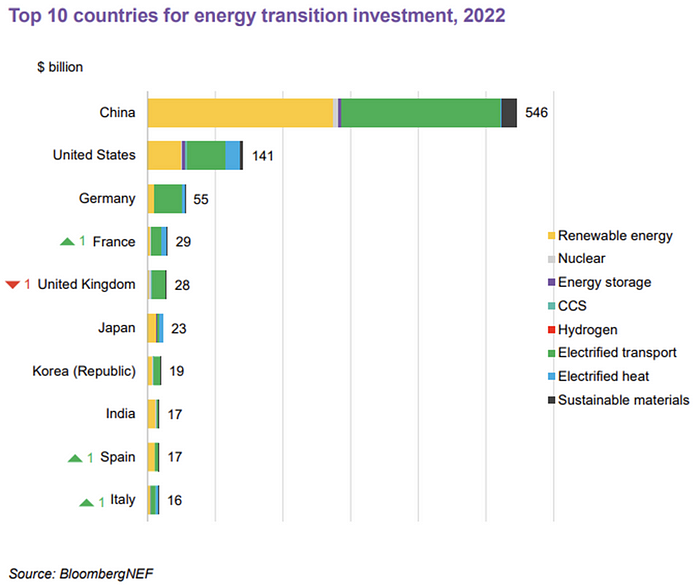
BNEF calls money invested on clean technology including electric vehicles, heat pumps, hydrogen, and carbon capture energy transition investment. In 2022, electrified heat received $64b and energy storage $15.7b.
Nonetheless, $495b in renewables (up 17%) and $466b in electrified transport (up 54%) account for most of the investment. Hydrogen and carbon capture are tiny despite the fanfare. Hydrogen received the least funding in 2022 at $1.1 billion (0.1%).
China dominates investment. China spends $546 billion on energy transition, half the global amount. Second, the US total of $141 billion in 2022 was up 11% from 2021. With $180 billion, the EU is unofficially second. China invested 91% in battery technologies.
The 2022 transition tipping point is encouraging, but the BNEF research shows how far we must go to get Net Zero. Energy transition investment must average $4.55 trillion between 2023 and 2030—three times the amount spent in 2022—to reach global Net Zero. Investment must be seven times today's record to reach Net Zero by 2050.
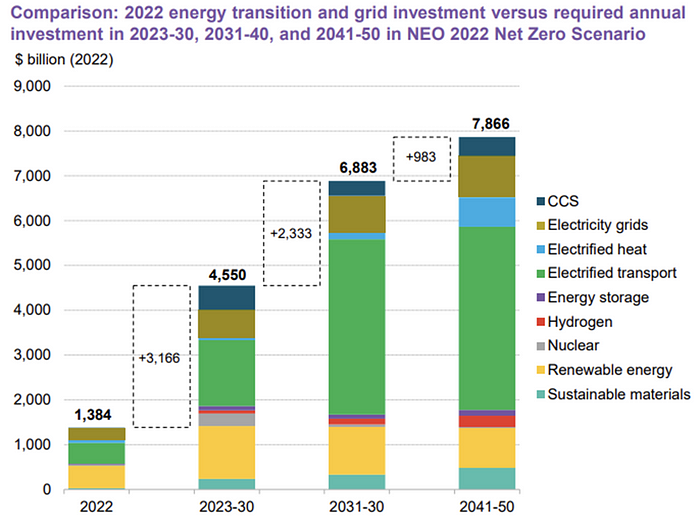
BNEF 2023 Energy Transition Investment Trends.
As shown in the graph above, BNEF experts have been using their crystal balls to determine where that investment should go. CCS and hydrogen are still modest components of the picture. Interestingly, they see nuclear almost fading. Active transport advocates like me may have something to say about the massive $4b in electrified transport. If we focus on walkable 15-minute cities, we may need fewer electric automobiles. Though we need more electric trains and buses.
Albert Cheung of BNEF emphasizes the challenge. This week's figures promise short-term job creation and medium-term energy security, but more investment is needed to reach net zero in the long run.
I expect the BNEF Energy Transition Investment Trends report to show clean tech investment outpacing fossil fuels investment every year. Finally saying that is amazing. It's insufficient. The planet must maintain its electric (not gas) pedal. In response to the research, Christina Karapataki, VC at Breakthrough Energy Ventures, a clean tech investment firm, tweeted: Clean energy investment needs to average more than 3x this level, for the remainder of this decade, to get on track for BNEFs Net Zero Scenario. Go!

Leah
3 years ago
The Burnout Recovery Secrets Nobody Is Talking About

What works and what’s just more toxic positivity
Just keep at it; you’ll get it.
I closed the Zoom call and immediately dropped my head. Open tabs included material on inspiration, burnout, and recovery.
I searched everywhere for ways to avoid burnout.
It wasn't that I needed to keep going, change my routine, employ 8D audio playlists, or come up with fresh ideas. I had several ideas and a schedule. I knew what to do.
I wasn't interested. I kept reading, changing my self-care and mental health routines, and writing even though it was tiring.
Since burnout became a psychiatric illness in 2019, thousands have shared their experiences. It's spreading rapidly among writers.
What is the actual key to recovering from burnout?
Every A-list burnout story emphasizes prevention. Other lists provide repackaged self-care tips. More discuss mental health.
It's like the mid-2000s, when pink quotes about bubble baths saturated social media.
The self-care mania cost us all. Self-care is crucial, but utilizing it to address everything didn't work then or now.
How can you recover from burnout?
Time
Are extended breaks actually good for you? Most people need a break every 62 days or so to avoid burnout.
Real-life burnout victims all took breaks. Perhaps not a long hiatus, but breaks nonetheless.
Burnout is slow and gradual. It takes little bits of your motivation and passion at a time. Sometimes it’s so slow that you barely notice or blame it on other things like stress and poor sleep.
Burnout doesn't come overnight; neither will recovery.
I don’t care what anyone else says the cure for burnout is. It has to be time because time is what gave us all burnout in the first place.