


More on Marketing

Emma Jade
3 years ago
6 hacks to create content faster
Content gurus' top time-saving hacks.
I'm a content strategist, writer, and graphic designer. Time is more valuable than money.
Money is always available. Even if you're poor. Ways exist.
Time is passing, and one day we'll run out.
Sorry to be morbid.
In today's digital age, you need to optimize how you create content for your organization. Here are six content creation hacks.
1. Use templates
Use templates to streamline your work whether generating video, images, or documents.
Setup can take hours. Using a free resource like Canva, you can create templates for any type of material.
This will save you hours each month.
2. Make a content calendar
You post without a plan? A content calendar solves 50% of these problems.
You can prepare, organize, and plan your material ahead of time so you're not scrambling when you remember, "Shit, it's Mother's Day!"
3. Content Batching
Batching content means creating a lot in one session. This is helpful for video content that requires a lot of setup time.
Batching monthly content saves hours. Time is a valuable resource.
When working on one type of task, it's easy to get into a flow state. This saves time.
4. Write Caption
On social media, we generally choose the image first and then the caption. Writing captions first sometimes work better, though.
Writing the captions first can allow you more creative flexibility and be easier if you're not excellent with language.
Say you want to tell your followers something interesting.
Writing a caption first is easier than choosing an image and then writing a caption to match.
Not everything works. You may have already-created content that needs captioning. When you don't know what to share, think of a concept, write the description, and then produce a video or graphic.
Cats can be skinned in several ways..
5. Repurpose
Reuse content when possible. You don't always require new stuff. In fact, you’re pretty stupid if you do #SorryNotSorry.
Repurpose old content. All those blog entries, videos, and unfinished content on your desk or hard drive.
This blog post can be turned into a social media infographic. Canva's motion graphic function can animate it. I can record a YouTube video regarding this issue for a podcast. I can make a post on each point in this blog post and turn it into an eBook or paid course.
And it doesn’t stop there.
My point is, to think outside the box and really dig deep into ways you can leverage the content you’ve already created.
6. Schedule Them
If you're still manually posting content, get help. When you batch your content, schedule it ahead of time.
Some scheduling apps are free or cheap. No excuses.
Don't publish and ghost.
Scheduling saves time by preventing you from doing it manually. But if you never engage with your audience, the algorithm won't reward your material.
Be online and engage your audience.
Content Machine
Use these six content creation hacks. They help you succeed and save time.

Camilla Dudley
3 years ago
How to gain Twitter followers: A 101 Guide

No wonder brands use Twitter to reach their audience. 53% of Twitter users buy new products first.
Twitter growth does more than make your brand look popular. It helps clients trust your business. It boosts your industry standing. It shows clients, prospects, and even competitors you mean business.
How can you naturally gain Twitter followers?
Share useful information
Post visual content
Tweet consistently
Socialize
Spread your @name everywhere.
Use existing customers
Promote followers
Share useful information
Twitter users join conversations and consume material. To build your followers, make sure your material appeals to them and gives value, whether it's sales, product lessons, or current events.
Use Twitter Analytics to learn what your audience likes.
Explore popular topics by utilizing relevant keywords and hashtags. Check out this post on how to use Twitter trends.
Post visual content
97% of Twitter users focus on images, so incorporating media can help your Tweets stand out. Visuals and videos make content more engaging and memorable.
Tweet often
Your audience should expect regular content updates. Plan your ideas and tweet during crucial seasons and events with a content calendar.
Socialize
Twitter connects people. Do more than tweet. Follow industry leaders. Retweet influencers, engage with thought leaders, and reply to mentions and customers to boost engagement.
Micro-influencers can promote your brand or items. They can help you gain new audiences' trust.
Spread your @name everywhere.
Maximize brand exposure. Add a follow button on your website, link to it in your email signature and newsletters, and promote it on business cards or menus.
Use existing customers
Emails can be used to find existing Twitter clients. Upload your email contacts and follow your customers on Twitter to start a dialogue.
Promote followers
Run a followers campaign to boost your organic growth. Followers campaigns promote your account to a particular demographic, and you only pay when someone follows you.
Consider short campaigns to enhance momentum or an always-on campaign to gain new followers.
Increasing your brand's Twitter followers takes effort and experimentation, but the payback is huge.
👋 Follow me on twitter

obimy.app
3 years ago
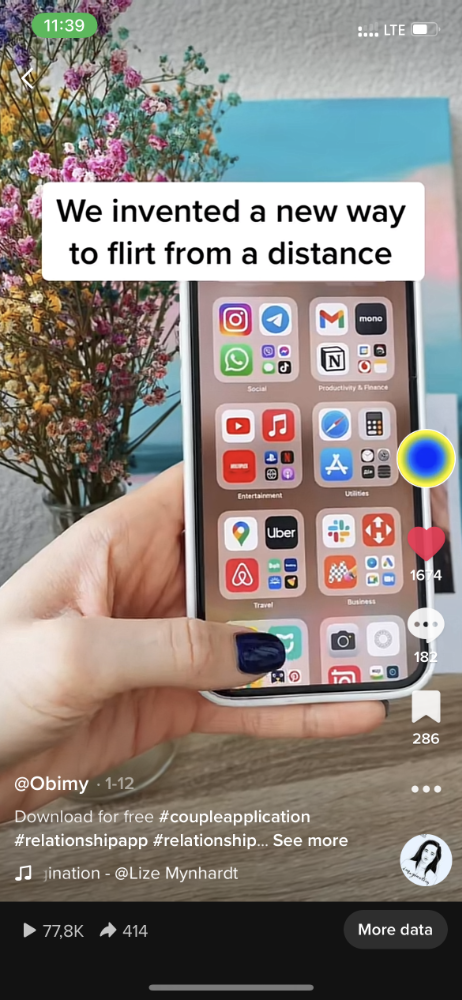
How TikTok helped us grow to 6 million users
This resulted to obimy's new audience.
Hi! obimy's official account. Here, we'll teach app developers and marketers. In 2022, our downloads increased dramatically, so we'll share what we learned.
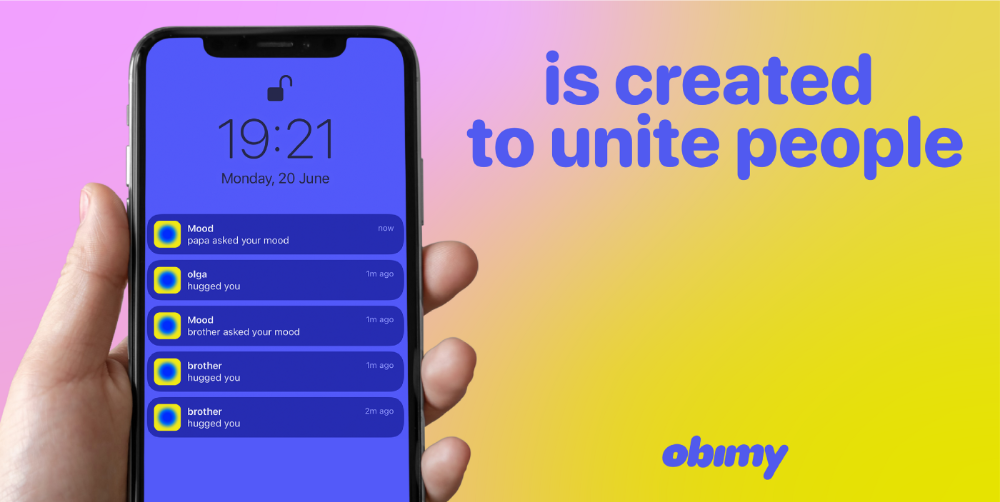
obimy is what we call a ‘senseger’. It's a new method to communicate digitally. Instead of text, obimy users connect through senses and moods. Feeling playful? Flirt with your partner, pat a pal, or dump water on a classmate. Each feeling is an interactive animation with vibration. It's a wordless app. App Store and Google Play have obimy.
We had 20,000 users in 2022. Two to five thousand of them opened the app monthly. Our DAU metric was 500.
We have 6 million users after 6 months. 500,000 individuals use obimy daily. obimy was the top lifestyle app this week in the U.S.
And TikTok helped.
TikTok fuels obimys' growth. It's why our app exploded. How and what did we learn? Our Head of Marketing, Anastasia Avramenko, knows.
our actions prior to TikTok
We wanted to achieve product-market fit through organic expansion. Quora, Reddit, Facebook Groups, Facebook Ads, Google Ads, Apple Search Ads, and social media activity were tested. Nothing worked. Our CPI was sometimes $4, so unit economics didn't work.
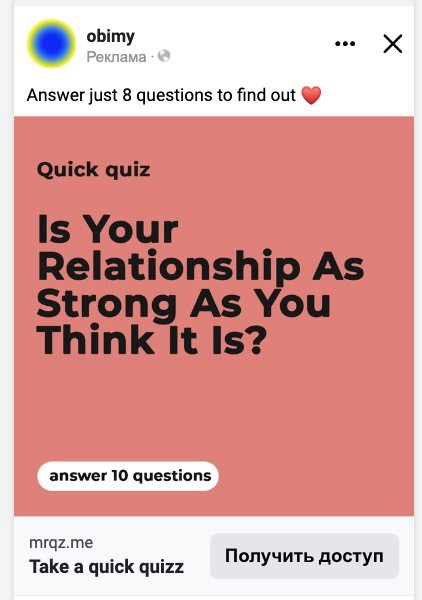
We studied our markets and made audience hypotheses. We promoted our goods and studied our audience through social media quizzes. Our target demographic was Americans in long-distance relationships. I designed quizzes like Test the Strength of Your Relationship to better understand the user base. After each quiz, we encouraged users to download the app to enhance their connection and bridge the distance.
We got 1,000 responses for $50. This helped us comprehend the audience's grief and coping strategies (aka our rivals). I based action items on answers given. If you can't embrace a loved one, use obimy.
We also tried Facebook and Google ads. From the start, we knew it wouldn't work.
We were desperate to discover a free way to get more users.
Our journey to TikTok
TikTok is a great venue for emerging creators. It also helped reach people. Before obimy, my TikTok videos garnered 12 million views without sponsored promotion.
We had to act. TikTok was required.
I wasn't a TikTok user before obimy. Initially, I uploaded promotional content. Call-to-actions appear strange next to dancing challenges and my money don't jiggle jiggle. I learned TikTok. Watch TikTok for an hour was on my to-do list. What a dream job!
Our most popular movies presented the app alongside text outlining what it does. We started promoting them in Europe and the U.S. and got a 16% CTR and $1 CPI, an improvement over our previous efforts.
Somehow, we were expanding. So we came up with new hypotheses, calls to action, and content.
Four months passed, yet we saw no organic growth.
Russia attacked Ukraine.
Our app aimed to be helpful. For now, we're focusing on our Ukrainian audience. I posted sloppy TikToks illustrating how obimy can help during shelling or air raids.
In two hours, Kostia sent me our visitor count. Our servers crashed.
Initially, we had several thousand daily users. Over 200,000 users joined obimy in a week. They posted obimy videos on TikTok, drawing additional users. We've also resumed U.S. video promotion.
We gained 2,000,000 new members with less than $100 in ads, primarily in the U.S. and U.K.
TikTok helped.
The figures
We were confident we'd chosen the ideal tool for organic growth.
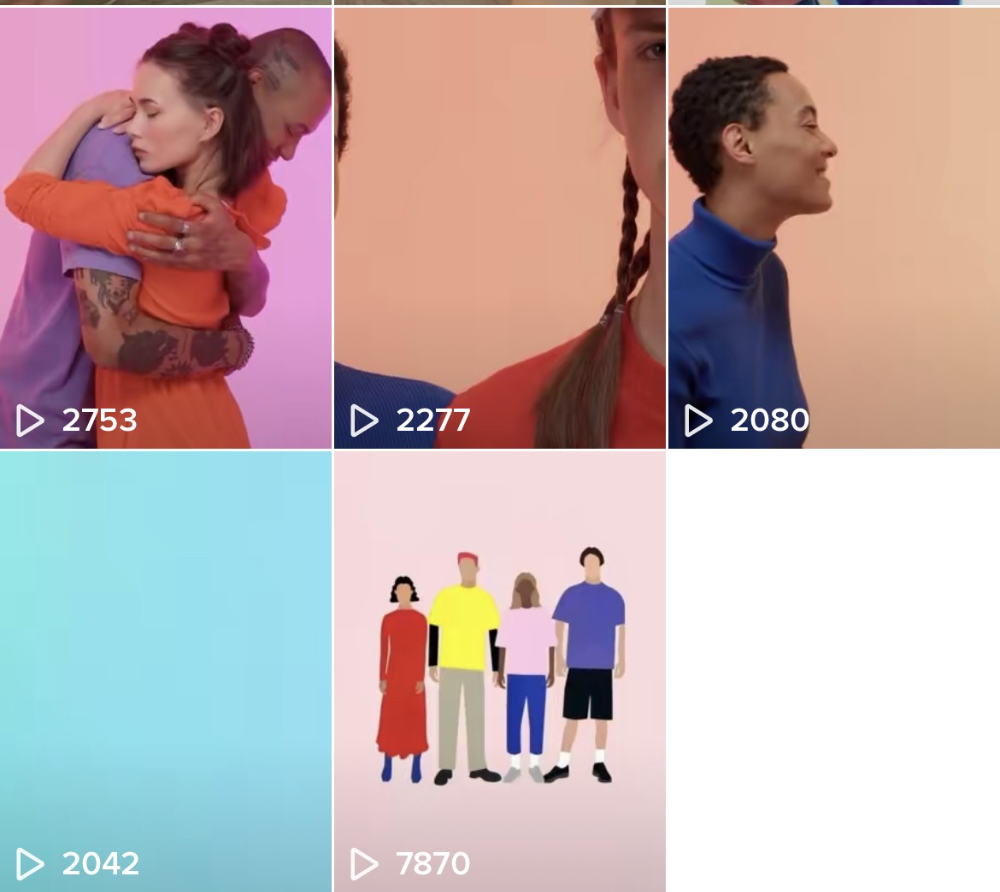
Over 45 million people have viewed our own videos plus a ton of user-generated content with the hashtag #obimy.
About 375 thousand people have liked all of our individual videos.
The number of downloads and the virality of videos are directly correlated.
Where are we now?
TikTok fuels our organic growth. We post 56 videos every week and pay to promote viral content.
We use UGC and influencers. We worked with Universal Music Italy on Eurovision. They offered to promote us through their million-follower TikTok influencers. We thought their followers would improve our audience, but it didn't matter. Integration didn't help us. Users that share obimy videos with their followers can reach several million views, which affects our download rate.
After the dust settled, we determined our key audience was 13-18-year-olds. They want to express themselves, but it's sometimes difficult. We're searching for methods to better engage with our users. We opened a Discord server to discuss anime and video games and gather app and content feedback.
TikTok helps us test product updates and hypotheses. Example: I once thought we might raise MAU by prompting users to add strangers as friends. Instead of asking our team to construct it, I made a TikTok urging users to share invite URLs. Users share links under every video we upload, embracing people worldwide.
Key lessons
Don't direct-sell. TikTok isn't for Instagram, Facebook, or YouTube promo videos. Conventional advertisements don't fit. Most users will swipe up and watch humorous doggos.
More product videos are better. Finally. So what?
Encourage interaction. Tagging friends in comments or making videos with the app promotes it more than any marketing spend.
Be odd and risqué. A user mistakenly sent a French kiss to their mom in one of our most popular videos.
TikTok helps test hypotheses and build your user base. It also helps develop apps. In our upcoming blog, we'll guide you through obimy's design revisions based on TikTok. Follow us on Twitter, Instagram, and TikTok.
You might also like

Alex Mathers
2 years ago
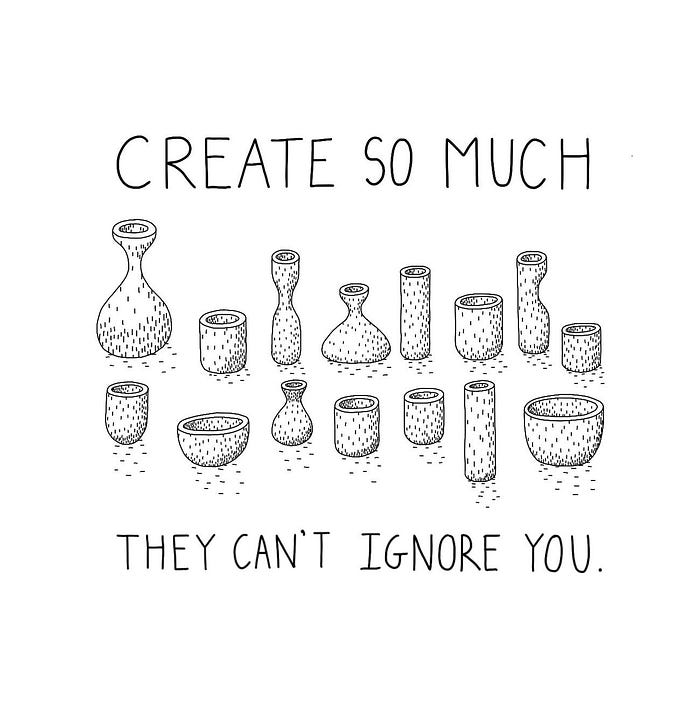
How to Produce Enough for People to Not Neglect You
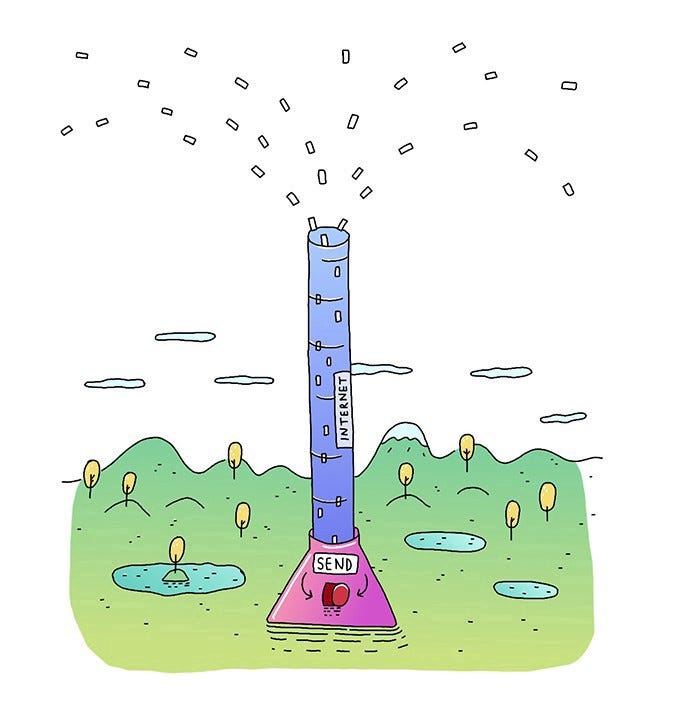
Internet's fantastic, right?
We've never had a better way to share our creativity.
I can now draw on my iPad and tweet or Instagram it to thousands. I may get some likes.
With such a great, free tool, you're not alone.
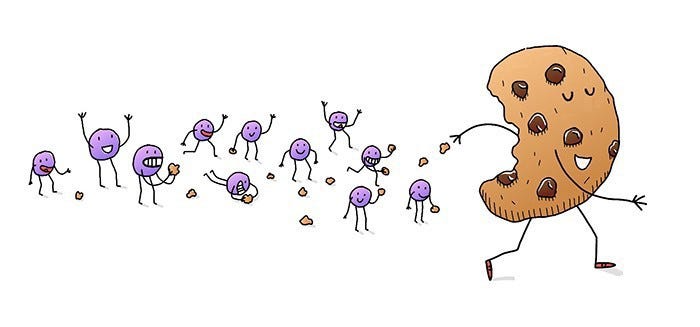
Millions more bright-eyed artists are sharing their work online.
The issue is getting innovative work noticed, not sharing it.
In a world where creators want attention, attention is valuable.
We build for attention.
Attention helps us establish a following, make money, get notoriety, and make a difference.
Most of us require attention to stay sane while creating wonderful things.
I know how hard it is to work hard and receive little views.
How do we receive more attention, more often, in a sea of talent?
Advertising and celebrity endorsements are options. These may work temporarily.
To attract true, organic, and long-term attention, you must create in high quality, high volume, and consistency.
Adapting Steve Martin's Be so amazing, they can't ignore you (with a mention to Dan Norris in his great book Create or Hate for the reminder)
Create a lot.
Eventually, your effort will gain traction.
Traction shows your work's influence.
Traction is when your product sells more. Traction is exponential user growth. Your work is shared more.
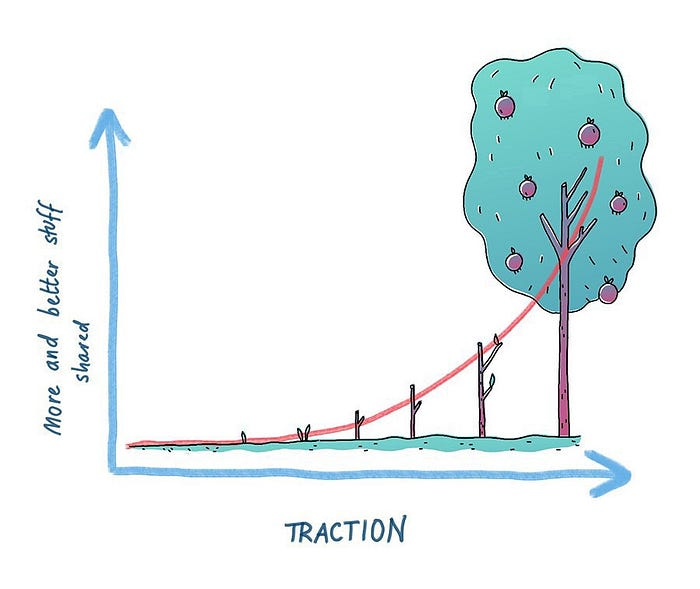
No matter how good your work is, it will always have minimal impact on the world.
Your work can eventually dent or puncture. Daily, people work to dent.
To achieve this tipping point, you must consistently produce exceptional work.
Expect traction after hundreds of outputs.
Dilbert creator Scott Adams says repetition persuades. If you don't stop, you can persuade practically anyone with anything.
Volume lends believability. So make more.
I worked as an illustrator for at least a year and a half without any recognition. After 150 illustrations on iStockphoto, my work started selling.
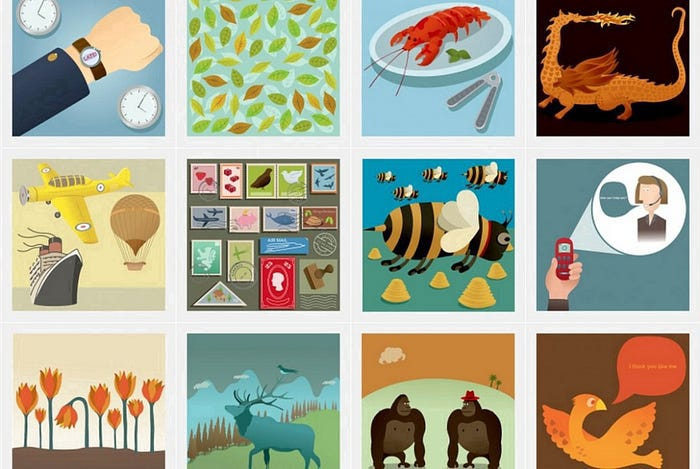
With 350 illustrations on iStock, I started getting decent client commissions.
Producing often will improve your craft and draw attention.
It's the only way to succeed. More creation means better results and greater attention.
Austin Kleon says you can improve your skill in relative anonymity before you become famous. Before obtaining traction, generate a lot and become excellent.
Most artists, even excellent ones, don't create consistently enough to get traction.
It may hurt. For makers who don't love and flow with their work, it's extremely difficult.
Your work must bring you to life.
To generate so much that others can't ignore you, decide what you'll accomplish every day (or most days).
Commit and be patient.
Prepare for zero-traction.
Anticipating this will help you persevere and create.
My online guru Grant Cardone says: Anything worth doing is worth doing every day.
Do.

Techletters
2 years ago
Using Synthesia, DALL-E 2, and Chat GPT-3, create AI news videos
Combining AIs creates realistic AI News Videos.

Powerful AI tools like Chat GPT-3 are trending. Have you combined AIs?
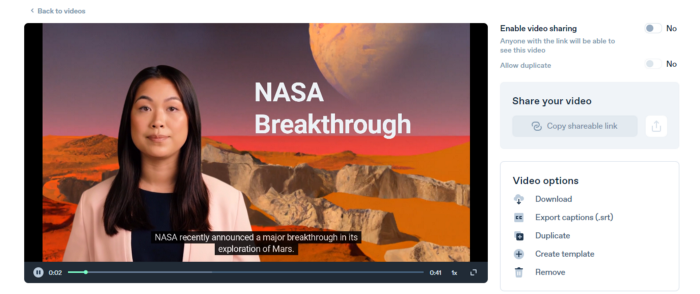
The 1-minute fake news video below is startlingly realistic. Artificial Intelligence developed NASA's Mars exploration breakthrough video (AI). However, integrating the aforementioned AIs generated it.
AI-generated text for the Chat GPT-3 based on a succinct tagline
DALL-E-2 AI generates an image from a brief slogan.
Artificial intelligence-generated avatar and speech
This article shows how to use and mix the three AIs to make a realistic news video. First, watch the video (1 minute).
Talk GPT-3
Chat GPT-3 is an OpenAI NLP model. It can auto-complete text and produce conversational responses.
Try it at the playground. The AI will write a comprehensive text from a brief tagline. Let's see what the AI generates with "Breakthrough in Mars Project" as the headline.
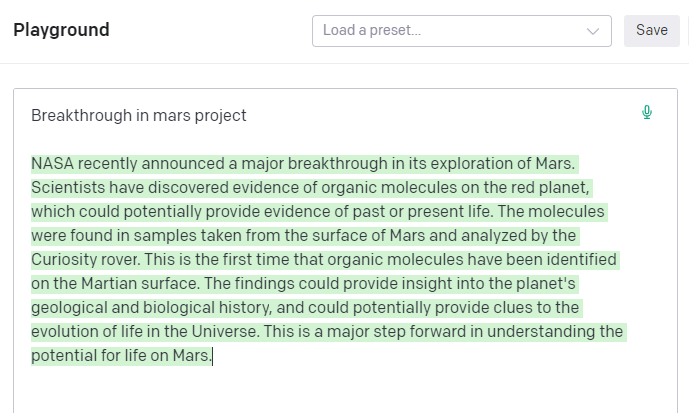
Amazing. Our tagline matches our complete and realistic text. Fake news can start here.
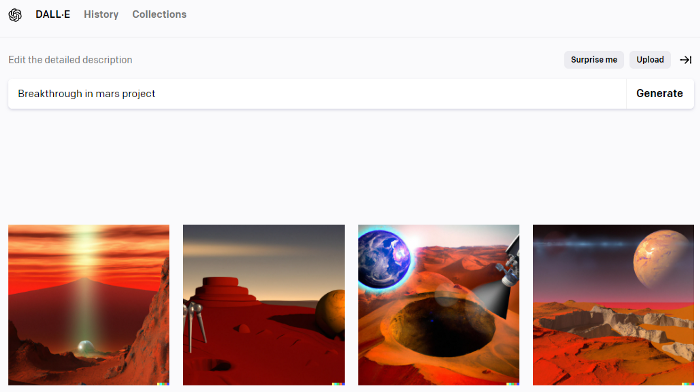
DALL-E-2
OpenAI's huge transformer-based language model DALL-E-2. Its GPT-3 basis is geared for image generation. It can generate high-quality photos from a brief phrase and create artwork and images of non-existent objects.
DALL-E-2 can create a news video background. We'll use "Breakthrough in Mars project" again. Our AI creates four striking visuals. Last.
Synthesia
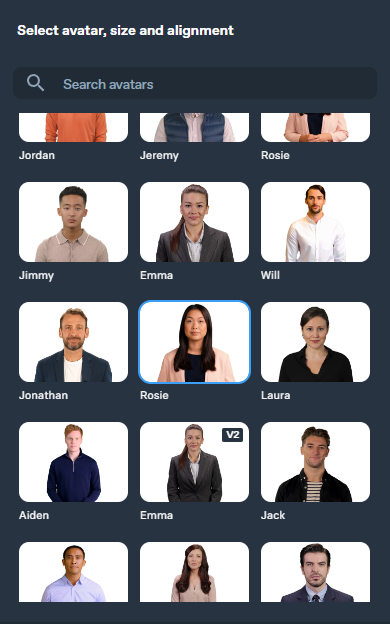
Synthesia lets you quickly produce videos with AI avatars and synthetic vocals.
Avatars are first. Rosie it is.
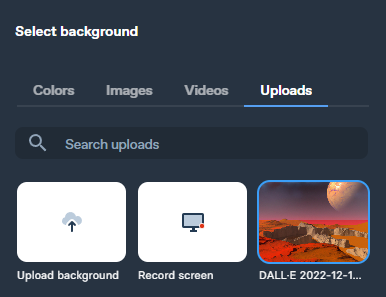
Upload and select DALL-backdrop. E-2's
Copy the Chat GPT-3 content and choose a synthetic voice.
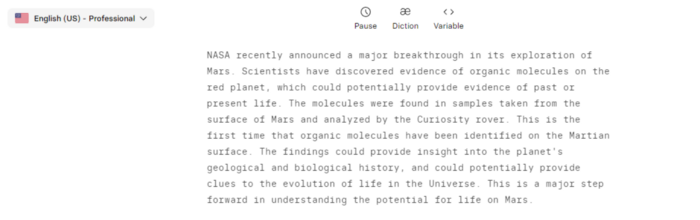
Voice: English (US) Professional.
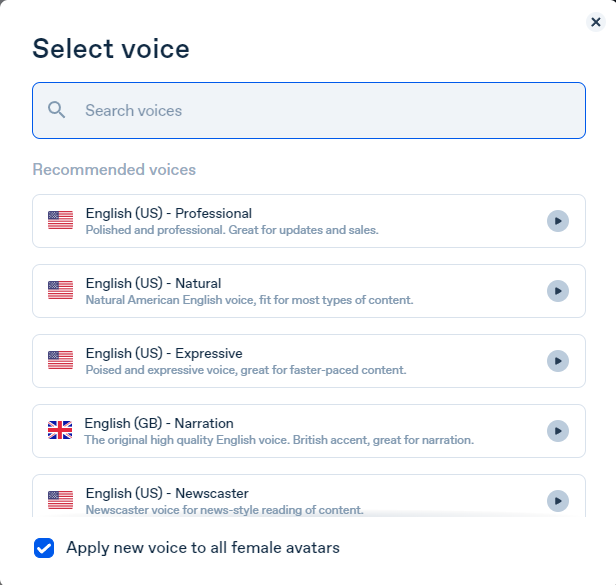
Finally, we generate and watch or download our video.
Synthesia AI completes the AI video.
Overview & Resources
We used three AIs to make surprisingly realistic NASA Mars breakthrough fake news in this post. Synthesia generates an avatar and a synthetic voice, therefore it may be four AIs.
These AIs created our fake news.
AI-generated text for the Chat GPT-3 based on a succinct tagline
DALL-E-2 AI generates an image from a brief slogan.
Artificial intelligence-generated avatar and speech

Mangu Solutions
3 years ago
Growing a New App to $15K/mo in 6 Months [SaaS Case Study]
Discover How We Used Facebook Ads to Grow a New Mobile App from $0 to $15K MRR in Just 6 Months and Our Strategy to Hit $100K a Month.
Our client introduced a mobile app for Poshmark resellers in December and wanted as many to experience it and subscribe to the monthly plan.
An Error We Committed
We initiated a Facebook ad campaign with a "awareness" goal, not "installs." This sent them to a landing page that linked to the iPhone App Store and Android Play Store. Smart, right?
We got some installs, but we couldn't tell how many came from the ad versus organic/other channels because the objective we chose only reported landing page clicks, not app installs.
We didn't know which interest groups/audiences had the best cost per install (CPI) to optimize and scale our budget.
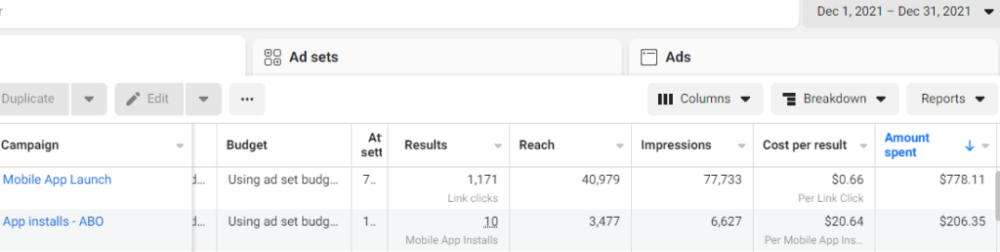
After spending $700 without adequate data (installs and trials report), we stopped the campaign and worked with our client's app developer to set up app events tracking.
This allowed us to create an installs campaign and track installs, trials, and purchases (in some cases).
Finding a Successful Audience
Once we knew what ad sets brought in what installs at what cost, we began optimizing and testing other interest groups and audiences, growing the profitable low CPI ones and eliminating the high CPI ones.
We did all our audience testing using an ABO campaign (Ad Set Budget Optimization), spending $10 to $30 on each ad set for three days and optimizing afterward. All ad sets under $30 were moved to a CBO campaign (Campaign Budget Optimization).
We let Facebook's AI decide how much to spend on each ad set, usually the one most likely to convert at the lowest cost.
If the CBO campaign maintains a nice CPI, we keep increasing the budget by $50 every few days or duplicating it sometimes in order to double the budget. This is how we've scaled to $400/day profitably.
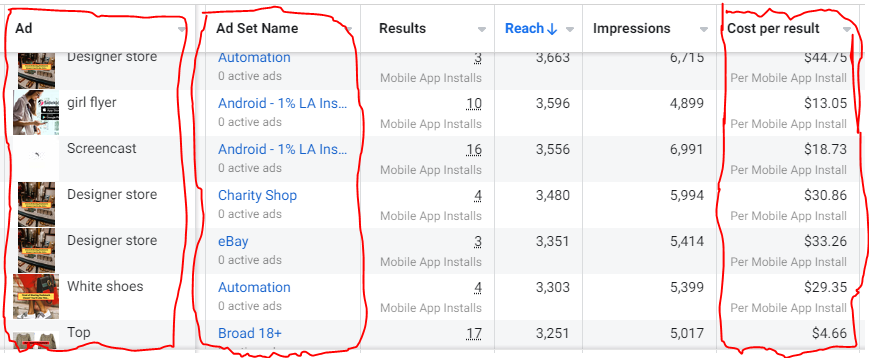
Finding Successful Creatives
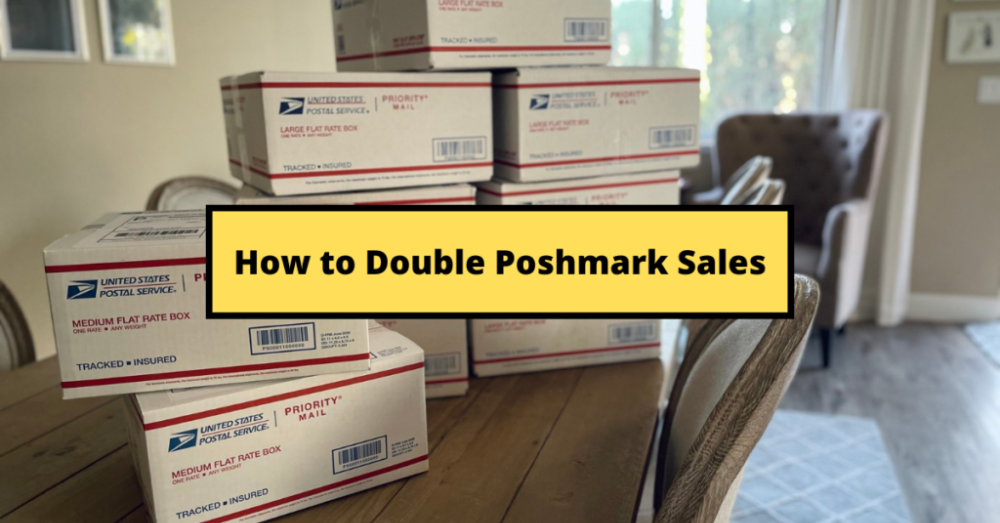
Per campaign, we tested 2-6 images/videos. Same ad copy and CTA. There was no clear winner because some images did better with some interest groups.
The image above with mail packages, for example, got us a cheap CPI of $9.71 from our Goodwill Stores interest group but, a high $48 CPI from our lookalike audience. Once we had statistically significant data, we turned off the high-cost ad.
New marketers who are just discovering A/B testing may assume it's black and white — winner and loser. However, Facebook ads' machine learning and reporting has gotten so sophisticated that it's hard to call a creative a flat-out loser, but rather a 'bad fit' for some audiences, and perfect for others.
You can see how each creative performs across age groups and optimize.
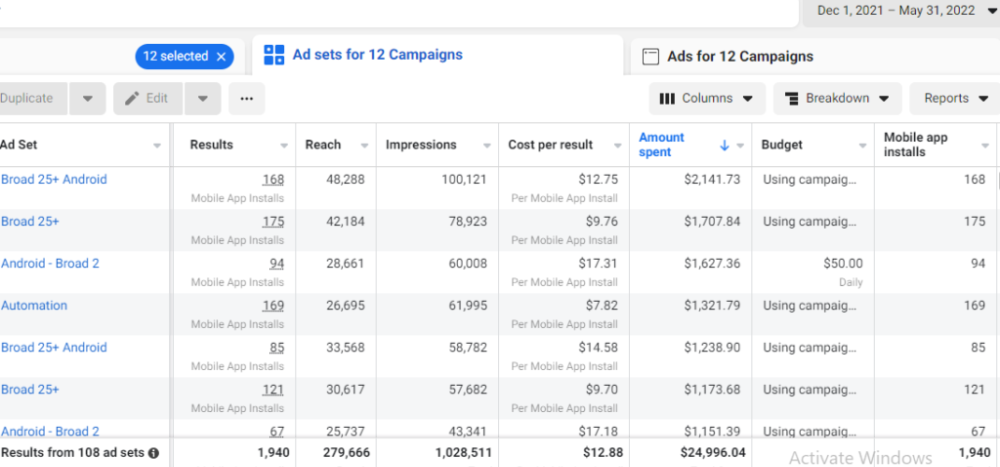
How Many Installs Did It Take Us to Earn $15K Per Month?
Six months after paying $25K, we got 1,940 app installs, 681 free trials, and 522 $30 monthly subscriptions. 522 * $30 gives us $15,660 in monthly recurring revenue (MRR).
Next, what? $100K per month
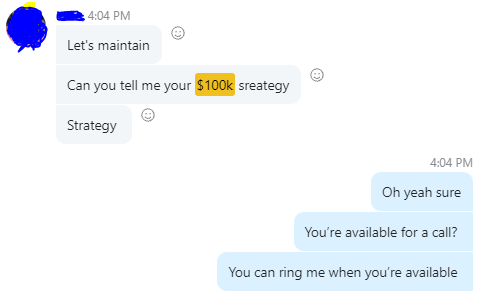
The conversation above is with the app's owner. We got on a 30-minute call where I shared how I plan to get the app to be making $100K a month like I’ve done for other businesses.
Reverse Engineering $100K
Formula:
For $100K/month, we need 3,334 people to pay $30/month. 522 people pay that. We need 2,812 more paid users.
522 paid users from 1,940 installs is a 27% conversion rate. To hit $100K/month, we need 10,415 more installs. Assuming...
With a $400 daily ad spend, we average 40 installs per day. This means that if everything stays the same, it would take us 260 days (around 9 months) to get to $100K a month (MRR).
Conclusion
You must market your goods to reach your income objective (without waiting forever). Paid ads is the way to go if you hate knocking on doors or irritating friends and family (who aren’t scalable anyways).
You must also test and optimize different angles, audiences, interest groups, and creatives.