


The Jordan 6 Rings Reintroduce Classic Bulls
The Jordan 6 Rings return in Bulls colors, a deviation from previous releases. The signature red color is used on the midsole and heel, as well as the chenille patch and pull tab. The rest of the latter fixture is black, matching the outsole and adjacent Jumpman logos. Finally, white completes the look, from the leather mudguard to the lace unit. Here's a closer look at the Jordan 6 Rings. Sizes should be available soon on Nike.com and select retailers. Also, official photos of the Air Jordan 1 Denim have surfaced.
Jordan 6 Rings
Release Date: 2022
Color: N/A
Mens: $130
Style Code: 322992-126
More on Lifestyle

Sneaker News
3 years ago
This Month Will See The Release Of Travis Scott x Nike Footwear
Following the catastrophes at Astroworld, Travis Scott was swiftly vilified by both media outlets and fans alike, and the names who had previously supported him were quickly abandoned. Nike, on the other hand, remained silent, only delaying the release of La Flame's planned collaborations, such as the Air Max 1 and Air Trainer 1, indefinitely. While some may believe it is too soon for the artist to return to the spotlight, the Swoosh has other ideas, as Nice Kicks reveals that these exact sneakers will be released in May.
Both the Travis Scott x Nike Air Max 1 and the Travis Scott x Nike Air Trainer 1 are set to come in two colorways this month. Tinker Hatfield's renowned runner will meet La Flame's "Baroque Brown" and "Saturn Gold" make-ups, which have been altered with backwards Swooshes and outdoors-themed webbing. The high-top trainer is being customized with Hatfield's "Wheat" and "Grey Haze" palettes, both of which include zippers across the heel, co-branded patches, and other details.
See below for a closer look at the four footwear. TravisScott.com is expected to release the shoes on May 20th, according to Nice Kicks. Following that, on May 27th, Nike SNKRS will release the shoe.
Travis Scott x Nike Air Max 1 "Baroque Brown"
Release Date: 2022
Color: Baroque Brown/Lemon Drop/Wheat/Chile Red
Mens: $160
Style Code: DO9392-200
Pre-School: $85
Style Code: DN4169-200
Infant & Toddler: $70
Style Code: DN4170-200
Travis Scott x Nike Air Max 1 "Saturn Gold"
Release Date: 2022
Color: N/A
Mens: $160
Style Code: DO9392-700
Travis Scott x Nike Air Trainer 1 "Wheat"
Restock Date: May 27th, 2022 (Friday)
Original Release Date: May 20th, 2022 (Friday)
Color: N/A
Mens: $140
Style Code: DR7515-200
Travis Scott x Nike Air Trainer 1 "Grey Haze"
Restock Date: May 27th, 2022 (Friday)
Original Release Date: May 20th, 2022 (Friday)
Color: N/A
Mens: $140
Style Code: DR7515-001

Stephen Rivers
3 years ago
Because of regulations, the $3 million Mercedes-AMG ONE will not (officially) be available in the United States or Canada.
We asked Mercedes to clarify whether "customers" refers to people who have expressed interest in buying the AMG ONE but haven't made a down payment or paid in full for a production slot, and a company spokesperson told that it's the latter – "Actual customers for AMG ONE in the United States and Canada."
The Mercedes-AMG ONE has finally arrived in manufacturing form after numerous delays. This may be the most complicated and magnificent hypercar ever created, but according to Mercedes, those roads will not be found in the United States or Canada.
Despite all of the well-deserved excitement around the gorgeous AMG ONE, there was no word on when US customers could expect their cars. Our Editor-in-Chief became aware of this and contacted Mercedes to clarify the matter. Mercedes-hypercar AMG's with the F1-derived 1,049 HP 1.6-liter V6 engine will not be homologated for the US market, they've confirmed.
Mercedes has informed its customers in the United States and Canada that the ONE will not be arriving to North America after all, as of today, June 1, 2022. The whole text of the letter is included below, so sit back and wait for Mercedes to explain why we (or they) won't be getting (or seeing) the hypercar. Mercedes claims that all 275 cars it wants to produce have already been reserved, with net pricing in Europe starting at €2.75 million (about US$2.93 million at today's exchange rates), before country-specific taxes.
"The AMG-ONE was created with one purpose in mind: to provide a straight technology transfer of the World Championship-winning Mercedes-AMG Petronas Formula 1 E PERFORMANCE drive unit to the road." It's the first time a complete Formula 1 drive unit has been integrated into a road car.
Every component of the AMG ONE has been engineered to redefine high performance, with 1,000+ horsepower, four electric motors, and a blazing top speed of more than 217 mph. While the engine's beginnings are in competition, continuous research and refinement has left us with a difficult choice for the US market.
We determined that following US road requirements would considerably damage its performance and overall driving character in order to preserve the distinctive nature of its F1 powerplant. We've made the strategic choice to make the automobile available for road use in Europe, where it complies with all necessary rules."
If this is the first time US customers have heard about it, which it shouldn't be, we understand if it's a bit off-putting. The AMG ONE could very probably be Mercedes' final internal combustion hypercar of this type.
Nonetheless, we wouldn't be surprised if a few make their way to the United States via the federal government's "Show and Display" exemption provision. This legislation permits the importation of automobiles such as the AMG ONE, but only for a total of 2,500 miles per year.
The McLaren Speedtail, the Koenigsegg One:1, and the Bugatti EB110 are among the automobiles that have been imported under this special rule. We just hope we don't have to wait too long to see the ONE in the United States.

Marcus Lu
3 years ago
The Brand Structure of U.S. Electric Vehicle Production
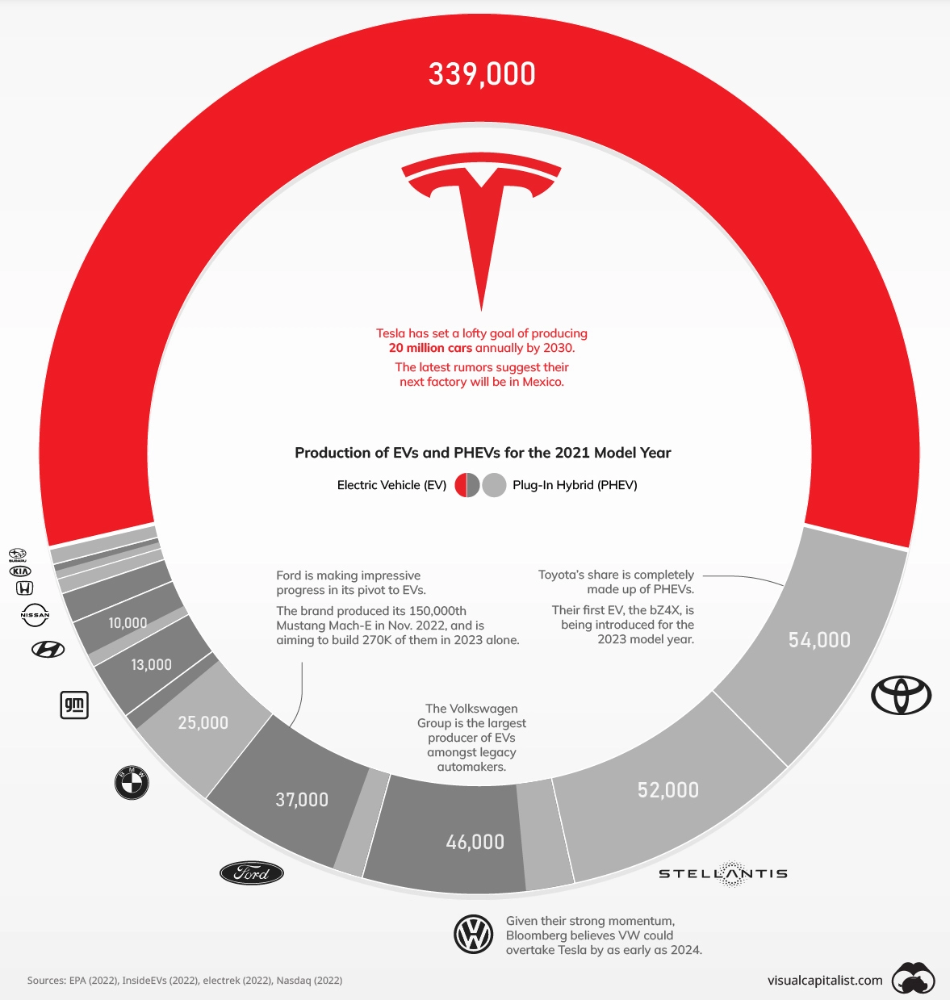
Will Tesla be able to maintain its lead in the EV market for very long?
This is one of the most pressing issues in the American auto sector today. One positive aspect of Tesla is the company's devoted customer base and recognizable name recognition (similar to Apple). It also invests more in research and development per vehicle than its rivals and has a head start in EV production.
Conversely, established automakers like Volkswagen are actively plotting their strategy to surpass Tesla. As the current market leaders, they have decades of experience in the auto industry and are spending billions to catch up.
We've visualized data from the EPA's 2022 Automotive Trends Report to bring you up to speed on this developing story.
Info for the Model Year of 2021
The full production data used in this infographic is for the 2021 model year, but it comes from a report for 2022.
Combined EV and PHEV output is shown in the table below (plug-in hybrid electric vehicle).
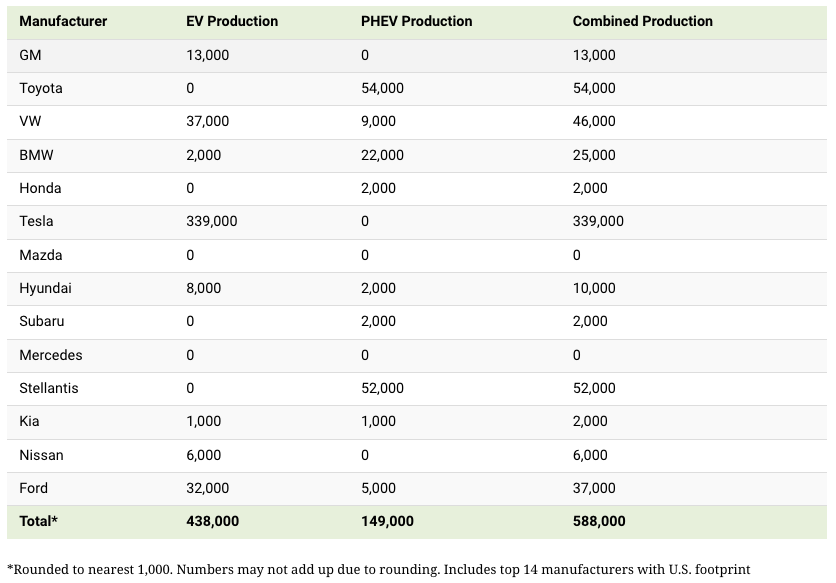
It is important to note that Toyota and Stellantis, the two largest legacy automakers in this dataset, only produced PHEVs. Toyota's first electric vehicle, the bZ4X, won't hit the market until 2023.
Stellantis seems to be falling even further behind, despite having enormous unrealized potential in its Jeep and Ram brands. Stellantis CEO Carlos Tavares said in a recent interview that the firm has budgeted $36 billion for electrification and software.
Legacy Brands with the Most Momentum
In the race to develop electric vehicles, some long-standing manufacturers have gotten the jump on their rivals.
Volkswagen, one of these storied manufacturers, has made a significant investment in electric vehicles (EVs) in the wake of the Dieselgate scandal. The company plans to roll out multiple EV models, including the ID.3 hatchback, ID.4 SUV, and ID. Buzz, with the goal of producing 22 million EVs by 2028. (an electric revival of the classic Microbus).
Even Ford is keeping up, having just announced an EV investment of $22 billion between 2021 and 2025. In November of 2022, the company manufactured their 150,000th Mustang Mach-E, and by the end of 2023, they hoped to have 270,000 of them in circulation.
Additionally, over 200,000 F-150 Lightnings have been reserved since Ford announced the truck. The Lightning is scheduled to have a production run of 15,000 in 2022, 55,000 in 2023, and 80,000 in 2024. Ford's main competitor in the electric pickup truck segment, Rivian, is on track to sell 25,000 vehicles by 2022.
You might also like

Jerry Keszka
3 years ago
10 Crazy Useful Free Websites No One Told You About But You Needed
The internet is a massive information resource. With so much stuff, it's easy to forget about useful websites. Here are five essential websites you may not have known about.

1. Companies.tools
Companies.tools are what successful startups employ. This website offers a curated selection of design, research, coding, support, and feedback resources. Ct has the latest app development platform and greatest client feedback method.
2. Excel Formula Bot
Excel Formula Bot can help if you forget a formula. Formula Bot uses AI to convert text instructions into Excel formulas, so you don't have to remember them.
Just tell the Bot what to do, and it will do it. Excel Formula Bot can calculate sales tax and vacation days. When you're stuck, let the Bot help.
3.TypeLit
TypeLit helps you improve your typing abilities while reading great literature.
TypeLit.io lets you type any book or dozens of preset classics. TypeLit provides real-time feedback on accuracy and speed.
Goals and progress can be tracked. Why not improve your typing and learn great literature with TypeLit?
4. Calm Schedule
Finding a meeting time that works for everyone is difficult. Personal and business calendars might be difficult to coordinate.
Synchronize your two calendars to save time and avoid problems. You may avoid searching through many calendars for conflicts and keep your personal information secret. Having one source of truth for personal and work occasions will help you never miss another appointment.
https://calmcalendar.com/
5. myNoise
myNoise makes the outside world quieter. myNoise is the right noise for a noisy office or busy street.
If you can't locate the right noise, make it. MyNoise unlocks the world. Shut out distractions. Thank your ears.
6. Synthesia
Professional videos require directors, filmmakers, editors, and animators. Now, thanks to AI, you can generate high-quality videos without video editing experience.
AI avatars are crucial. You can design a personalized avatar using a web-based software like synthesia.io. Our avatars can lip-sync in over 60 languages, so you can make worldwide videos. There's an AI avatar for every video goal.
Not free. Amazing service, though.
7. Cleaning-up-images
Have you shot a wonderful photo just to notice something in the background? You may have a beautiful headshot but wish to erase an imperfection.
Cleanup.pictures removes undesirable objects from photos. Our algorithms will eliminate the selected object.
Cleanup.pictures can help you obtain the ideal shot every time. Next time you take images, let Cleanup.pictures fix any flaws.
8. PDF24 Tools
Editing a PDF can be a pain. Most of us don't know Adobe Acrobat's functionalities. Why buy something you'll rarely use? Better options exist.
PDF24 is an online PDF editor that's free and subscription-free. Rotate, merge, split, compress, and convert PDFs in your browser. PDF24 makes document signing easy.
Upload your document, sign it (or generate a digital signature), and download it. It's easy and free. PDF24 is a free alternative to pricey PDF editing software.
9. Class Central
Finding online classes is much easier. Class Central has classes from Harvard, Stanford, Coursera, Udemy, and Google, Amazon, etc. in one spot.
Whether you want to acquire a new skill or increase your knowledge, you'll find something. New courses bring variety.
10. Rome2rio
Foreign travel offers countless transport alternatives. How do you get from A to B? It’s easy!
Rome2rio will show you the best method to get there, including which mode of transport is ideal.
Plane
Car
Train
Bus
Ferry
Driving
Shared bikes
Walking
Do you know any free, useful websites?

Yuga Labs
4 years ago
Yuga Labs (BAYC and MAYC) buys CryptoPunks and Meebits and gives them commercial rights
Yuga has acquired the CryptoPunks and Meebits NFT IP from Larva Labs. These include 423 CryptoPunks and 1711 Meebits.
We set out to create in the NFT space because we admired CryptoPunks and the founders' visionary work. A lot of their work influenced how we built BAYC and NFTs. We're proud to lead CryptoPunks and Meebits into the future as part of our broader ecosystem.
"Yuga Labs invented the modern profile picture project and are the best in the world at operating these projects. They are ideal CrytoPunk and Meebit stewards. We are confident that in their hands, these projects will thrive in the emerging decentralized web.”
–The founders of Larva Labs, CryptoPunks, and Meebits
This deal grew out of discussions between our partner Guy Oseary and the Larva Labs founders. One call led to another, and now we're here. This does not mean Matt and John will join Yuga. They'll keep running Larva Labs and creating awesome projects that help shape the future of web3.
Next steps
Here's what we plan to do with CryptoPunks and Meebits now that we own the IP. Owners of CryptoPunks and Meebits will soon receive commercial rights equal to those of BAYC and MAYC holders. Our legal teams are working on new terms and conditions for both collections, which we hope to share with the community soon. We expect a wide range of third-party developers and community creators to incorporate CryptoPunks and Meebits into their web3 projects. We'll build the brand alongside them.
We don't intend to cram these NFT collections into the BAYC club model. We see BAYC as the hub of the Yuga universe, and CryptoPunks as a historical collection. We will work to improve the CryptoPunks and Meebits collections as good stewards. We're not in a hurry. We'll consult the community before deciding what to do next.
For us, NFTs are about culture. We're deeply invested in the BAYC community, and it's inspiring to see them grow, collaborate, and innovate. We're excited to see what CryptoPunks and Meebits do with IP rights. Our goal has always been to create a community-owned brand that goes beyond NFTs, and now we can include CryptoPunks and Meebits.

Dr. Linda Dahl
3 years ago
We eat corn in almost everything. Is It Important?

Corn Kid got viral on TikTok after being interviewed by Recess Therapy. Tariq, called the Corn Kid, ate a buttery ear of corn in the video. He's corn crazy. He thinks everyone just has to try it. It turns out, whether we know it or not, we already have.
Corn is a fruit, veggie, and grain. It's the second-most-grown crop. Corn makes up 36% of U.S. exports. In the U.S., it's easy to grow and provides high yields, as proven by the vast corn belt spanning the Midwest, Great Plains, and Texas panhandle. Since 1950, the corn crop has doubled to 10 billion bushels.
You say, "Fine." We shouldn't just grow because we can. Why so much corn? What's this corn for?
Why is practical and political. Michael Pollan's The Omnivore's Dilemma has the full narrative. Early 1970s food costs increased. Nixon subsidized maize to feed the public. Monsanto genetically engineered corn seeds to make them hardier, and soon there was plenty of corn. Everyone ate. Woot! Too much corn followed. The powers-that-be had to decide what to do with leftover corn-on-the-cob.
They are fortunate that corn has a wide range of uses.
First, the edible variants. I divide corn into obvious and stealth.
Obvious corn includes popcorn, canned corn, and corn on the cob. This form isn't always digested and often comes out as entire, polka-dotting poop. Cornmeal can be ground to make cornbread, polenta, and corn tortillas. Corn provides antioxidants, minerals, and vitamins in moderation. Most synthetic Vitamin C comes from GMO maize.
Corn oil, corn starch, dextrose (a sugar), and high-fructose corn syrup are often overlooked. They're stealth corn because they sneak into practically everything. Corn oil is used for frying, baking, and in potato chips, mayonnaise, margarine, and salad dressing. Baby food, bread, cakes, antibiotics, canned vegetables, beverages, and even dairy and animal products include corn starch. Dextrose appears in almost all prepared foods, excluding those with high-fructose corn syrup. HFCS isn't as easily digested as sucrose (from cane sugar). It can also cause other ailments, which we'll discuss later.
Most foods contain corn. It's fed to almost all food animals. 96% of U.S. animal feed is corn. 39% of U.S. corn is fed to livestock. But animals prefer other foods. Omnivore chickens prefer insects, worms, grains, and grasses. Captive cows are fed a total mixed ration, which contains corn. These animals' products, like eggs and milk, are also corn-fed.
There are numerous non-edible by-products of corn that are employed in the production of items like:
fuel-grade ethanol
plastics
batteries
cosmetics
meds/vitamins binder
carpets, fabrics
glutathione
crayons
Paint/glue

How does corn influence you? Consider quick food for dinner. You order a cheeseburger, fries, and big Coke at the counter (or drive-through in the suburbs). You tell yourself, "No corn." All that contains corn. Deconstruct:
Cows fed corn produce meat and cheese. Meat and cheese were bonded with corn syrup and starch (same). The bun (corn flour and dextrose) and fries were fried in maize oil. High fructose corn syrup sweetens the drink and helps make the cup and straw.
Just about everything contains corn. Then what? A cornspiracy, perhaps? Is eating too much maize an issue, or should we strive to stay away from it whenever possible?
As I've said, eating some maize can be healthy. 92% of U.S. corn is genetically modified, according to the Center for Food Safety. The adjustments are expected to boost corn yields. Some sweet corn is genetically modified to produce its own insecticide, a protein deadly to insects made by Bacillus thuringiensis. It's safe to eat in sweet corn. Concerns exist about feeding agricultural animals so much maize, modified or not.
High fructose corn syrup should be consumed in moderation. Fructose, a sugar, isn't easily metabolized. Fructose causes diabetes, fatty liver, obesity, and heart disease. It causes inflammation, which might aggravate gout. Candy, packaged sweets, soda, fast food, juice drinks, ice cream, ice cream topping syrups, sauces & condiments, jams, bread, crackers, and pancake syrup contain the most high fructose corn syrup. Everyday foods with little nutrients. Check labels and choose cane sugar or sucrose-sweetened goods. Or, eat corn like the Corn Kid.