


More on Web3 & Crypto

Onchain Wizard
4 years ago
Three Arrows Capital & Celsius Updates
I read 1k+ page 3AC liquidation documentation so you don't have to. Also sharing revised Celsius recovery plans.
3AC's liquidation documents:
Someone disclosed 3AC liquidation records in the BVI courts recently. I'll discuss the leak's timeline and other highlights.
Three Arrows Capital began trading traditional currencies in emerging markets in 2012. They switched to equities and crypto, then purely crypto in 2018.
By 2020, the firm had $703mm in net assets and $1.8bn in loans (these guys really like debt).
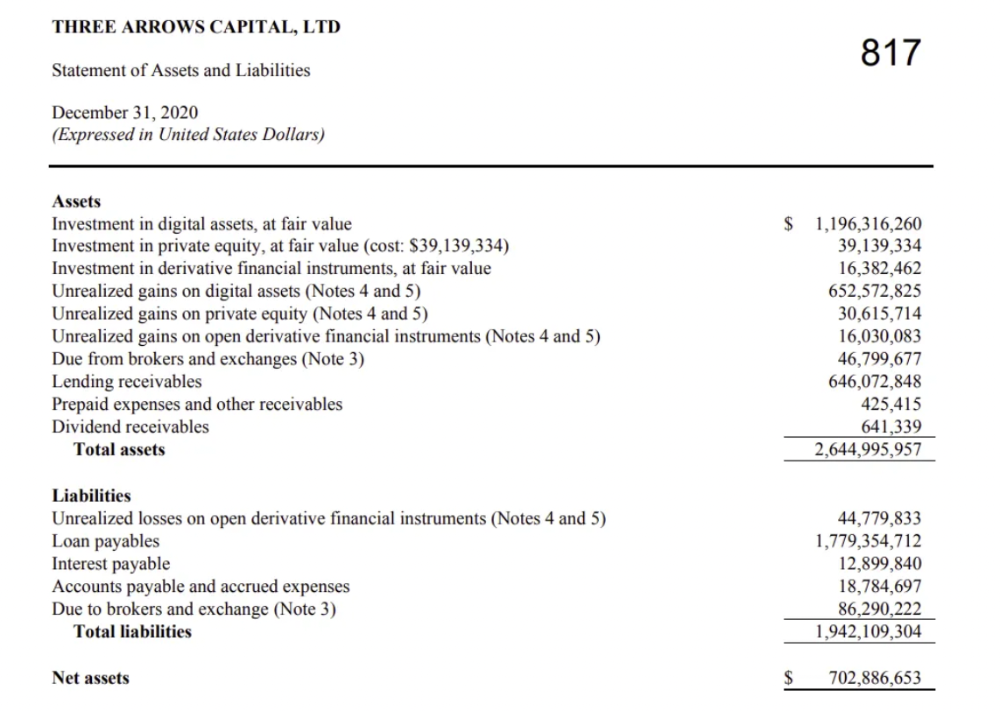
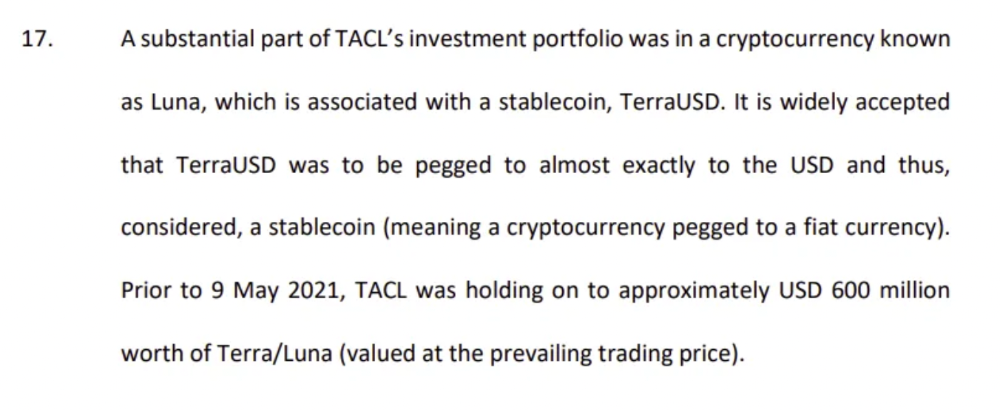
The firm's net assets under control reached $3bn in April 2022, according to the filings. 3AC had $600mm of LUNA/UST exposure before May 9th 2022, which put them over.
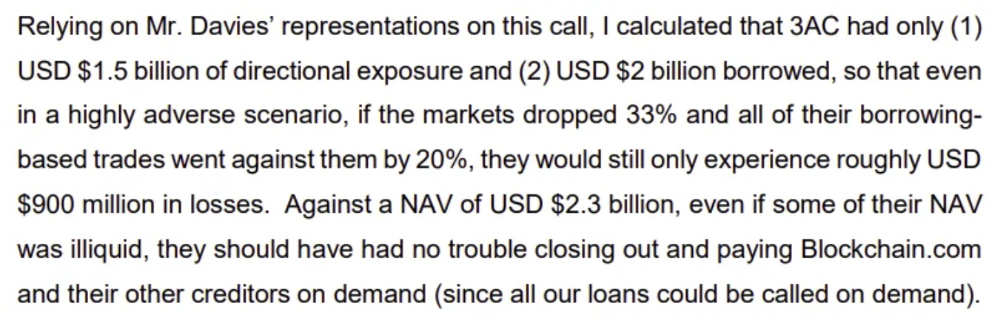
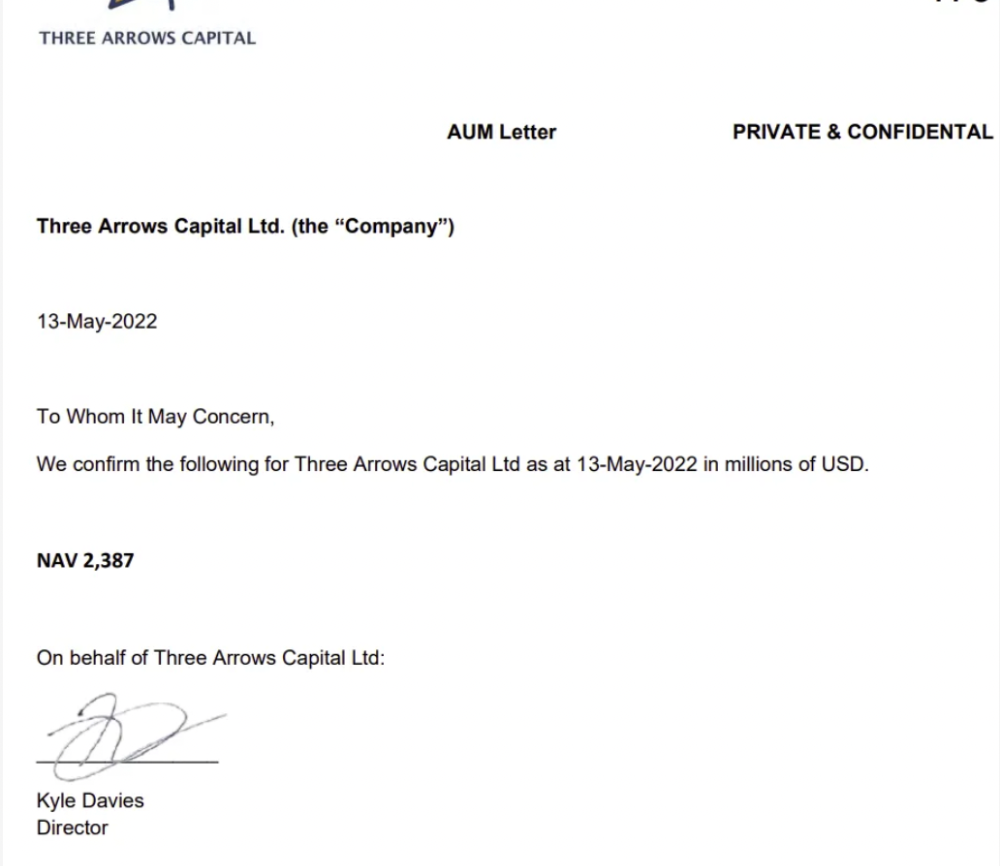
LUNA and UST go to zero quickly (I wrote about the mechanics of the blowup here). Kyle Davies, 3AC co-founder, told Blockchain.com on May 13 that they have $2.4bn in assets and $2.3bn NAV vs. $2bn in borrowings. As BTC and ETH plunged 33% and 50%, the company became insolvent by mid-2022.
3AC sent $32mm to Tai Ping Shen, a Cayman Islands business owned by Su Zhu and Davies' partner, Kelly Kaili Chen (who knows what is going on here).
3AC had borrowed over $3.5bn in notional principle, with Genesis ($2.4bn) and Voyager ($650mm) having the most exposure.
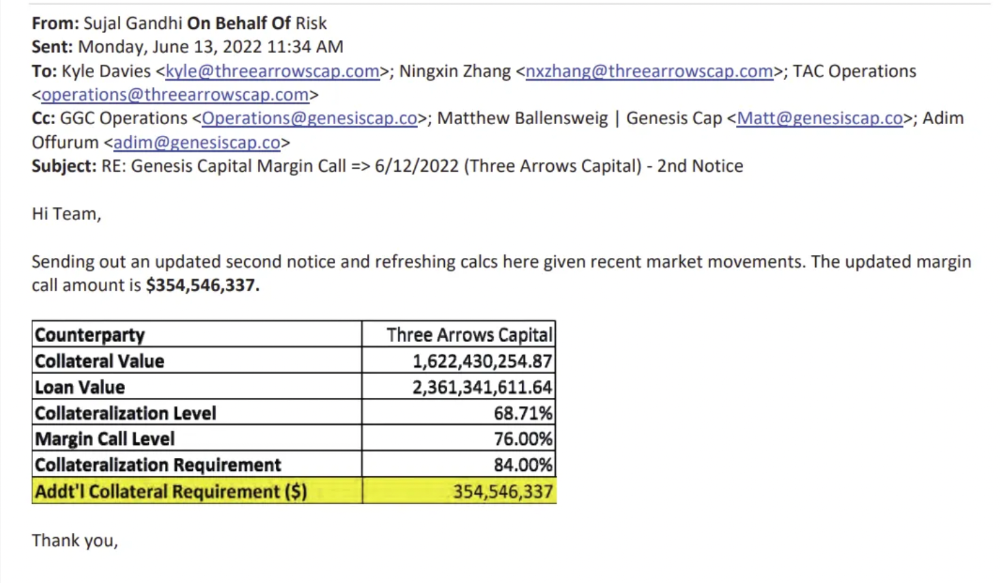
Genesis demanded $355mm in further collateral in June.
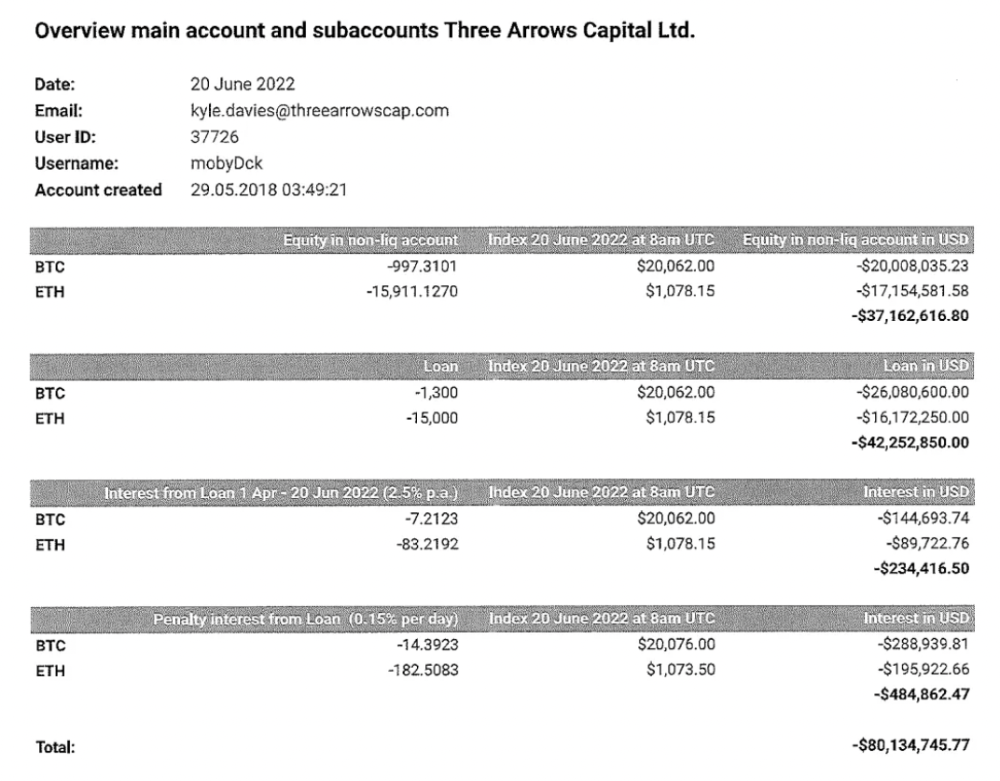
Deribit (another 3AC investment) called for $80 million in mid-June.
Even in mid-June, the corporation was trying to borrow more money to stay afloat. They approached Genesis for another $125mm loan (to pay another lender) and HODLnauts for BTC & ETH loans.
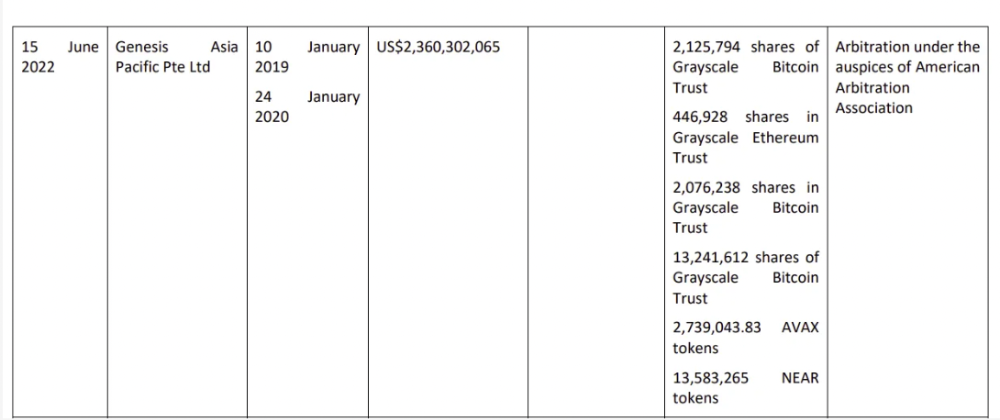
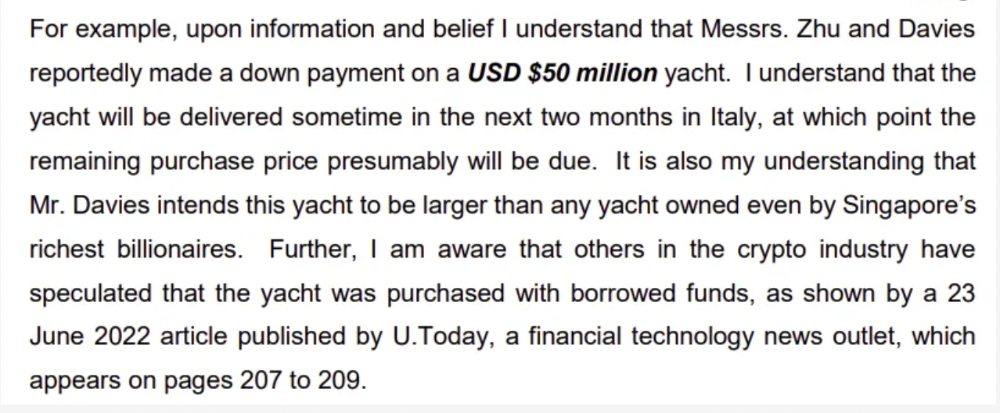
Pretty crazy. 3AC founders used borrowed money to buy a $50 million boat, according to the leak.
Su requesting for $5m + Chen Kaili Kelly asserting they loaned $65m unsecured to 3AC are identified as creditors.
Celsius:
This bankruptcy presentation shows the Celsius breakdown from March to July 14, 2022. From $22bn to $4bn, crypto assets plummeted from $14.6bn to $1.8bn (ouch). $16.5bn in user liabilities dropped to $4.72bn.
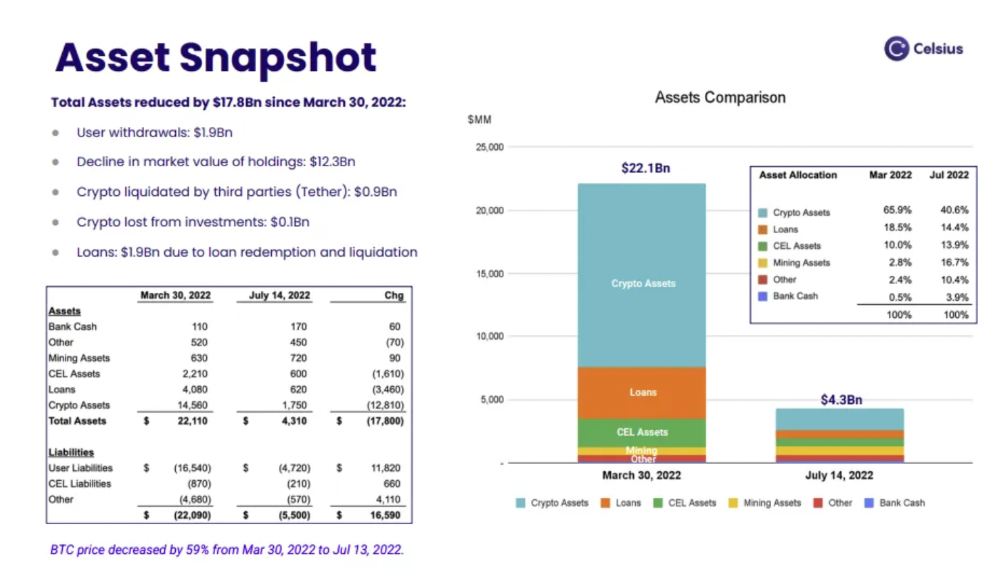
In my recent post, I examined if "forced selling" is over, with Celsius' crypto assets being a major overhang. In this presentation, it looks that Chapter 11 will provide clients the opportunity to accept cash at a discount or remain long crypto. Provided that a fresh source of money is unlikely to enter the Celsius situation, cash at a discount or crypto given to customers will likely remain a near-term market risk - cash at a discount will likely come from selling crypto assets, while customers who receive crypto could sell at any time. I'll share any Celsius updates I find.
Conclusion
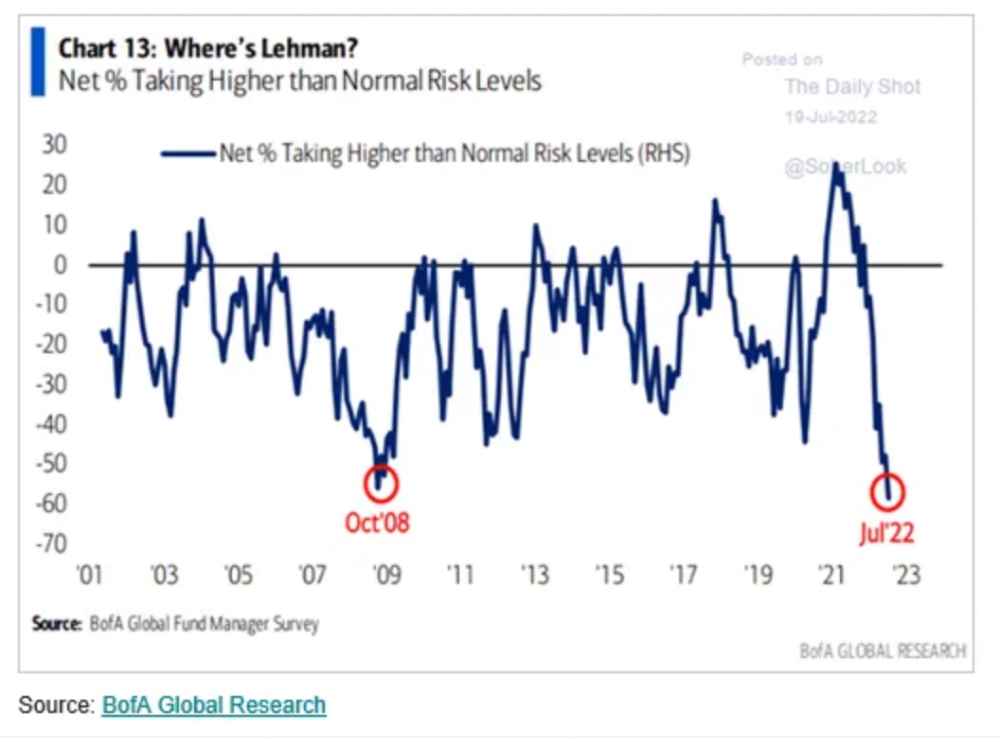
Only Celsius and the Mt Gox BTC unlock remain as forced selling catalysts. While everything went through a "relief" pump, with ETH up 75% from the bottom and numerous alts multiples higher, there are still macro dangers to equities + risk assets. There's a lot of wealth waiting to be deployed in crypto ($153bn in stables), but fund managers are risk apprehensive (lower than 2008 levels).
We're hopefully over crypto's "bottom," with peak anxiety and forced selling behind us, but we may chop around.
To see the full article, click here.
Isobel Asher Hamilton
4 years ago
$181 million in bitcoin buried in a dump. $11 million to get them back
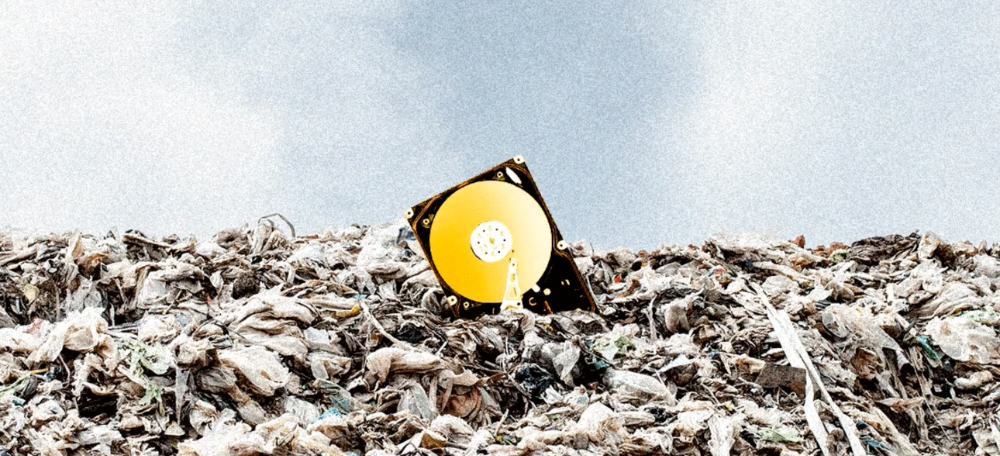
James Howells lost 8,000 bitcoins. He has $11 million to get them back.
His life altered when he threw out an iPhone-sized hard drive.
Howells, from the city of Newport in southern Wales, had two identical laptop hard drives squirreled away in a drawer in 2013. One was blank; the other had 8,000 bitcoins, currently worth around $181 million.
He wanted to toss out the blank one, but the drive containing the Bitcoin went to the dump.
He's determined to reclaim his 2009 stash.
Howells, 36, wants to arrange a high-tech treasure hunt for bitcoins. He can't enter the landfill.
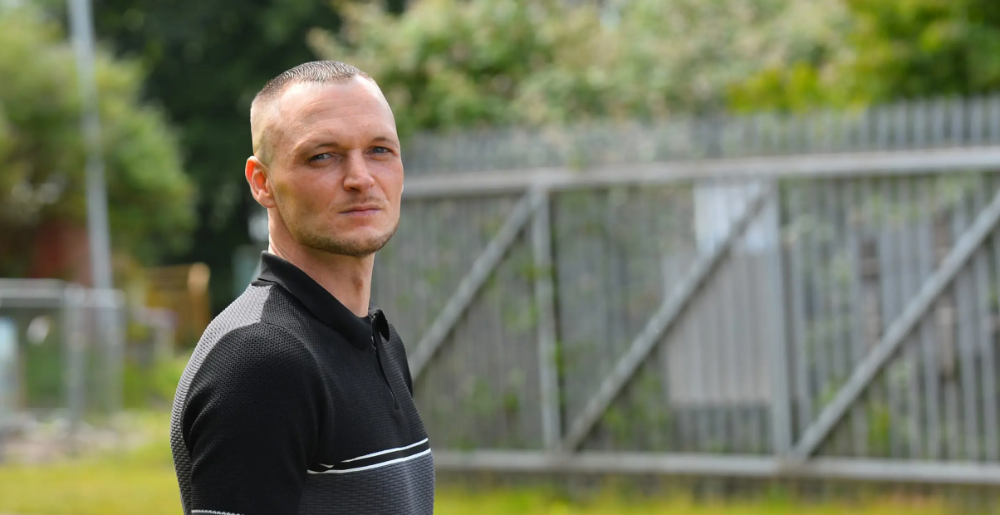
Newport's city council has rebuffed Howells' requests to dig for his hard drive for almost a decade, stating it would be expensive and environmentally destructive.
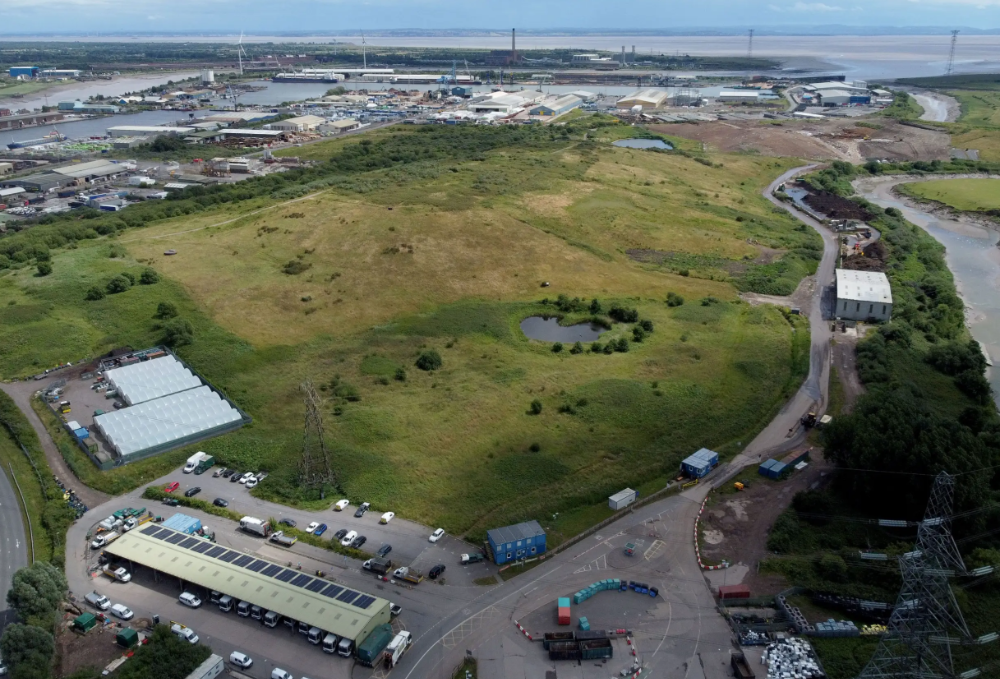
I got an early look at his $11 million idea to search 110,000 tons of trash. He expects submitting it to the council would convince it to let him recover the hard disk.
110,000 tons of trash, 1 hard drive
Finding a hard disk among heaps of trash may seem Herculean.
Former IT worker Howells claims it's possible with human sorters, robot dogs, and an AI-powered computer taught to find hard drives on a conveyor belt.
His idea has two versions, depending on how much of the landfill he can search.
His most elaborate solution would take three years and cost $11 million to sort 100,000 metric tons of waste. Scaled-down version costs $6 million and takes 18 months.
He's created a team of eight professionals in AI-powered sorting, landfill excavation, garbage management, and data extraction, including one who recovered Columbia's black box data.
The specialists and their companies would be paid a bonus if they successfully recovered the bitcoin stash.
Howells: "We're trying to commercialize this project."
Howells claimed rubbish would be dug up by machines and sorted near the landfill.
Human pickers and a Max-AI machine would sort it. The machine resembles a scanner on a conveyor belt.
Remi Le Grand of Max-AI told us it will train AI to recognize Howells-like hard drives. A robot arm would select candidates.
Howells has added security charges to his scheme because he fears people would steal the hard drive.
He's budgeted for 24-hour CCTV cameras and two robotic "Spot" canines from Boston Dynamics that would patrol at night and look for his hard drive by day.
Howells said his crew met in May at the Celtic Manor Resort outside Newport for a pitch rehearsal.
Richard Hammond's narrative swings from banal to epic.
Richard Hammond filmed the meeting and created a YouTube documentary on Howells.
Hammond said of Howells' squad, "They're committed and believe in him and the idea."
Hammond: "It goes from banal to gigantic." "If I were in his position, I wouldn't have the strength to answer the door."
Howells said trash would be cleaned and repurposed after excavation. Reburying the rest.
"We won't pollute," he declared. "We aim to make everything better."
After the project is finished, he hopes to develop a solar or wind farm on the dump site. The council is unlikely to accept his vision soon.
A council representative told us, "Mr. Howells can't convince us of anything." "His suggestions constitute a significant ecological danger, which we can't tolerate and are forbidden by our permit."
Will the recovered hard drive work?
The "platter" is a glass or metal disc that holds the hard drive's data. Howells estimates 80% to 90% of the data will be recoverable if the platter isn't damaged.
Phil Bridge, a data-recovery expert who consulted Howells, confirmed these numbers.
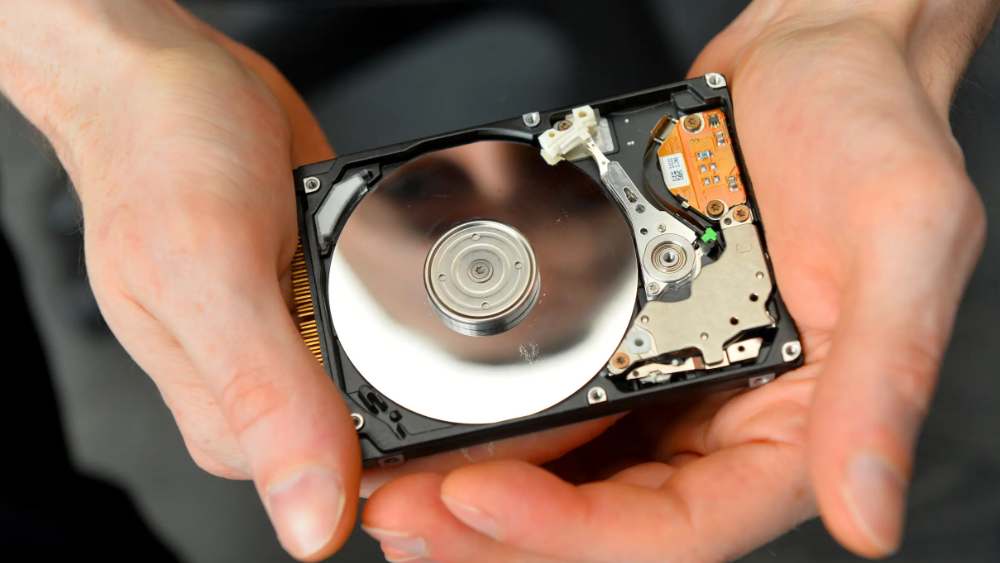
If the platter is broken, Bridge adds, data recovery is unlikely.
Bridge says he was intrigued by the proposal. "It's an intriguing case," he added. Helping him get it back and proving everyone incorrect would be a great success story.
Who'd pay?
Swiss and German venture investors Hanspeter Jaberg and Karl Wendeborn told us they would fund the project if Howells received council permission.
Jaberg: "It's a needle in a haystack and a high-risk investment."
Howells said he had no contract with potential backers but had discussed the proposal in Zoom meetings. "Until Newport City Council gives me something in writing, I can't commit," he added.
Suppose he finds the bitcoins.
Howells said he would keep 30% of the data, worth $54 million, if he could retrieve it.
A third would go to the recovery team, 30% to investors, and the remainder to local purposes, including gifting £50 ($61) in bitcoin to each of Newport's 150,000 citizens.
Howells said he opted to spend extra money on "professional firms" to help convince the council.
What if the council doesn't approve?
If Howells can't win the council's support, he'll sue, claiming its actions constitute a "illegal embargo" on the hard drive. "I've avoided that path because I didn't want to cause complications," he stated. I wanted to cooperate with Newport's council.
Howells never met with the council face-to-face. He mentioned he had a 20-minute Zoom meeting in May 2021 but thought his new business strategy would help.
He met with Jessica Morden on June 24. Morden's office confirmed meeting.
After telling the council about his proposal, he can only wait. "I've never been happier," he said. This is our most professional operation, with the best employees.
The "crypto proponent" buys bitcoin every month and sells it for cash.
Howells tries not to think about what he'd do with his part of the money if the hard disk is found functional. "Otherwise, you'll go mad," he added.
This post is a summary. Read the full article here.

The Verge
4 years ago
Bored Ape Yacht Club creator raises $450 million at a $4 billion valuation.
Yuga Labs, owner of three of the biggest NFT brands on the market, announced today a $450 million funding round. The money will be used to create a media empire based on NFTs, starting with games and a metaverse project.
The team's Otherside metaverse project is an MMORPG meant to connect the larger NFT universe. They want to create “an interoperable world” that is “gamified” and “completely decentralized,” says Wylie Aronow, aka Gordon Goner, co-founder of Bored Ape Yacht Club. “We think the real Ready Player One experience will be player run.”
Just a few weeks ago, Yuga Labs announced the acquisition of CryptoPunks and Meebits from Larva Labs. The deal brought together three of the most valuable NFT collections, giving Yuga Labs more IP to work with when developing games and metaverses. Last week, ApeCoin was launched as a cryptocurrency that will be governed independently and used in Yuga Labs properties.
Otherside will be developed by “a few different game studios,” says Yuga Labs CEO Nicole Muniz. The company plans to create development tools that allow NFTs from other projects to work inside their world. “We're welcoming everyone into a walled garden.”
However, Yuga Labs believes that other companies are approaching metaverse projects incorrectly, allowing the startup to stand out. People won't bond spending time in a virtual space with nothing going on, says Yuga Labs co-founder Greg Solano, aka Gargamel. Instead, he says, people bond when forced to work together.
In order to avoid getting smacked, Solano advises making friends. “We don't think a Zoom chat and walking around saying ‘hi' creates a deep social experience.” Yuga Labs refused to provide a release date for Otherside. Later this year, a play-to-win game is planned.
The funding round was led by Andreessen Horowitz, a major investor in the Web3 space. It previously backed OpenSea and Coinbase. Animoca Brands, Coinbase, and MoonPay are among those who have invested. Andreessen Horowitz general partner Chris Lyons will join Yuga Labs' board. The Financial Times broke the story last month.
"META IS A DOMINANT DIGITAL EXPERIENCE PROVIDER IN A DYSTOPIAN FUTURE."
This emerging [Web3] ecosystem is important to me, as it is to companies like Meta,” Chris Dixon, head of Andreessen Horowitz's crypto arm, tells The Verge. “In a dystopian future, Meta is the dominant digital experience provider, and it controls all the money and power.” (Andreessen Horowitz co-founder Marc Andreessen sits on Meta's board and invested early in Facebook.)
Yuga Labs has been profitable so far. According to a leaked pitch deck, the company made $137 million last year, primarily from its NFT brands, with a 95% profit margin. (Yuga Labs declined to comment on deck figures.)
But the company has built little so far. According to OpenSea data, it has only released one game for a limited time. That means Yuga Labs gets hundreds of millions of dollars to build a gaming company from scratch, based on a hugely lucrative art project.
Investors fund Yuga Labs based on its success. That's what they did, says Dixon, “they created a culture phenomenon”. But ultimately, the company is betting on the same thing that so many others are: that a metaverse project will be the next big thing. Now they must construct it.
You might also like
Benjamin Lin
3 years ago
I sold my side project for $20,000: 6 lessons I learned
How I monetized and sold an abandoned side project for $20,000

The Origin Story
I've always wanted to be an entrepreneur but never succeeded. I often had business ideas, made a landing page, and told my buddies. Never got customers.
In April 2021, I decided to try again with a new strategy. I noticed that I had trouble acquiring an initial set of customers, so I wanted to start by acquiring a product that had a small user base that I could grow.
I found a SaaS marketplace called MicroAcquire.com where you could buy and sell SaaS products. I liked Shareit.video, an online Loom-like screen recorder.
Shareit.video didn't generate revenue, but 50 people visited daily to record screencasts.
Purchasing a Failed Side Project
I eventually bought Shareit.video for $12,000 from its owner.
$12,000 was probably too much for a website without revenue or registered users.
I thought time was most important. I could have recreated the website, but it would take months. $12,000 would give me an organized code base and a working product with a few users to monetize.
I considered buying a screen recording website and trying to grow it versus buying a new car or investing in crypto with the $12K.
Buying the website would make me a real entrepreneur, which I wanted more than anything.
Putting down so much money would force me to commit to the project and prevent me from quitting too soon.
A Year of Development
I rebranded the website to be called RecordJoy and worked on it with my cousin for about a year. Within a year, we made $5000 and had 3000 users.
We spent $3500 on ads, hosting, and software to run the business.
AppSumo promoted our $120 Life Time Deal in exchange for 30% of the revenue.
We put RecordJoy on maintenance mode after 6 months because we couldn't find a scalable user acquisition channel.
We improved SEO and redesigned our landing page, but nothing worked.

Despite not being able to grow RecordJoy any further, I had already learned so much from working on the project so I was fine with putting it on maintenance mode. RecordJoy still made $500 a month, which was great lunch money.
Getting Taken Over
One of our customers emailed me asking for some feature requests and I replied that we weren’t going to add any more features in the near future. They asked if we'd sell.
We got on a call with the customer and I asked if he would be interested in buying RecordJoy for 15k. The customer wanted around $8k but would consider it.
Since we were negotiating with one buyer, we put RecordJoy on MicroAcquire to see if there were other offers.

We quickly received 10+ offers. We got 18.5k. There was also about $1000 in AppSumo that we could not withdraw, so we agreed to transfer that over for $600 since about 40% of our sales on AppSumo usually end up being refunded.
Lessons Learned
First, create an acquisition channel
We couldn't discover a scalable acquisition route for RecordJoy. If I had to start another project, I'd develop a robust acquisition channel first. It might be LinkedIn, Medium, or YouTube.
Purchase Power of the Buyer Affects Acquisition Price
Some of the buyers we spoke to were individuals looking to buy side projects, as well as companies looking to launch a new product category. Individual buyers had less budgets than organizations.
Customers of AppSumo vary.
AppSumo customers value lifetime deals and low prices, which may not be a good way to build a business with recurring revenue. Designed for AppSumo users, your product may not connect with other users.
Try to increase acquisition trust
Acquisition often fails. The buyer can go cold feet, cease communicating, or run away with your stuff. Trusting the buyer ensures a smooth asset exchange. First acquisition meeting was unpleasant and price negotiation was tight. In later meetings, we spent the first few minutes trying to get to know the buyer’s motivations and background before jumping into the negotiation, which helped build trust.
Operating expenses can reduce your earnings.
Monitor operating costs. We were really happy when we withdrew the $5000 we made from AppSumo and Stripe until we realized that we had spent $3500 in operating fees. Spend money on software and consultants to help you understand what to build.
Don't overspend on advertising
We invested $1500 on Google Ads but made little money. For a side project, it’s better to focus on organic traffic from SEO rather than paid ads unless you know your ads are going to have a positive ROI.

VIP Graphics
3 years ago
Leaked pitch deck for Metas' new influencer-focused live-streaming service
As part of Meta's endeavor to establish an interactive live-streaming platform, the company is testing with influencers.
The NPE (new product experimentation team) has been testing Super since late 2020.

Bloomberg defined Super as a Cameo-inspired FaceTime-like gadget in 2020. The tool has evolved into a Twitch-like live streaming application.
Less than 100 creators have utilized Super: Creators can request access on Meta's website. Super isn't an Instagram, Facebook, or Meta extension.
“It’s a standalone project,” the spokesperson said about Super. “Right now, it’s web only. They have been testing it very quietly for about two years. The end goal [of NPE projects] is ultimately creating the next standalone project that could be part of the Meta family of products.” The spokesperson said the outreach this week was part of a drive to get more creators to test Super.
A 2021 pitch deck from Super reveals the inner workings of Meta.
The deck gathered feedback on possible sponsorship models, with mockups of brand deals & features. Meta reportedly paid creators $200 to $3,000 to test Super for 30 minutes.
Meta's pitch deck for Super live streaming was leaked.
What were the slides in the pitch deck for Metas Super?
Embed not supported: see full deck & article here →
View examples of Meta's pitch deck for Super:
Product Slides, first
The pitch deck begins with Super's mission:
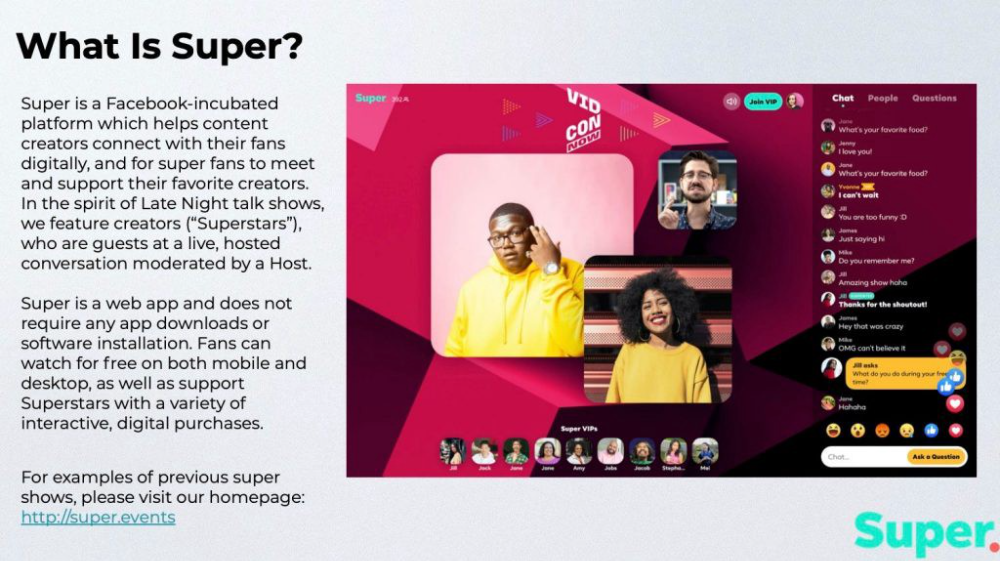
Super is a Facebook-incubated platform which helps content creators connect with their fans digitally, and for super fans to meet and support their favorite creators. In the spirit of Late Night talk shows, we feature creators (“Superstars”), who are guests at a live, hosted conversation moderated by a Host.
This slide (and most of the deck) is text-heavy, with few icons, bullets, and illustrations to break up the content. Super's online app status (which requires no download or installation) might be used as a callout (rather than paragraph-form).
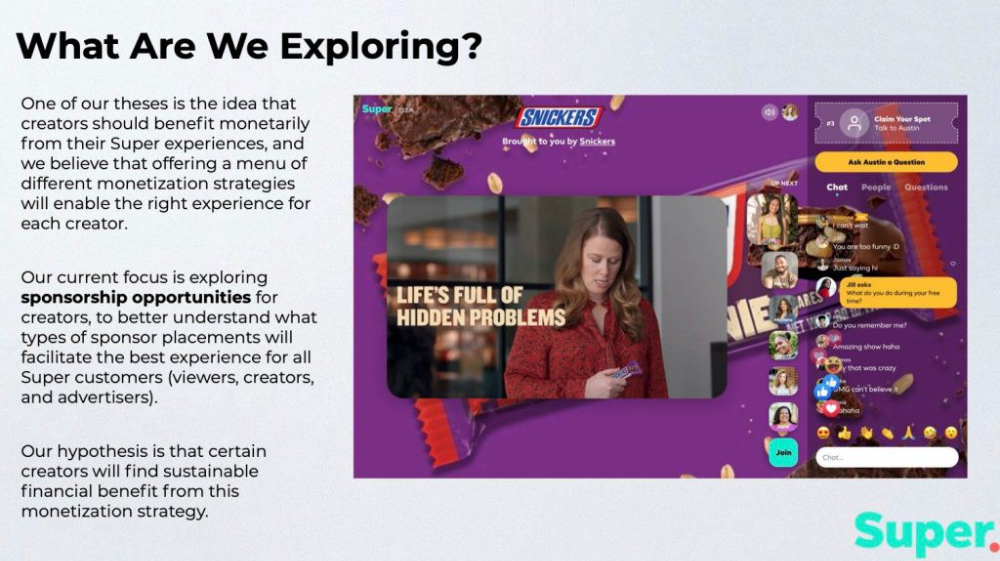
Meta's Super platform focuses on brand sponsorships and native placements, as shown in the slide above.
One of our theses is the idea that creators should benefit monetarily from their Super experiences, and we believe that offering a menu of different monetization strategies will enable the right experience for each creator. Our current focus is exploring sponsorship opportunities for creators, to better understand what types of sponsor placements will facilitate the best experience for all Super customers (viewers, creators, and advertisers).
Colorful mockups help bring Metas vision for Super to life.
2. Slide Features
Super's pitch deck focuses on the platform's features. The deck covers pre-show, pre-roll, and post-event for a Sponsored Experience.
Pre-show: active 30 minutes before the show's start
Pre-roll: Play a 15-minute commercial for the sponsor before the event (auto-plays once)
Meet and Greet: This event can have a branding, such as Meet & Greet presented by [Snickers]
Super Selfies: Makers and followers get a digital souvenir to post on social media.
Post-Event: Possibility to draw viewers' attention to sponsored content/links during the after-show
Almost every screen displays the Sponsor logo, link, and/or branded background. Viewers can watch sponsor video while waiting for the event to start.
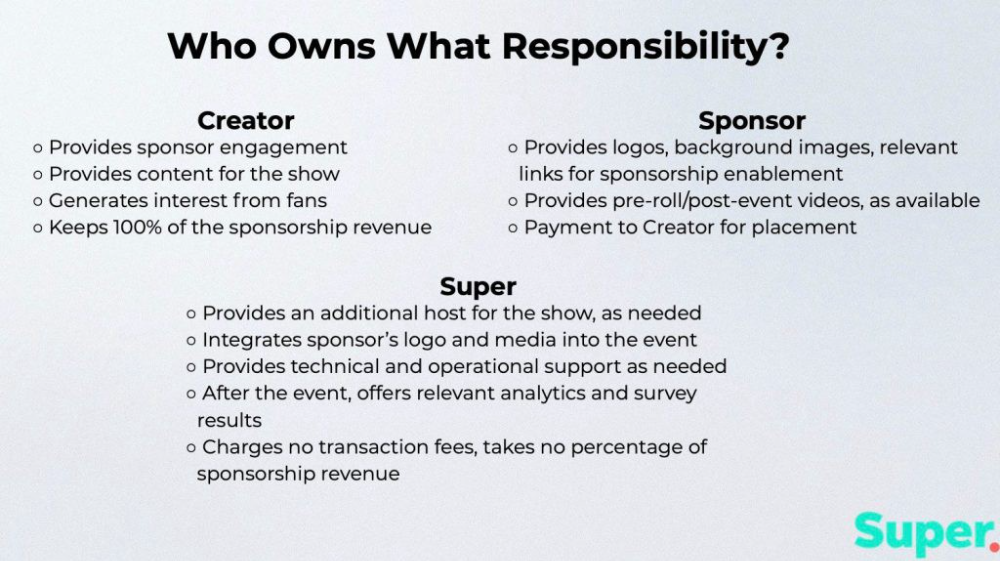
Slide 3: Business Model
Meta's presentation for Super is incomplete without numbers. Super's first slide outlines the creator, sponsor, and Super's obligations. Super does not charge creators any fees or commissions on sponsorship earnings.
How to make a great pitch deck
We hope you can use the Super pitch deck to improve your business. Bestpitchdeck.com/super-meta is a bookmarkable link.
You can also use one of our expert-designed templates to generate a pitch deck.
Our team has helped close $100M+ in agreements and funding for premier companies and VC firms. Use our presentation templates, one-pagers, or financial models to launch your pitch.
Every pitch must be audience-specific. Our team has prepared pitch decks for various sectors and fundraising phases.
Pitch Deck Software VIP.graphics produced a popular SaaS & Software Pitch Deck based on decks that closed millions in transactions & investments for orgs of all sizes, from high-growth startups to Fortune 100 enterprises. This easy-to-customize PowerPoint template includes ready-made features and key slides for your software firm.
Accelerator Pitch Deck The Accelerator Pitch Deck template is for early-stage founders seeking funding from pitch contests, accelerators, incubators, angels, or VC companies. Winning a pitch contest or getting into a top accelerator demands a strategic investor pitch.
Pitch Deck Template Series Startup and founder pitch deck template: Workable, smart slides. This pitch deck template is for companies, entrepreneurs, and founders raising seed or Series A finance.
M&A Pitch Deck Perfect Pitch Deck is a template for later-stage enterprises engaging more sophisticated conversations like M&A, late-stage investment (Series C+), or partnerships & funding. Our team prepared this presentation to help creators confidently pitch to investment banks, PE firms, and hedge funds (and vice versa).
Browse our growing variety of industry-specific pitch decks.

Cory Doctorow
3 years ago
The current inflation is unique.
New Stiglitz just dropped.
Here's the inflation story everyone believes (warning: it's false): America gave the poor too much money during the recession, and now the economy is awash with free money, which made them so rich they're refusing to work, meaning the economy isn't making anything. Prices are soaring due to increased cash and missing labor.
Lawrence Summers says there's only one answer. We must impoverish the poor: raise interest rates, cause a recession, and eliminate millions of jobs, until the poor are stripped of their underserved fortunes and return to work.
https://pluralistic.net/2021/11/20/quiet-part-out-loud/#profiteering
This is nonsense. Countries around the world suffered inflation during and after lockdowns, whether they gave out humanitarian money to keep people from starvation. America has slightly greater inflation than other OECD countries, but it's not due to big relief packages.
The Causes of and Responses to Today's Inflation, a Roosevelt Institute report by Nobel-winning economist Joseph Stiglitz and macroeconomist Regmi Ira, debunks this bogus inflation story and offers a more credible explanation for inflation.
https://rooseveltinstitute.org/wp-content/uploads/2022/12/RI CausesofandResponsestoTodaysInflation Report 202212.pdf
Sharp interest rate hikes exacerbate the slump and increase inflation, the authors argue. They compare monetary policy inflation cures to medieval bloodletting, where doctors repeated the same treatment until the patient recovered (for which they received credit) or died (which was more likely).
Let's discuss bloodletting. Inflation hawks warn of the wage price spiral, when inflation rises and powerful workers bargain for higher pay, driving up expenses, prices, and wages. This is the fairy-tale narrative of the 1970s, and it's true except that OPEC's embargo drove up oil prices, which produced inflation. Oh well.
Let's be generous to seventies-haunted inflation hawks and say we're worried about a wage-price spiral. Fantastic! No. Real wages are 2.3% lower than they were in Oct 2021 after peaking in June at 4.8%.
Why did America's powerful workers take a paycut rather than demand inflation-based pay? Weak unions, globalization, economic developments.
Workers don't expect inflation to rise, so they're not requesting inflationary hikes. Inflationary expectations have remained moderate, consistent with our data interpretation.
https://www.newyorkfed.org/microeconomics/sce#/
Neither are workers. Working people see surplus savings as wealth and spend it gradually over their lives, despite rising demand. People may have saved money by staying in during the lockdown, but they don't eat out every night to make up for it. Instead, they keep those savings as precautionary balances. This is why the economy is lagging.
People don't buy non-traded goods with pandemic savings (basically, imports). Imports don't multiply like domestic purchases. If you buy a loaf of bread from the corner baker for $1 and they spend it at the tavern across the street, that dollar generates $3 in economic activity. Spending a dollar on foreign goods leaves the country and any multiplier effect happens there, not in the US.
Only marginally higher wages. The ECI is up 1.6% from 2019. Almost all gains went to the 25% lowest-paid Americans. Contrary to the inflation worry about too much savings, these workers don't make enough to save, even post-pandemic.
Recreation and transit spending are at or below pre-pandemic levels. Higher food and hotel prices (which doesn’t mean we’re buying more food than we were in 2019, just that it costs more).
What causes inflation if not greedy workers, free money, and high demand? The most expensive domestic goods produce the biggest revenues for their manufacturers. They charge you more without paying their workers or suppliers more.
The largest price-gougers are funneling their earnings to rich people who store it offshore through stock buybacks and dividends. A $1 billion stock buyback doesn't buy $1 billion in bread.
Five factors influence US inflation today:
I. Price rises for energy and food
II. shifts in consumer tastes
III. supply interruptions (mainly autos);
IV. increased rents (due to telecommuting);
V. monopoly (AKA price-gouging).
None can be remedied by raising interest rates or laying off workers.
Russia's invasion of Ukraine, omicron, and China's Zero Covid policy all disrupted the flow of food, energy, and production inputs. The price went higher because we made less.
After Russia invaded Ukraine, oil prices spiked, and sanctions made it worse. But that was February. By October, oil prices had returned to pre-pandemic, 2015 levels attributable to global economic adjustments, including a shift to renewables. Every new renewable installation reduces oil consumption and affects oil prices.
High food prices have a simple solution. The US and EU have bribed farmers not to produce for 50 years. If the war continues, this program may end, and food prices may decline.
Demand changes. We want different things than in 2019, not more. During the lockdown, people substituted goods. Half of the US toilet-paper supply in 2019 was on commercial-sized rolls. This is created from different mills and stock than our toilet paper.
Lockdown pushed toilet paper demand to residential rolls, causing shortages (the TP hoarding story was just another pandemic urban legend). Because supermarket stores don't have accounts with commercial paper distributors, ordering from languishing stores was difficult. Kleenex and paper towel substitutions caused greater shortages.
All that drove increased costs in numerous product categories, and there were more cases. These increases are transient, caused by supply chain inefficiencies that are resolving.
Demand for frontline staff saw a one-time repricing of pay, which is being recouped as we speak.
Illnesses. Brittle, hollowed-out global supply chains aggravated this. The constant pursuit of cheap labor and minimal regulation by monopolies that dominate most sectors means things are manufactured in far-flung locations. Financialization means any surplus capital assets were sold off years ago, leaving firms with little production slack. After the epidemic, several of these systems took years to restart.
Automobiles are to blame. Financialization and monopolization consolidated microchip and auto production in Taiwan and China. When the lockdowns came, these worldwide corporations cancelled their chip orders, and when they placed fresh orders, they were at the back of the line.
That drove up car prices, which is why the US has slightly higher inflation than other wealthy countries: the economy is car-centric. Automobile prices account for 9% of the CPI. France: 3.6%
Rent shocks and telecommuting. After the epidemic, many professionals moved to exurbs, small towns, and the countryside to work from home. As commercial properties were vacated, it was impractical to adapt them for residential use due to planning restrictions. Addressing these restrictions will cut rent prices more than raising inflation rates, which halts housing construction.
Statistical mirages cause some rent inflation. The CPI estimates what homeowners would pay to rent their properties. When rents rise in your neighborhood, the CPI believes you're spending more on rent even if you have a 30-year fixed-rate mortgage.
Market dominance. Almost every area of the US economy is dominated by monopolies, whose CEOs disclose on investor calls that they use inflation scares to jack up prices and make record profits.
https://pluralistic.net/2022/02/02/its-the-economy-stupid/#overinflated
Long-term profit margins are rising. Markups averaged 26% from 1960-1980. 2021: 72%. Market concentration explains 81% of markup increases (e.g. monopolization). Profit margins reach a 70-year high in 2022. These elements interact. Monopolies thin out their sectors, making them brittle and sensitive to shocks.
If we're worried about a shrinking workforce, there are more humanitarian and sensible solutions than causing a recession and mass unemployment. Instead, we may boost US production capacity by easing workers' entry into the workforce.
https://pluralistic.net/2022/06/01/factories-to-condos-pipeline/#stuff-not-money
US female workforce participation ranks towards the bottom of developed countries. Many women can't afford to work due to America's lack of daycare, low earnings, and bad working conditions in female-dominated fields. If America doesn't have enough workers, childcare subsidies and minimum wages can help.
By contrast, driving the country into recession with interest-rate hikes will reduce employment, and the last recruited (women, minorities) are the first fired and the last to be rehired. Forcing America into recession won't enhance its capacity to create what its people want; it will degrade it permanently.
Nothing the Fed does can stop price hikes from international markets, lack of supply chain investment, COVID-19 disruptions, climate change, the Ukraine war, or market power. They can worsen it. When supply problems generate inflation, raising interest rates decreases investments that can remedy shortages.
Increasing interest rates won't cut rents since landlords pass on the expenses and high rates restrict investment in new dwellings where tenants could escape the costs.
Fixing the supply fixes supply-side inflation. Increase renewables investment (as the Inflation Reduction Act does). Monopolies can be busted (as the IRA does). Reshore key goods (as the CHIPS Act does). Better pay and child care attract employees.
Windfall taxes can claw back price-gouging corporations' monopoly earnings.
https://pluralistic.net/2022/03/15/sanctions-financing/#soak-the-rich
In 2008, we ruled out fiscal solutions (bailouts for debtors) and turned to monetary policy (bank bailouts). This preserved the economy but increased inequality and eroded public trust.
Monetary policy won't help. Even monetary policy enthusiasts recognize an 18-month lag between action and result. That suggests monetary tightening is unnecessary. Like the medieval bloodletter, central bankers whose interest rate hikes don't work swiftly may do more of the same, bringing the economy to its knees.
Interest rates must rise. Zero-percent interest fueled foolish speculation and financialization. Increasing rates will stop this. Increasing interest rates will destroy the economy and dampen inflation.
Then what? All recent evidence indicate to inflation decreasing on its own, as the authors argue. Supply side difficulties are finally being overcome, evidence shows. Energy and food prices are showing considerable mean reversion, which is disinflationary.
The authors don't recommend doing nothing. Best case scenario, they argue, is that the Fed won't keep raising interest rates until morale improves.