


More on Entrepreneurship/Creators

Carter Kilmann
3 years ago
I finally achieved a $100K freelance income. Here's what I wish I knew.

We love round numbers, don't we? $100,000 is a frequent freelancing milestone. You feel like six figures means you're doing something properly.
You've most likely already conquered initial freelancing challenges like finding clients, setting fair pricing, coping with criticism, getting through dry spells, managing funds, etc.
You think I must be doing well. Last month, my freelance income topped $100,000.
That may not sound impressive considering I've been freelancing for 2.75 years, but I made 30% of that in the previous four months, which is crazy.
Here are the things I wish I'd known during the early days of self-employment that would have helped me hit $100,000 faster.
1. The Volatility of Freelancing Will Stabilize.
Freelancing is risky. No surprise.
Here's an example.
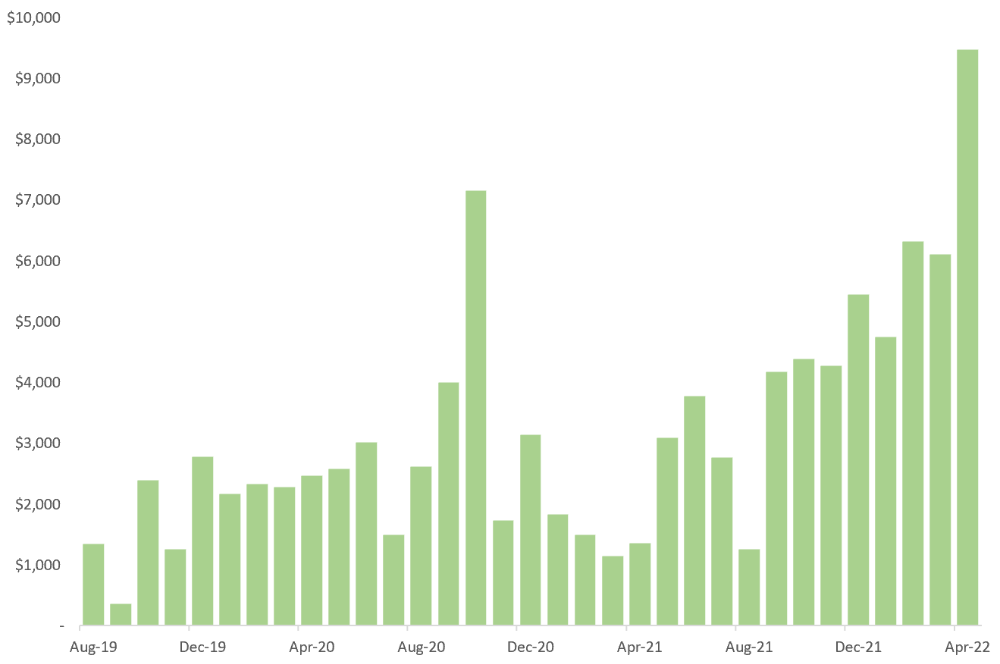
October 2020 was my best month, earning $7,150. Between $4,004 in September and $1,730 in November. Unsteady.
Freelancing is regrettably like that. Moving clients. Content requirements change. Allocating so much time to personal pursuits wasn't smart, but yet.
Stabilizing income takes time. Consider my rolling three-month average income since I started freelancing. My three-month average monthly income. In February, this metric topped $5,000. Now, it's in the mid-$7,000s, but it took a while to get there.
Finding freelance gigs that provide high pay, high volume, and recurring revenue is difficult. But it's not impossible.
TLDR: Don't expect a steady income increase at first. Be patient.
2. You Have More Value Than You Realize.
Writing is difficult. Assembling words, communicating a message, and provoking action are a puzzle.
People are willing to pay you for it because they can't do what you do or don't have enough time.
Keeping that in mind can have huge commercial repercussions.
When talking to clients, don't tiptoe. You can ignore ridiculous deadlines. You don't have to take unmanageable work.
You solve an issue, so make sure you get rightly paid.
TLDR: Frame services as problem-solutions. This will let you charge more and set boundaries.
3. Increase Your Prices.
I studied hard before freelancing. I read articles and watched videos about writing businesses.
I didn't want to work for pennies. Despite this clarity, I had no real strategy to raise my rates.
I then luckily stumbled into higher-paying work. We discussed fees and hours with a friend who launched a consulting business. It's subjective and speculative because value isn't standardized. One company may laugh at your charges. If your solution helps them create a solid ROI, another client may pay $200 per hour.
When he told me he charged his first client $125 per hour, I thought, Why not?
A new-ish client wanted to discuss a huge forthcoming project, so I raised my rates. They knew my worth, so they didn't blink when I handed them my new number.
TLDR: Increase rates periodically (e.g., every 6 or 12 months). Writing skill develops with practice. You'll gain value over time.
4. Remember Your Limits.
If you can squeeze additional time into a day, let me know. I can't manipulate time yet.
We all have time and economic limits. You could theoretically keep boosting rates, but your prospect pool diminishes. Outsourcing and establishing extra revenue sources might boost monthly revenues.
I've devoted a lot of time to side projects (hopefully extra cash sources), but I've only just started outsourcing. I wish I'd tried this earlier.
If you can discover good freelancers, you can grow your firm without sacrificing time.
TLDR: Expand your writing network immediately. You'll meet freelancers who understand your daily grind and locate reference sources.
5. Every Action You Take Involves an Investment. Be Certain to Select Correctly.
Investing in stocks or crypto requires paying money, right?
In business, time is your currency (and maybe money too). Your daily habits define your future. If you spend time collecting software customers and compiling content in the space, you'll end up with both. So be sure.
I only spend around 50% of my time on client work, therefore it's taken me nearly three years to earn $100,000. I spend the remainder of my time on personal projects including a freelance book, an investment newsletter, and this blog.
Why? I don't want to rely on client work forever. So, I'm working on projects that could pay off later and help me live a more fulfilling life.
TLDR: Consider the long-term impact of your time commitments, and don't overextend. You can only make so many "investments" in a given time.
6. LinkedIn Is an Endless Mine of Gold. Use It.
Why didn't I use LinkedIn earlier?
I designed a LinkedIn inbound lead strategy that generates 12 leads a month and a few high-quality offers. As a result, I've turned down good gigs. Wish I'd begun earlier.
If you want to create a freelance business, prioritize LinkedIn. Too many freelancers ignore this site, missing out on high-paying clients. Build your profile, post often, and interact.
TLDR: Study LinkedIn's top creators. Once you understand their audiences, start posting and participating daily.
For 99% of People, Freelancing is Not a Get-Rich-Quick Scheme.
Here's a list of things I wish I'd known when I started freelancing.
Although it is erratic, freelancing eventually becomes stable.
You deserve respect and discretion over how you conduct business because you have solved an issue.
Increase your charges rather than undervaluing yourself. If necessary, add a reminder to your calendar. Your worth grows with time.
In order to grow your firm, outsource jobs. After that, you can work on the things that are most important to you.
Take into account how your present time commitments may affect the future. It will assist in putting things into perspective and determining whether what you are doing is indeed worthwhile.
Participate on LinkedIn. You'll get better jobs as a result.
If I could give my old self (and other freelancers) one bit of advice, it's this:
Despite appearances, you're making progress.
Each job. Tweets. Newsletters. Progress. It's simpler to see retroactively than in the moment.
Consistent, intentional work pays off. No good comes from doing nothing. You must set goals, divide them into time-based targets, and then optimize your calendar.
Then you'll understand you're doing well.
Want to learn more? I’ll teach you.

Victoria Kurichenko
3 years ago
Here's what happened after I launched my second product on Gumroad.
One-hour ebook sales, affiliate relationships, and more.

If you follow me, you may know I started a new ebook in August 2022.
Despite publishing on this platform, my website, and Quora, I'm not a writer.
My writing speed is slow, 2,000 words a day, and I struggle to communicate cohesively.
In April 2022, I wrote a successful guide on How to Write Google-Friendly Blog Posts.
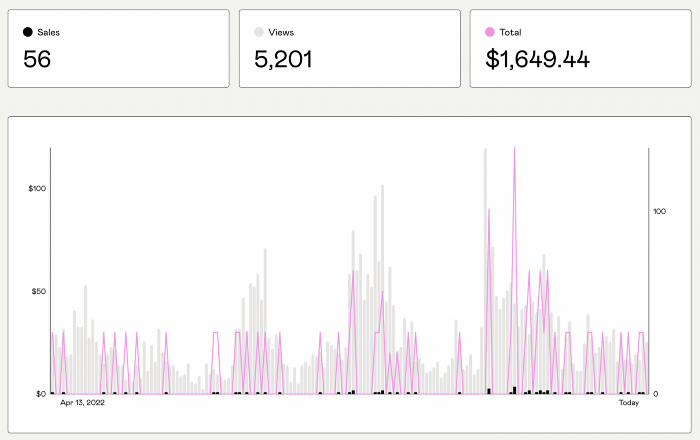
I had no email list or social media presence. I've made $1,600+ selling ebooks.
Evidence:
My first digital offering isn't a book.
It's an actionable guide with my tried-and-true process for writing Google-friendly content.
I'm not bragging.
Established authors like Tim Denning make more from my ebook sales with one newsletter.
This experience taught me writing isn't a privilege.
Writing a book and making money online doesn't require expertise.
Many don't consult experts. They want someone approachable.
Two years passed before I realized my own limits.
I have a brain, two hands, and Internet to spread my message.
I wrote and published a second ebook after the first's success.
On Gumroad, I released my second digital product.
Here's my complete Gumroad evaluation.
Gumroad is a marketplace for content providers to develop and sell sales pages.
Gumroad handles payments and client requests. It's helpful when someone sends a bogus payment receipt requesting an ebook (actual story!).
You'll forget administrative concerns after your first ebook sale.
After my first ebook sale, I did this: I made additional cash!
After every sale, I tell myself, "I built a new semi-passive revenue source."
This thinking shift helps me become less busy while increasing my income and quality of life.
Besides helping others, folks sell evergreen digital things to earn passive money.
It's in my second ebook.
I explain how I built and sold 50+ copies of my SEO writing ebook without being an influencer.
I show how anyone can sell ebooks on Gumroad and automate their sales process.
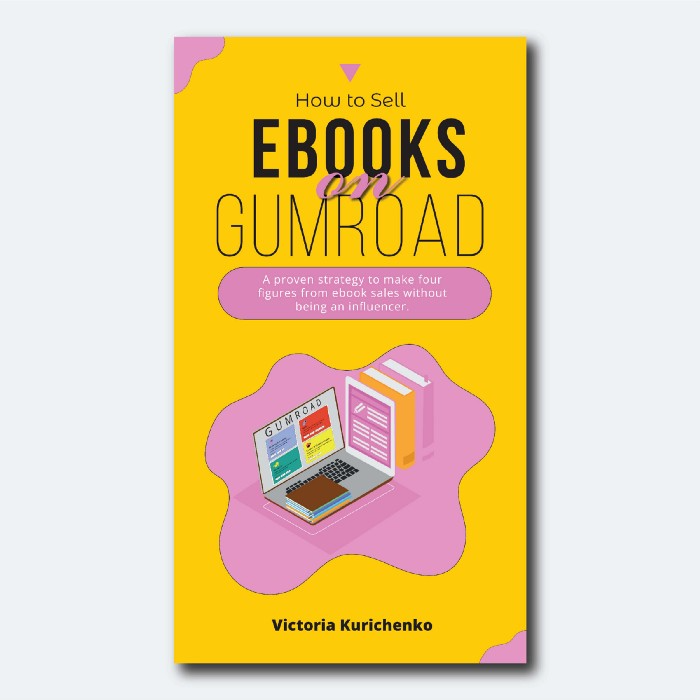
This is my ebook.
After publicizing the ebook release, I sold three copies within an hour.
Wow, or meh?
I don’t know.
The answer is different for everyone.
These three sales came from a small email list of 40 motivated fans waiting for my ebook release.
I had bigger plans.
I'll market my ebook on Medium, my website, Quora, and email.
I'm testing affiliate partnerships this time.
One of my ebook buyers is now promoting it for 40% commission.
Become my affiliate if you think your readers would like my ebook.
My ebook is a few days old, but I'm interested to see where it goes.
My SEO writing book started without an email list, affiliates, or 4,000 website visitors. I've made four figures.
I'm slowly expanding my communication avenues to have more impact.
Even a small project can open doors you never knew existed.
So began my writing career.
In summary
If you dare, every concept can become a profitable trip.
Before, I couldn't conceive of creating an ebook.
How to Sell eBooks on Gumroad is my second digital product.
Marketing and writing taught me that anything can be sold online.

cdixon
3 years ago
2000s Toys, Secrets, and Cycles
During the dot-com bust, I started my internet career. People used the internet intermittently to check email, plan travel, and do research. The average internet user spent 30 minutes online a day, compared to 7 today. To use the internet, you had to "log on" (most people still used dial-up), unlike today's always-on, high-speed mobile internet. In 2001, Amazon's market cap was $2.2B, 1/500th of what it is today. A study asked Americans if they'd adopt broadband, and most said no. They didn't see a need to speed up email, the most popular internet use. The National Academy of Sciences ranked the internet 13th among the 100 greatest inventions, below radio and phones. The internet was a cool invention, but it had limited uses and wasn't a good place to build a business.
A small but growing movement of developers and founders believed the internet could be more than a read-only medium, allowing anyone to create and publish. This is web 2. The runner up name was read-write web. (These terms were used in prominent publications and conferences.)
Web 2 concepts included letting users publish whatever they want ("user generated content" was a buzzword), social graphs, APIs and mashups (what we call composability today), and tagging over hierarchical navigation. Technical innovations occurred. A seemingly simple but important one was dynamically updating web pages without reloading. This is now how people expect web apps to work. Mobile devices that could access the web were niche (I was an avid Sidekick user).
The contrast between what smart founders and engineers discussed over dinner and on weekends and what the mainstream tech world took seriously during the week was striking. Enterprise security appliances, essentially preloaded servers with security software, were a popular trend. Many of the same people would talk about "serious" products at work, then talk about consumer internet products and web 2. It was tech's biggest news. Web 2 products were seen as toys, not real businesses. They were hobbies, not work-related.
There's a strong correlation between rich product design spaces and what smart people find interesting, which took me some time to learn and led to blog posts like "The next big thing will start out looking like a toy" Web 2's novel product design possibilities sparked dinner and weekend conversations. Imagine combining these features. What if you used this pattern elsewhere? What new product ideas are next? This excited people. "Serious stuff" like security appliances seemed more limited.
The small and passionate web 2 community also stood out. I attended the first New York Tech meetup in 2004. Everyone fit in Meetup's small conference room. Late at night, people demoed their software and chatted. I have old friends. Sometimes I get asked how I first met old friends like Fred Wilson and Alexis Ohanian. These topics didn't interest many people, especially on the east coast. We were friends. Real community. Alex Rampell, who now works with me at a16z, is someone I met in 2003 when a friend said, "Hey, I met someone else interested in consumer internet." Rare. People were focused and enthusiastic. Revolution seemed imminent. We knew a secret nobody else did.
My web 2 startup was called SiteAdvisor. When my co-founders and I started developing the idea in 2003, web security was out of control. Phishing and spyware were common on Internet Explorer PCs. SiteAdvisor was designed to warn users about security threats like phishing and spyware, and then, using web 2 concepts like user-generated reviews, add more subjective judgments (similar to what TrustPilot seems to do today). This staged approach was common at the time; I called it "Come for the tool, stay for the network." We built APIs, encouraged mashups, and did SEO marketing.
Yahoo's 2005 acquisitions of Flickr and Delicious boosted web 2 in 2005. By today's standards, the amounts were small, around $30M each, but it was a signal. Web 2 was assumed to be a fun hobby, a way to build cool stuff, but not a business. Yahoo was a savvy company that said it would make web 2 a priority.
As I recall, that's when web 2 started becoming mainstream tech. Early web 2 founders transitioned successfully. Other entrepreneurs built on the early enthusiasts' work. Competition shifted from ideation to execution. You had to decide if you wanted to be an idealistic indie bar band or a pragmatic stadium band.
Web 2 was booming in 2007 Facebook passed 10M users, Twitter grew and got VC funding, and Google bought YouTube. The 2008 financial crisis tested entrepreneurs' resolve. Smart people predicted another great depression as tech funding dried up.
Many people struggled during the recession. 2008-2011 was a golden age for startups. By 2009, talented founders were flooding Apple's iPhone app store. Mobile apps were booming. Uber, Venmo, Snap, and Instagram were all founded between 2009 and 2011. Social media (which had replaced web 2), cloud computing (which enabled apps to scale server side), and smartphones converged. Even if social, cloud, and mobile improve linearly, the combination could improve exponentially.
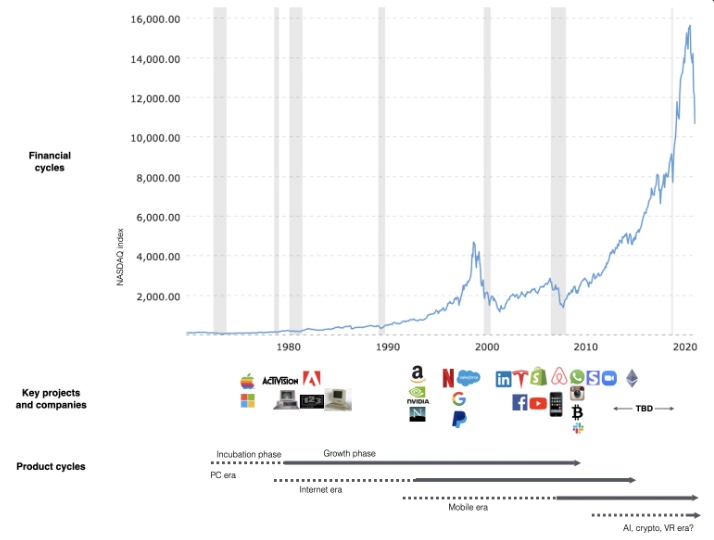
This chart shows how I view product and financial cycles. Product and financial cycles evolve separately. The Nasdaq index is a proxy for the financial sentiment. Financial sentiment wildly fluctuates.
Next row shows iconic startup or product years. Bottom-row product cycles dictate timing. Product cycles are more predictable than financial cycles because they follow internal logic. In the incubation phase, enthusiasts build products for other enthusiasts on nights and weekends. When the right mix of technology, talent, and community knowledge arrives, products go mainstream. (I show the biggest tech cycles in the chart, but smaller ones happen, like web 2 in the 2000s and fintech and SaaS in the 2010s.)
Tech has changed since the 2000s. Few tech giants dominate the internet, exerting economic and cultural influence. In the 2000s, web 2 was ignored or dismissed as trivial. Entrenched interests respond aggressively to new movements that could threaten them. Creative patterns from the 2000s continue today, driven by enthusiasts who see possibilities where others don't. Know where to look. Crypto and web 3 are where I'd start.
Today's negative financial sentiment reminds me of 2008. If we face a prolonged downturn, we can learn from 2008 by preserving capital and focusing on the long term. Keep an eye on the product cycle. Smart people are interested in things with product potential. This becomes true. Toys become necessities. Hobbies become mainstream. Optimists build the future, not cynics.
Full article is available here
You might also like

Tim Denning
3 years ago
I Posted Six Times a Day for 210 Days on Twitter. Here's What Happened.
I'd spend hours composing articles only to find out they were useless. Twitter solved the problem.

Twitter is wrinkled, say critics.
Nope. Writing is different. It won't make sense until you write there.
Twitter is resurgent. People are reading again. 15-second TikToks overloaded our senses.
After nuking my 20,000-follower Twitter account and starting again, I wrote every day for 210 days.
I'll explain.
I came across the strange world of microblogging.
Traditional web writing is filler-heavy.
On Twitter, you must be brief. I played Wordle.
Twitter Threads are the most popular writing format. Like a blog post. It reminds me of the famous broetry posts on LinkedIn a few years ago.
Threads combine tweets into an article.
Sharp, concise sentences
No regard for grammar
As important as the information is how the text looks.
Twitter Threads are like Michael Angelo's David monument. He chipped away at an enormous piece of marble until a man with a big willy appeared.
That's Twitter Threads.
I tried to remove unnecessary layers from several of my Wordpress blog posts. Then I realized something.
Tweeting from scratch is easier and more entertaining. It's quicker and makes you think more concisely.
Superpower: saying much with little words. My long-form writing has improved. My article sentences resemble tweets.
You never know what will happen.
Twitter's subcultures are odd. Best-performing tweets are strange.
Unusual trend: working alone and without telling anyone. It's a rebellion against Instagram influencers who share their every moment.
Early on, random thoughts worked:
My friend’s wife is Ukrainian. Her family are trapped in the warzone. He is devastated. And here I was complaining about my broken garage door. War puts everything in perspective. Today is a day to be grateful for peace.
Documenting what's happening triggers writing. It's not about viral tweets. Helping others matters.
There are numerous anonymous users.
Twitter uses pseudonyms.
You don't matter. On sites like LinkedIn, you must use your real name. Welcome to the Cyberpunk metaverse of Twitter :)
One daily piece of writing is a powerful habit.
Habits build creator careers. Read that again.
Twitter is an easy habit to pick up. If you can't tweet in one sentence, something's wrong. Easy-peasy-japanese.
Not what I tweeted, but my constancy, made the difference.
Daily writing is challenging, especially if your supervisor is on your back. Twitter encourages writing.
Tweets evolved as the foundation of all other material.
During my experiment, I enjoyed Twitter's speed.
Tweets get immediate responses, comments, and feedback. My popular tweets become newspaper headlines. I've also written essays from tweet discussions.
Sometimes the tweet and article were clear. Twitter sometimes helped me overcome writer's block.
I used to spend hours composing big things that had little real-world use.
Twitter helped me. No guessing. Data guides my coverage and validates concepts.
Test ideas on Twitter.
It took some time for my email list to grow.
Subscribers are a writer's lifeblood.
Without them, you're broke and homeless when Mark Zuckerberg tweaks the algorithms for ad dollars. Twitter has three ways to obtain email subscribers:
1. Add a link to your bio.
Twitter allows bio links (LinkedIn now does too). My eBook's landing page is linked. I collect emails there.
2. Start an online newsletter.
Twitter bought newsletter app Revue. They promote what they own.
I just established up a Revue email newsletter. I imported them weekly into my ConvertKit email list.
3. Create Twitter threads and include a link to your email list in the final tweet.
Write Twitter Threads and link the last tweet to your email list (example below).
Initial email subscribers were modest.
Numbers are growing. Twitter provides 25% of my new email subscribers. Some days, 50 people join.
Without them, my writing career is over. I'd be back at a 9-5 job begging for time off to spend with my newborn daughter. Nope.
Collect email addresses or die trying.
As insurance against unsubscribes and Zucks, use a second email list or Discord community.
What I still need to do
Twitter's fun. I'm wiser. I need to enable auto-replies and auto-DMs (direct messages).
This adds another way to attract subscribers. I schedule tweets with Tweet Hunter.
It’s best to go slow. People assume you're an internet marketer if you spam them with click requests.
A human internet marketer is preferable to a robot. My opinion.
210 days on Twitter taught me that. I plan to use the platform until I'm a grandfather unless Elon ruins it.

Ray Dalio
3 years ago
The latest “bubble indicator” readings.
As you know, I like to turn my intuition into decision rules (principles) that can be back-tested and automated to create a portfolio of alpha bets. I use one for bubbles. Having seen many bubbles in my 50+ years of investing, I described what makes a bubble and how to identify them in markets—not just stocks.
A bubble market has a high degree of the following:
- High prices compared to traditional values (e.g., by taking the present value of their cash flows for the duration of the asset and comparing it with their interest rates).
- Conditons incompatible with long-term growth (e.g., extrapolating past revenue and earnings growth rates late in the cycle).
- Many new and inexperienced buyers were drawn in by the perceived hot market.
- Broad bullish sentiment.
- Debt financing a large portion of purchases.
- Lots of forward and speculative purchases to profit from price rises (e.g., inventories that are more than needed, contracted forward purchases, etc.).
I use these criteria to assess all markets for bubbles. I have periodically shown you these for stocks and the stock market.
What Was Shown in January Versus Now
I will first describe the picture in words, then show it in charts, and compare it to the last update in January.
As of January, the bubble indicator showed that a) the US equity market was in a moderate bubble, but not an extreme one (ie., 70 percent of way toward the highest bubble, which occurred in the late 1990s and late 1920s), and b) the emerging tech companies (ie. As well, the unprecedented flood of liquidity post-COVID financed other bubbly behavior (e.g. SPACs, IPO boom, big pickup in options activity), making things bubbly. I showed which stocks were in bubbles and created an index of those stocks, which I call “bubble stocks.”
Those bubble stocks have popped. They fell by a third last year, while the S&P 500 remained flat. In light of these and other market developments, it is not necessarily true that now is a good time to buy emerging tech stocks.
The fact that they aren't at a bubble extreme doesn't mean they are safe or that it's a good time to get long. Our metrics still show that US stocks are overvalued. Once popped, bubbles tend to overcorrect to the downside rather than settle at “normal” prices.
The following charts paint the picture. The first shows the US equity market bubble gauge/indicator going back to 1900, currently at the 40% percentile. The charts also zoom in on the gauge in recent years, as well as the late 1920s and late 1990s bubbles (during both of these cases the gauge reached 100 percent ).
The chart below depicts the average bubble gauge for the most bubbly companies in 2020. Those readings are down significantly.
The charts below compare the performance of a basket of emerging tech bubble stocks to the S&P 500. Prices have fallen noticeably, giving up most of their post-COVID gains.
The following charts show the price action of the bubble slice today and in the 1920s and 1990s. These charts show the same market dynamics and two key indicators. These are just two examples of how a lot of debt financing stock ownership coupled with a tightening typically leads to a bubble popping.
Everything driving the bubbles in this market segment is classic—the same drivers that drove the 1920s bubble and the 1990s bubble. For instance, in the last couple months, it was how tightening can act to prick the bubble. Review this case study of the 1920s stock bubble (starting on page 49) from my book Principles for Navigating Big Debt Crises to grasp these dynamics.
The following charts show the components of the US stock market bubble gauge. Since this is a proprietary indicator, I will only show you some of the sub-aggregate readings and some indicators.
Each of these six influences is measured using a number of stats. This is how I approach the stock market. These gauges are combined into aggregate indices by security and then for the market as a whole. The table below shows the current readings of these US equity market indicators. It compares current conditions for US equities to historical conditions. These readings suggest that we’re out of a bubble.
1. How High Are Prices Relatively?
This price gauge for US equities is currently around the 50th percentile.
2. Is price reduction unsustainable?
This measure calculates the earnings growth rate required to outperform bonds. This is calculated by adding up the readings of individual securities. This indicator is currently near the 60th percentile for the overall market, higher than some of our other readings. Profit growth discounted in stocks remains high.
Even more so in the US software sector. Analysts' earnings growth expectations for this sector have slowed, but remain high historically. P/Es have reversed COVID gains but remain high historical.
3. How many new buyers (i.e., non-existing buyers) entered the market?
Expansion of new entrants is often indicative of a bubble. According to historical accounts, this was true in the 1990s equity bubble and the 1929 bubble (though our data for this and other gauges doesn't go back that far). A flood of new retail investors into popular stocks, which by other measures appeared to be in a bubble, pushed this gauge above the 90% mark in 2020. The pace of retail activity in the markets has recently slowed to pre-COVID levels.
4. How Broadly Bullish Is Sentiment?
The more people who have invested, the less resources they have to keep investing, and the more likely they are to sell. Market sentiment is now significantly negative.
5. Are Purchases Being Financed by High Leverage?
Leveraged purchases weaken the buying foundation and expose it to forced selling in a downturn. The leverage gauge, which considers option positions as a form of leverage, is now around the 50% mark.
6. To What Extent Have Buyers Made Exceptionally Extended Forward Purchases?
Looking at future purchases can help assess whether expectations have become overly optimistic. This indicator is particularly useful in commodity and real estate markets, where forward purchases are most obvious. In the equity markets, I look at indicators like capital expenditure, or how much businesses (and governments) invest in infrastructure, factories, etc. It reflects whether businesses are projecting future demand growth. Like other gauges, this one is at the 40th percentile.
What one does with it is a tactical choice. While the reversal has been significant, future earnings discounting remains high historically. In either case, bubbles tend to overcorrect (sell off more than the fundamentals suggest) rather than simply deflate. But I wanted to share these updated readings with you in light of recent market activity.

Jayden Levitt
3 years ago
How to Explain NFTs to Your Grandmother, in Simple Terms

In simple terms, you probably don’t.
But try. Grandma didn't grow up with Facebook, but she eventually joined.
Perhaps the fear of being isolated outweighed the discomfort of learning the technology.
Grandmas are Facebook likers, sharers, and commenters.
There’s no stopping her.
Not even NFTs. Web3 is currently very complex.
It's difficult to explain what NFTs are, how they work, and why we might use them.
Three explanations.
1. Everything will be ours to own, both physically and digitally.
Why own something you can't touch? What's the point?
Blockchain technology proves digital ownership.
Untouchables need ownership proof. What?
Digital assets reduce friction, save time, and are better for the environment than physical goods.
Many valuable things are intangible. Feeling like your favorite brands. You'll pay obscene prices for clothing that costs pennies.
Secondly, NFTs Are Contracts. Agreements Have Value.
Blockchain technology will replace all contracts and intermediaries.
Every insurance contract, deed, marriage certificate, work contract, plane ticket, concert ticket, or sports event is likely an NFT.
We all have public wallets, like Grandma's Facebook page.
3. Your NFT Purchases Will Be Visible To Everyone.
Everyone can see your public wallet. What you buy says more about you than what you post online.
NFTs issued double as marketing collateral when seen on social media.
While I doubt Grandma knows who Snoop Dog is, imagine him or another famous person holding your NFT in his public wallet and the attention that could bring to you, your company, or brand.
This Technical Section Is For You
The NFT is a contract; its founders can add value through access, events, tuition, and possibly royalties.
Imagine Elon Musk releasing an NFT to his network. Or yearly business consultations for three years.
Christ-alive.
It's worth millions.
These determine their value.
No unsuspecting schmuck willing to buy your hot potato at zero. That's the trend, though.
Overpriced NFTs for low-effort projects created a bubble that has burst.
During a market bubble, you can make money by buying overvalued assets and selling them later for a profit, according to the Greater Fool Theory.
People are struggling. Some are ruined by collateralized loans and the gold rush.
Finances are ruined.
It's uncomfortable.
The same happened in 2018, during the ICO crash or in 1999/2000 when the dot com bubble burst. But the underlying technology hasn’t gone away.