


More on Entrepreneurship/Creators

Carter Kilmann
3 years ago
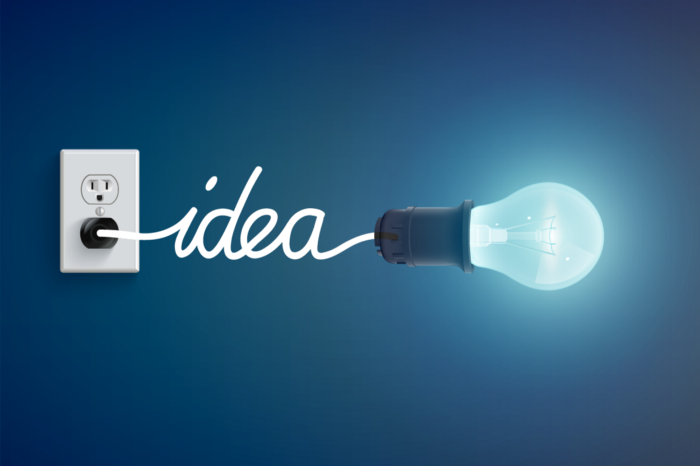
I finally achieved a $100K freelance income. Here's what I wish I knew.

We love round numbers, don't we? $100,000 is a frequent freelancing milestone. You feel like six figures means you're doing something properly.
You've most likely already conquered initial freelancing challenges like finding clients, setting fair pricing, coping with criticism, getting through dry spells, managing funds, etc.
You think I must be doing well. Last month, my freelance income topped $100,000.
That may not sound impressive considering I've been freelancing for 2.75 years, but I made 30% of that in the previous four months, which is crazy.
Here are the things I wish I'd known during the early days of self-employment that would have helped me hit $100,000 faster.
1. The Volatility of Freelancing Will Stabilize.
Freelancing is risky. No surprise.
Here's an example.
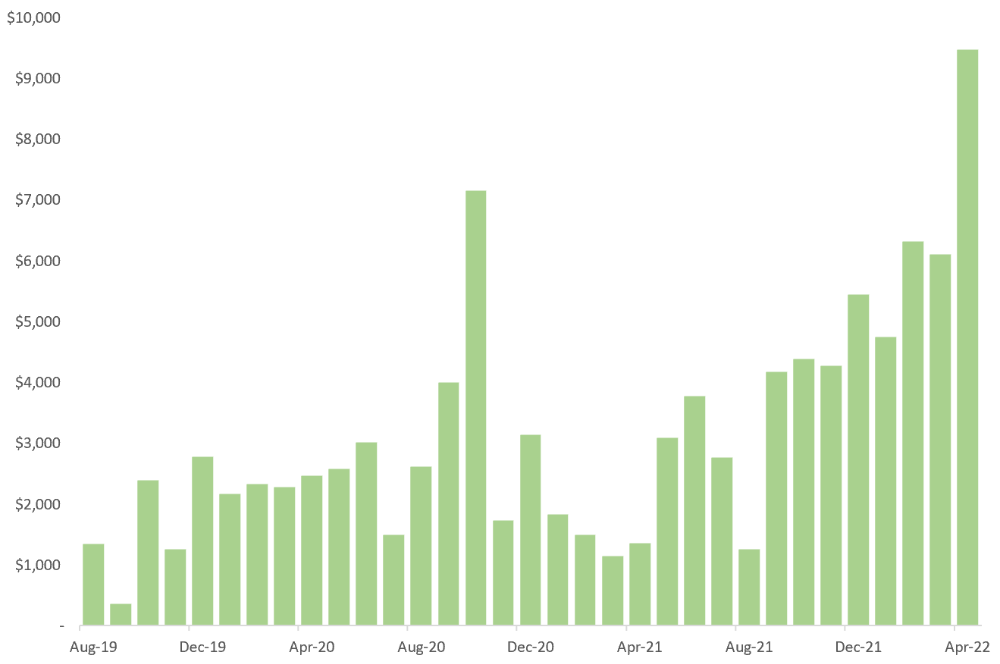
October 2020 was my best month, earning $7,150. Between $4,004 in September and $1,730 in November. Unsteady.
Freelancing is regrettably like that. Moving clients. Content requirements change. Allocating so much time to personal pursuits wasn't smart, but yet.
Stabilizing income takes time. Consider my rolling three-month average income since I started freelancing. My three-month average monthly income. In February, this metric topped $5,000. Now, it's in the mid-$7,000s, but it took a while to get there.
Finding freelance gigs that provide high pay, high volume, and recurring revenue is difficult. But it's not impossible.
TLDR: Don't expect a steady income increase at first. Be patient.
2. You Have More Value Than You Realize.
Writing is difficult. Assembling words, communicating a message, and provoking action are a puzzle.
People are willing to pay you for it because they can't do what you do or don't have enough time.
Keeping that in mind can have huge commercial repercussions.
When talking to clients, don't tiptoe. You can ignore ridiculous deadlines. You don't have to take unmanageable work.
You solve an issue, so make sure you get rightly paid.
TLDR: Frame services as problem-solutions. This will let you charge more and set boundaries.
3. Increase Your Prices.
I studied hard before freelancing. I read articles and watched videos about writing businesses.
I didn't want to work for pennies. Despite this clarity, I had no real strategy to raise my rates.
I then luckily stumbled into higher-paying work. We discussed fees and hours with a friend who launched a consulting business. It's subjective and speculative because value isn't standardized. One company may laugh at your charges. If your solution helps them create a solid ROI, another client may pay $200 per hour.
When he told me he charged his first client $125 per hour, I thought, Why not?
A new-ish client wanted to discuss a huge forthcoming project, so I raised my rates. They knew my worth, so they didn't blink when I handed them my new number.
TLDR: Increase rates periodically (e.g., every 6 or 12 months). Writing skill develops with practice. You'll gain value over time.
4. Remember Your Limits.
If you can squeeze additional time into a day, let me know. I can't manipulate time yet.
We all have time and economic limits. You could theoretically keep boosting rates, but your prospect pool diminishes. Outsourcing and establishing extra revenue sources might boost monthly revenues.
I've devoted a lot of time to side projects (hopefully extra cash sources), but I've only just started outsourcing. I wish I'd tried this earlier.
If you can discover good freelancers, you can grow your firm without sacrificing time.
TLDR: Expand your writing network immediately. You'll meet freelancers who understand your daily grind and locate reference sources.
5. Every Action You Take Involves an Investment. Be Certain to Select Correctly.
Investing in stocks or crypto requires paying money, right?
In business, time is your currency (and maybe money too). Your daily habits define your future. If you spend time collecting software customers and compiling content in the space, you'll end up with both. So be sure.
I only spend around 50% of my time on client work, therefore it's taken me nearly three years to earn $100,000. I spend the remainder of my time on personal projects including a freelance book, an investment newsletter, and this blog.
Why? I don't want to rely on client work forever. So, I'm working on projects that could pay off later and help me live a more fulfilling life.
TLDR: Consider the long-term impact of your time commitments, and don't overextend. You can only make so many "investments" in a given time.
6. LinkedIn Is an Endless Mine of Gold. Use It.
Why didn't I use LinkedIn earlier?
I designed a LinkedIn inbound lead strategy that generates 12 leads a month and a few high-quality offers. As a result, I've turned down good gigs. Wish I'd begun earlier.
If you want to create a freelance business, prioritize LinkedIn. Too many freelancers ignore this site, missing out on high-paying clients. Build your profile, post often, and interact.
TLDR: Study LinkedIn's top creators. Once you understand their audiences, start posting and participating daily.
For 99% of People, Freelancing is Not a Get-Rich-Quick Scheme.
Here's a list of things I wish I'd known when I started freelancing.
Although it is erratic, freelancing eventually becomes stable.
You deserve respect and discretion over how you conduct business because you have solved an issue.
Increase your charges rather than undervaluing yourself. If necessary, add a reminder to your calendar. Your worth grows with time.
In order to grow your firm, outsource jobs. After that, you can work on the things that are most important to you.
Take into account how your present time commitments may affect the future. It will assist in putting things into perspective and determining whether what you are doing is indeed worthwhile.
Participate on LinkedIn. You'll get better jobs as a result.
If I could give my old self (and other freelancers) one bit of advice, it's this:
Despite appearances, you're making progress.
Each job. Tweets. Newsletters. Progress. It's simpler to see retroactively than in the moment.
Consistent, intentional work pays off. No good comes from doing nothing. You must set goals, divide them into time-based targets, and then optimize your calendar.
Then you'll understand you're doing well.
Want to learn more? I’ll teach you.

Aaron Dinin, PhD
2 years ago
Are You Unintentionally Creating the Second Difficult Startup Type?
Most don't understand the issue until it's too late.
My first startup was what entrepreneurs call the hardest. A two-sided marketplace.
Two-sided marketplaces are the hardest startups because founders must solve the chicken or the egg conundrum.
A two-sided marketplace needs suppliers and buyers. Without suppliers, buyers won't come. Without buyers, suppliers won't come. An empty marketplace and a founder striving to gain momentum result.
My first venture made me a struggling founder seeking to achieve traction for a two-sided marketplace. The company failed, and I vowed never to start another like it.
I didn’t. Unfortunately, my second venture was almost as hard. It failed like the second-hardest startup.
What kind of startup is the second-hardest?
The second-hardest startup, which is almost as hard to develop, is rarely discussed in the startup community. Because of this, I predict more founders fail each year trying to develop the second-toughest startup than the hardest.
Fairly, I have no proof. I see many startups, so I have enough of firsthand experience. From what I've seen, for every entrepreneur developing a two-sided marketplace, I'll meet at least 10 building this other challenging startup.
I'll describe a startup I just met with its two co-founders to explain the second hardest sort of startup and why it's so hard. They created a financial literacy software for parents of high schoolers.
The issue appears plausible. Children struggle with money. Parents must teach financial responsibility. Problems?
It's possible.
Buyers and users are different.
Buyer-user mismatch.
The financial literacy app I described above targets parents. The parent doesn't utilize the app. Child is end-user. That may not seem like much, but it makes customer and user acquisition and onboarding difficult for founders.
The difficulty of a buyer-user imbalance
The company developing a product faces a substantial operational burden when the buyer and end customer are different. Consider classic firms where the buyer is the end user to appreciate that responsibility.
Entrepreneurs selling directly to end users must educate them about the product's benefits and use. Each demands a lot of time, effort, and resources.
Imagine selling a financial literacy app where the buyer and user are different. To make the first sale, the entrepreneur must establish all the items I mentioned above. After selling, the entrepreneur must supply a fresh set of resources to teach, educate, or train end-users.
Thus, a startup with a buyer-user mismatch must market, sell, and train two organizations at once, requiring twice the work with the same resources.
The second hardest startup is hard for reasons other than the chicken-or-the-egg conundrum. It takes a lot of creativity and luck to solve the chicken-or-egg conundrum.
The buyer-user mismatch problem cannot be overcome by innovation or luck. Buyer-user mismatches must be solved by force. Simply said, when a product buyer is different from an end-user, founders have a lot more work. If they can't work extra, their companies fail.

Athirah Syamimi
3 years ago
Here's How I Built A Business Offering Unlimited Design Services in Just One Weekend.
Weekend project: limitless design service. It was fun to see whether I could start a business quickly.
I use no-code apps to save time and resources.
TL;DR I started a business utilizing EditorX for my website, Notion for client project management, and a few favors to finish my portfolio.
First step: research (Day 1)
I got this concept from a Kimp Instagram ad. The Minimalist Hustler Daily newsletter mentioned a similar and cheaper service (Graphically).
I Googled other unlimited design companies. Many provide different costs and services. Some supplied solely graphic design, web development, or copywriting.
Step 2: Brainstorming (Day 1)
I did something simple.
What benefits and services to provide
Price to charge
Since it's a one-person performance (for now), I'm focusing on graphic design. I can charge less.
So I don't overwhelm myself and can accommodate budget-conscious clientele.
Step 3: Construction (Day 1 & 2)
This project includes a management tool, a website, and a team procedure.
I built a project management tool and flow first. Once I had the flow and a Notion board, I tested it with design volunteers. They fake-designed while I built the website.
Tool for Project Management
I modified a Notion template. My goal is to keep clients and designers happy.
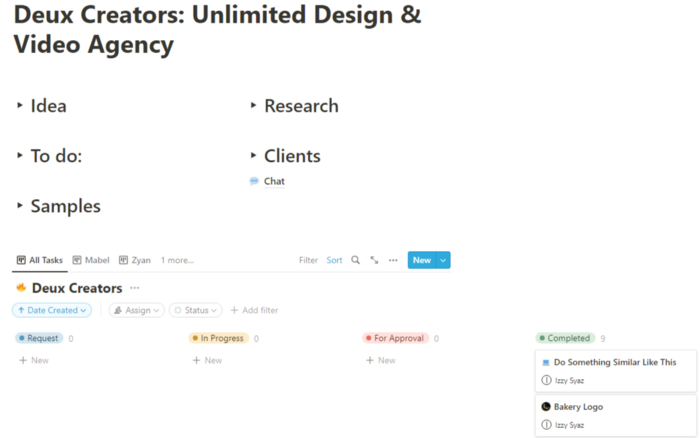
Team Approach
My sister, my partner, and I kept this business lean. I tweaked the Notion board to make the process smooth. By the end of Sunday, I’d say it’s perfect!
Website
I created the website after they finished the fake design demands. EditorX's drag-and-drop builder attracted me. I didn't need to learn code, and there are templates.
I used a template wireframe.
This project's hardest aspect is developing the site. It's my first time using EditorX and I'm no developer.
People answer all your inquiries in a large community forum.
As a first-time user developing a site in two days, I think I performed OK. Here's the site for feedback.

4th step: testing (Day 2)
Testing is frustrating because it works or doesn't. My testing day was split in two.
testing the workflow from payment to onboarding to the website
the demand being tested
It's working so far. If someone gets the trial, they can request design work.
I've gotten a couple of inquiries about demand. I’ll be working with them as a start.
Completion
Finally! I built my side project in one weekend. It's too early to tell if this is successful. I liked that I didn't squander months of resources testing out an idea.
You might also like

Farhan Ali Khan
2 years ago
Introduction to Zero-Knowledge Proofs: The Art of Proving Without Revealing
Zero-Knowledge Proofs for Beginners
Published here originally.
Introduction
I Spy—did you play as a kid? One person chose a room object, and the other had to guess it by answering yes or no questions. I Spy was entertaining, but did you know it could teach you cryptography?
Zero Knowledge Proofs let you show your pal you know what they picked without exposing how. Math replaces electronics in this secret spy mission. Zero-knowledge proofs (ZKPs) are sophisticated cryptographic tools that allow one party to prove they have particular knowledge without revealing it. This proves identification and ownership, secures financial transactions, and more. This article explains zero-knowledge proofs and provides examples to help you comprehend this powerful technology.
What is a Proof of Zero Knowledge?
Zero-knowledge proofs prove a proposition is true without revealing any other information. This lets the prover show the verifier that they know a fact without revealing it. So, a zero-knowledge proof is like a magician's trick: the prover proves they know something without revealing how or what. Complex mathematical procedures create a proof the verifier can verify.
Want to find an easy way to test it out? Try out with tis awesome example! ZK Crush
Describe it as if I'm 5
Alex and Jack found a cave with a center entrance that only opens when someone knows the secret. Alex knows how to open the cave door and wants to show Jack without telling him.
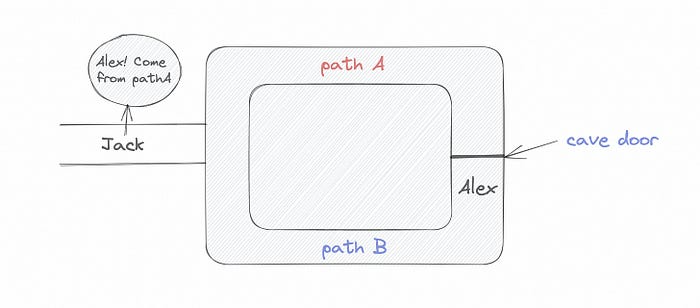
Alex and Jack name both pathways (let’s call them paths A and B).
In the first phase, Alex is already inside the cave and is free to select either path, in this case A or B.
As Alex made his decision, Jack entered the cave and asked him to exit from the B path.
Jack can confirm that Alex really does know the key to open the door because he came out for the B path and used it.
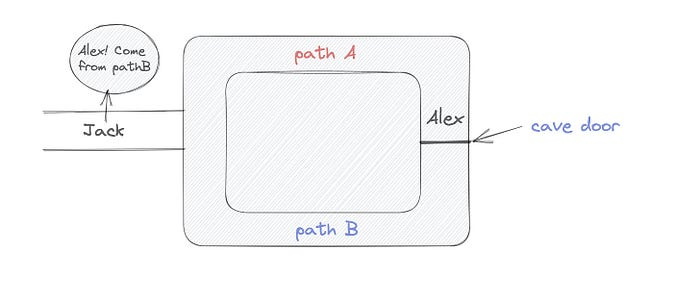
To conclude, Alex and Jack repeat:
Alex walks into the cave.
Alex follows a random route.
Jack walks into the cave.
Alex is asked to follow a random route by Jack.
Alex follows Jack's advice and heads back that way.
What is a Zero Knowledge Proof?
At a high level, the aim is to construct a secure and confidential conversation between the prover and the verifier, where the prover convinces the verifier that they have the requisite information without disclosing it. The prover and verifier exchange messages and calculate in each round of the dialogue.
The prover uses their knowledge to prove they have the information the verifier wants during these rounds. The verifier can verify the prover's truthfulness without learning more by checking the proof's mathematical statement or computation.
Zero knowledge proofs use advanced mathematical procedures and cryptography methods to secure communication. These methods ensure the evidence is authentic while preventing the prover from creating a phony proof or the verifier from extracting unnecessary information.
ZK proofs require examples to grasp. Before the examples, there are some preconditions.
Criteria for Proofs of Zero Knowledge
Completeness: If the proposition being proved is true, then an honest prover will persuade an honest verifier that it is true.
Soundness: If the proposition being proved is untrue, no dishonest prover can persuade a sincere verifier that it is true.
Zero-knowledge: The verifier only realizes that the proposition being proved is true. In other words, the proof only establishes the veracity of the proposition being supported and nothing more.
The zero-knowledge condition is crucial. Zero-knowledge proofs show only the secret's veracity. The verifier shouldn't know the secret's value or other details.
Example after example after example
To illustrate, take a zero-knowledge proof with several examples:
Initial Password Verification Example
You want to confirm you know a password or secret phrase without revealing it.
Use a zero-knowledge proof:
You and the verifier settle on a mathematical conundrum or issue, such as figuring out a big number's components.
The puzzle or problem is then solved using the hidden knowledge that you have learned. You may, for instance, utilize your understanding of the password to determine the components of a particular number.
You provide your answer to the verifier, who can assess its accuracy without knowing anything about your private data.
You go through this process several times with various riddles or issues to persuade the verifier that you actually are aware of the secret knowledge.
You solved the mathematical puzzles or problems, proving to the verifier that you know the hidden information. The proof is zero-knowledge since the verifier only sees puzzle solutions, not the secret information.
In this scenario, the mathematical challenge or problem represents the secret, and solving it proves you know it. The evidence does not expose the secret, and the verifier just learns that you know it.
My simple example meets the zero-knowledge proof conditions:
Completeness: If you actually know the hidden information, you will be able to solve the mathematical puzzles or problems, hence the proof is conclusive.
Soundness: The proof is sound because the verifier can use a publicly known algorithm to confirm that your answer to the mathematical conundrum or difficulty is accurate.
Zero-knowledge: The proof is zero-knowledge because all the verifier learns is that you are aware of the confidential information. Beyond the fact that you are aware of it, the verifier does not learn anything about the secret information itself, such as the password or the factors of the number. As a result, the proof does not provide any new insights into the secret.
Explanation #2: Toss a coin.
One coin is biased to come up heads more often than tails, while the other is fair (i.e., comes up heads and tails with equal probability). You know which coin is which, but you want to show a friend you can tell them apart without telling them.
Use a zero-knowledge proof:
One of the two coins is chosen at random, and you secretly flip it more than once.
You show your pal the following series of coin flips without revealing which coin you actually flipped.
Next, as one of the two coins is flipped in front of you, your friend asks you to tell which one it is.
Then, without revealing which coin is which, you can use your understanding of the secret order of coin flips to determine which coin your friend flipped.
To persuade your friend that you can actually differentiate between the coins, you repeat this process multiple times using various secret coin-flipping sequences.
In this example, the series of coin flips represents the knowledge of biased and fair coins. You can prove you know which coin is which without revealing which is biased or fair by employing a different secret sequence of coin flips for each round.
The evidence is zero-knowledge since your friend does not learn anything about which coin is biased and which is fair other than that you can tell them differently. The proof does not indicate which coin you flipped or how many times you flipped it.
The coin-flipping example meets zero-knowledge proof requirements:
Completeness: If you actually know which coin is biased and which is fair, you should be able to distinguish between them based on the order of coin flips, and your friend should be persuaded that you can.
Soundness: Your friend may confirm that you are correctly recognizing the coins by flipping one of them in front of you and validating your answer, thus the proof is sound in that regard. Because of this, your acquaintance can be sure that you are not just speculating or picking a coin at random.
Zero-knowledge: The argument is that your friend has no idea which coin is biased and which is fair beyond your ability to distinguish between them. Your friend is not made aware of the coin you used to make your decision or the order in which you flipped the coins. Consequently, except from letting you know which coin is biased and which is fair, the proof does not give any additional information about the coins themselves.
Figure out the prime number in Example #3.
You want to prove to a friend that you know their product n=pq without revealing p and q. Zero-knowledge proof?
Use a variant of the RSA algorithm. Method:
You determine a new number s = r2 mod n by computing a random number r.
You email your friend s and a declaration that you are aware of the values of p and q necessary for n to equal pq.
A random number (either 0 or 1) is selected by your friend and sent to you.
You send your friend r as evidence that you are aware of the values of p and q if e=0. You calculate and communicate your friend's s/r if e=1.
Without knowing the values of p and q, your friend can confirm that you know p and q (in the case where e=0) or that s/r is a legitimate square root of s mod n (in the situation where e=1).
This is a zero-knowledge proof since your friend learns nothing about p and q other than their product is n and your ability to verify it without exposing any other information. You can prove that you know p and q by sending r or by computing s/r and sending that instead (if e=1), and your friend can verify that you know p and q or that s/r is a valid square root of s mod n without learning anything else about their values. This meets the conditions of completeness, soundness, and zero-knowledge.
Zero-knowledge proofs satisfy the following:
Completeness: The prover can demonstrate this to the verifier by computing q = n/p and sending both p and q to the verifier. The prover also knows a prime number p and a factorization of n as p*q.
Soundness: Since it is impossible to identify any pair of numbers that correctly factorize n without being aware of its prime factors, the prover is unable to demonstrate knowledge of any p and q that do not do so.
Zero knowledge: The prover only admits that they are aware of a prime number p and its associated factor q, which is already known to the verifier. This is the extent of their knowledge of the prime factors of n. As a result, the prover does not provide any new details regarding n's prime factors.
Types of Proofs of Zero Knowledge
Each zero-knowledge proof has pros and cons. Most zero-knowledge proofs are:
Interactive Zero Knowledge Proofs: The prover and the verifier work together to establish the proof in this sort of zero-knowledge proof. The verifier disputes the prover's assertions after receiving a sequence of messages from the prover. When the evidence has been established, the prover will employ these new problems to generate additional responses.
Non-Interactive Zero Knowledge Proofs: For this kind of zero-knowledge proof, the prover and verifier just need to exchange a single message. Without further interaction between the two parties, the proof is established.
A statistical zero-knowledge proof is one in which the conclusion is reached with a high degree of probability but not with certainty. This indicates that there is a remote possibility that the proof is false, but that this possibility is so remote as to be unimportant.
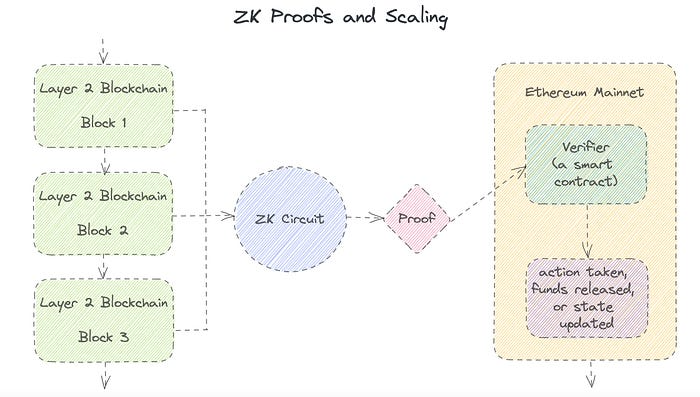
Succinct Non-Interactive Argument of Knowledge (SNARKs): SNARKs are an extremely effective and scalable form of zero-knowledge proof. They are utilized in many different applications, such as machine learning, blockchain technology, and more. Similar to other zero-knowledge proof techniques, SNARKs enable one party—the prover—to demonstrate to another—the verifier—that they are aware of a specific piece of information without disclosing any more information about that information.
The main characteristic of SNARKs is their succinctness, which refers to the fact that the size of the proof is substantially smaller than the amount of the original data being proved. Because to its high efficiency and scalability, SNARKs can be used in a wide range of applications, such as machine learning, blockchain technology, and more.
Uses for Zero Knowledge Proofs
ZKP applications include:
Verifying Identity ZKPs can be used to verify your identity without disclosing any personal information. This has uses in access control, digital signatures, and online authentication.
Proof of Ownership ZKPs can be used to demonstrate ownership of a certain asset without divulging any details about the asset itself. This has uses for protecting intellectual property, managing supply chains, and owning digital assets.
Financial Exchanges Without disclosing any details about the transaction itself, ZKPs can be used to validate financial transactions. Cryptocurrency, internet payments, and other digital financial transactions can all use this.
By enabling parties to make calculations on the data without disclosing the data itself, Data Privacy ZKPs can be used to preserve the privacy of sensitive data. Applications for this can be found in the financial, healthcare, and other sectors that handle sensitive data.
By enabling voters to confirm that their vote was counted without disclosing how they voted, elections ZKPs can be used to ensure the integrity of elections. This is applicable to electronic voting, including internet voting.
Cryptography Modern cryptography's ZKPs are a potent instrument that enable secure communication and authentication. This can be used for encrypted messaging and other purposes in the business sector as well as for military and intelligence operations.
Proofs of Zero Knowledge and Compliance
Kubernetes and regulatory compliance use ZKPs in many ways. Examples:
Security for Kubernetes ZKPs offer a mechanism to authenticate nodes without disclosing any sensitive information, enhancing the security of Kubernetes clusters. ZKPs, for instance, can be used to verify, without disclosing the specifics of the program, that the nodes in a Kubernetes cluster are running permitted software.
Compliance Inspection Without disclosing any sensitive information, ZKPs can be used to demonstrate compliance with rules like the GDPR, HIPAA, and PCI DSS. ZKPs, for instance, can be used to demonstrate that data has been encrypted and stored securely without divulging the specifics of the mechanism employed for either encryption or storage.
Access Management Without disclosing any private data, ZKPs can be used to offer safe access control to Kubernetes resources. ZKPs can be used, for instance, to demonstrate that a user has the necessary permissions to access a particular Kubernetes resource without disclosing the details of those permissions.
Safe Data Exchange Without disclosing any sensitive information, ZKPs can be used to securely transmit data between Kubernetes clusters or between several businesses. ZKPs, for instance, can be used to demonstrate the sharing of a specific piece of data between two parties without disclosing the details of the data itself.
Kubernetes deployments audited Without disclosing the specifics of the deployment or the data being processed, ZKPs can be used to demonstrate that Kubernetes deployments are working as planned. This can be helpful for auditing purposes and for ensuring that Kubernetes deployments are operating as planned.
ZKPs preserve data and maintain regulatory compliance by letting parties prove things without revealing sensitive information. ZKPs will be used more in Kubernetes as it grows.

Max Parasol
3 years ago
Are DAOs the future or just a passing fad?
How do you DAO? Can DAOs scale?
DAO: Decentralized Autonomous. Organization.
“The whole phrase is a misnomer. They're not decentralized, autonomous, or organizations,” says Monsterplay blockchain consultant David Freuden.
As part of the DAO initiative, Freuden coauthored a 51-page report in May 2020. “We need DAOs,” he says. “‘Shareholder first' is a 1980s/90s concept. Profits became the focus, not products.”
His predictions for DAOs have come true nearly two years later. DAOs had over 1.6 million participants by the end of 2021, up from 13,000 at the start of the year. Wyoming, in the US, will recognize DAOs and the Marshall Islands in 2021. Australia may follow that example in 2022.
But what is a DAO?
Members buy (or are rewarded with) governance tokens to vote on how the DAO operates and spends its money. “DeFi spawned DAOs as an investment vehicle. So a DAO is tokenomics,” says Freuden.
DAOs are usually built around a promise or a social cause, but they still want to make money. “If you can't explain why, the DAO will fail,” he says. “A co-op without tokenomics is not a DAO.”
Operating system DAOs, protocol DAOs, investment DAOs, grant DAOs, service DAOs, social DAOs, collector DAOs, and media DAOs are now available.
Freuden liked the idea of people rallying around a good cause. Speculators and builders make up the crypto world, so it needs a DAO for them.
,Speculators and builders, or both, have mismatched expectations, causing endless, but sometimes creative friction.
Organisms that boost output
Launching a DAO with an original product such as a cryptocurrency, an IT protocol or a VC-like investment fund like FlamingoDAO is common. DAOs enable distributed open-source contributions without borders. The goal is vital. Sometimes, after a product is launched, DAOs emerge, leaving the company to eventually transition to a DAO, as Uniswap did.
Doing things together is a DAO. So it's a way to reward a distributed workforce. DAOs are essentially productivity coordination organisms.
“Those who work for the DAO make permissionless contributions and benefit from fragmented employment,” argues Freuden. DAOs are, first and foremost, a new form of cooperation.
DAO? Distributed not decentralized
In decentralized autonomous organizations, words have multiple meanings. DAOs can emphasize one aspect over another. Autonomy is a trade-off for decentralization.
DAOstack CEO Matan Field says a DAO is a distributed governance system. Power is shared. However, there are two ways to understand a DAO's decentralized nature. This clarifies the various DAO definitions.
A decentralized infrastructure allows a DAO to be decentralized. It could be created on a public permissionless blockchain to prevent a takeover.
As opposed to a company run by executives or shareholders, a DAO is distributed. Its leadership does not wield power
Option two is clearly distributed.
But not all of this is “automated.”
Think quorum, not robot.
DAOs can be autonomous in the sense that smart contracts are self-enforcing and self-executing. So every blockchain transaction is a simplified smart contract.
Dao landscape
The DAO landscape is evolving.
Consider how Ethereum's smart contracts work. They are more like self-executing computer code, which Vitalik Buterin calls “persistent scripts”.
However, a DAO is self-enforcing once its members agree on its rules. As such, a DAO is “automated upon approval by the governance committee.” This distinguishes them from traditional organizations whose rules must be interpreted and applied.
Why a DAO? They move fast
A DAO can quickly adapt to local conditions as a governance mechanism. It's a collaborative decision-making tool.
Like UkraineDAO, created in response to Putin's invasion of Ukraine by Ukrainian expat Alona Shevchenko, Nadya Tolokonnikova, Trippy Labs, and PleasrDAO. The DAO sought to support Ukrainian charities by selling Ukrainian flag NFTs. With a single mission, a DAO can quickly raise funds for a country accepting crypto where banks are distrusted.
This could be a watershed moment for DAOs.
ConstitutionDAO was another clever use case for DAOs for Freuden. In a failed but “beautiful experiment in a single-purpose DAO,” ConstitutionDAO tried to buy a copy of the US Constitution from a Sotheby's auction. In November 2021, ConstitutionDAO raised $47 million from 19,000 people, but a hedge fund manager outbid them.
Contributions were returned or lost if transactional gas fees were too high. The ConstitutionDAO, as a “beautiful experiment,” proved exceptionally fast at organizing and crowdsourcing funds for a specific purpose.
We may soon be applauding UkraineDAO's geopolitical success in support of the DAO concept.
Some of the best use cases for DAOs today, according to Adam Miller, founder of DAOplatform.io and MIDAO Directory Services, involve DAO structures.
That is, a “flat community is vital.” Prototyping by the crowd is a good example. To succeed, members must be enthusiastic about DAOs as an alternative to starting a company. Because DAOs require some hierarchy, he agrees that "distributed is a better acronym."
Miller sees DAOs as a “new way of organizing people and resources.” He started DAOplatform.io, a DAO tooling advisery that is currently transitioning to a DAO due to the “woeful tech options for running a DAO,” which he says mainly comprises of just “multisig admin keys and a voting system.” So today he's advising on DAO tech stacks.
Miller identifies three key elements.
Tokenization is a common method and tool. Second, governance mechanisms connected to the DAO's treasury. Lastly, community.”
How a DAO works...
They can be more than glorified Discord groups if they have a clear mission. This mission is a mix of financial speculation and utopianism. The spectrum is vast.
The founder of Dash left the cryptocurrency project in 2017. It's the story of a prophet without an heir. So creating a global tokenized evangelical missionary community via a DAO made sense.
Evan Duffield, a “libertarian/anarchist” visionary, forked Bitcoin in January 2014 to make it instant and essentially free. He went away for a while, and DASH became a DAO.
200,000 US retailers, including Walmart and Barnes & Noble, now accept Dash as payment. This payment system works like a gift card.
Arden Goldstein, Dash's head of crypto, DAO, and blockchain marketing, claims Dash is the “first successful DAO.” It was founded in 2016 and disbanded after a hack, an Ethereum hard fork and much controversy. But what are the success metrics?
Crypto success is measured differently, says Goldstein. To achieve common goals, people must participate or be motivated in a healthy DAO. People are motivated to complete tasks in a successful DAO. And, crucially, when tasks get completed.
“Yes or no, 1 or 0, voting is not a new idea. The challenge is getting people to continue to participate and keep building a community.” A DAO motivates volunteers: Nothing keeps people from building. The DAO “philosophy is old news. You need skin in the game to play.”
MasterNodes must stake 1000 Dash. Those members are rewarded with DASH for marketing (and other tasks). It uses an outsourced team to onboard new users globally.
Joining a DAO is part of the fun of meeting crazy or “very active” people on Discord. No one gets fired (usually). If your work is noticed, you may be offered a full-time job.
DAO community members worldwide are rewarded for brand building. Dash is also a great product for developing countries with high inflation and undemocratic governments. The countries with the most Dash DAO members are Russia, Brazil, Venezuela, India, China, France, Italy, and the Philippines.
Grassroots activism makes this DAO work. A DAO is local. Venezuelans can't access Dash.org, so DAO members help them use a VPN. DAO members are investors, fervent evangelicals, and local product experts.
Every month, proposals and grant applications are voted on via the Dash platform. However, the DAO may decide not to fund you. For example, the DAO once hired a PR firm, but the community complained about the lack of press coverage. This raises a great question: How are real-world contractual obligations met by a DAO?
Does the DASH DAO work?
“I see the DAO defund projects I thought were valuable,” Goldstein says. Despite working full-time, I must submit a funding proposal. “Much faster than other companies I've worked on,” he says.
Dash DAO is a headless beast. Ryan Taylor is the CEO of the company overseeing the DASH Core Group project.
The issue is that “we don't know who has the most tokens [...] because we don't know who our customers are.” As a result, “the loudest voices usually don't have the most MasterNodes and aren't the most invested.”
Goldstein, the only female in the DAO, says she worked hard. “I was proud of the DAO when I made the logo pink for a day and got great support from the men.” This has yet to entice a major influx of female DAO members.
Many obstacles stand in the way of utopian dreams.
Governance problems remain
And what about major token holders behaving badly?
In early February, a heated crypto Twitter debate raged on about inclusion, diversity, and cancel culture in relation to decentralized projects. In this case, the question was how a DAO addresses alleged inappropriate behavior.
In a corporation, misconduct can result in termination. In a DAO, founders usually hold a large number of tokens and the keys to the blockchain (multisignature) or otherwise.
Brantly Millegan, the director of operations of Ethereum Name Service (ENS), made disparaging remarks about the LGBTQ community and other controversial topics. The screenshotted comments were made in 2016 and brought to the ENS board's attention in early 2022.
His contract with ENS has expired. But what of his large DAO governance token holdings?
Members of the DAO proposed a motion to remove Millegan from the DAO. His “delegated” votes net 370,000. He was and is the DAO's largest delegate.
What if he had refused to accept the DAO's decision?
Freuden says the answer is not so simple.
“Can a DAO kick someone out who built the project?”
The original mission “should be dissolved” if it no longer exists. “Does a DAO fail and return the money? They must r eturn the money with interest if the marriage fails.”
Before an IPO, VCs might try to remove a problematic CEO.
While DAOs use treasury as a governance mechanism, it is usually controlled (at least initially) by the original project creators. Or, in the case of Uniswap, the venture capital firm a16z has so much voting power that it has delegated it to student-run blockchain organizations.
So, can DAOs really work at scale? How to evolve voting paradigms beyond token holdings?
The whale token holder issue has some solutions. Multiple tokens, such as a utility token on top of a governance token, and quadratic voting for whales, are now common. Other safeguards include multisignature blockchain keys and decision time locks that allow for any automated decision to be made. The structure of each DAO will depend on the assets at stake.
In reality, voter turnout is often a bigger issue.
Is DAO governance scalable?
Many DAOs have low participation. Due to a lack of understanding of technology, apathy, or busy lives. “The bigger the DAO, the fewer voters who vote,” says Freuden.
Freuden's report cites British anthropologist Dunbar's Law, who argued that people can only maintain about 150 relationships.
"As the DAO grows in size, the individual loses influence because they perceive their voting power as being diminished or insignificant. The Ringelmann Effect and Dunbar's Rule show that as a group grows in size, members become lazier, disenfranchised, and detached.
Freuden says a DAO requires “understanding human relationships.” He believes DAOs work best as investment funds rooted in Cryptoland and small in scale. In just three weeks, SyndicateDAO enabled the creation of 450 new investment group DAOs.
Due to SEC regulations, FlamingoDAO, a famous NFT curation investment DAO, could only have 100 investors. The “LAO” is a member-directed venture capital fund and a US LLC. To comply with US securities law, they only allow 100 members with a 120ETH minimum staking contribution.
But how did FlamingoDAO make investment decisions? How often did all 70 members vote? Art and NFTs are highly speculative.
So, investment DAOs are thought to work well in a small petri dish environment. This is due to a crypto-native club's pooled capital (maximum 7% per member) and crowdsourced knowledge.
While scalability is a concern, each DAO will operate differently depending on the goal, technology stage, and personalities. Meetups and hackathons are common ways for techies to collaborate on a cause or test an idea. But somebody still organizes the hack.
Holographic consensus voting
But clever people are working on creative solutions to every problem.
Miller of DAOplatform.io cites DXdao as a successful DAO. Decentralized product and service creator DXdao runs the DAO entirely on-chain. “You earn voting rights by contributing to the community.”
DXdao, a DAOstack fork, uses holographic consensus, a voting algorithm invented by DAOstack founder Matan Field. The system lets a random or semi-random subset make group-wide decisions.
By acting as a gatekeeper for voters, DXdao's Luke Keenan explains that “a small predictions market economy emerges around the likely outcome of a proposal as tokens are staked on it.” Also, proposals that have been financially boosted have fewer requirements to be successful, increasing system efficiency.” DXdao “makes decisions by removing voting power as an economic incentive.”
Field explains that holographic consensus “does not require a quorum to render a vote valid.”
“Rather, it provides a parallel process. It is a game played (for profit) by ‘predictors' who make predictions about whether or not a vote will be approved by the voters. The voting process is valid even when the voting quorum is low if enough stake is placed on the outcome of the vote.
“In other words, a quorum is not a scalable DAO governance strategy,” Field says.
You don't need big votes on everything. If only 5% vote, fine. To move significant value or make significant changes, you need a longer voting period (say 30 days) and a higher quorum,” says Miller.
Clearly, DAOs are maturing. The emphasis is on tools like Orca and processes that delegate power to smaller sub-DAOs, committees, and working groups.
Miller also claims that “studies in psychology show that rewarding people too much for volunteering disincentivizes them.” So, rather than giving out tokens for every activity, you may want to offer symbolic rewards like POAPs or contributor levels.
“Free lunches are less rewarding. Random rewards can boost motivation.”
Culture and motivation
DAOs (and Web3 in general) can give early adopters a sense of ownership. In theory, they encourage early participation and bootstrapping before network effects.
"A double-edged sword," says Goldstein. In the developing world, they may not be fully scalable.
“There must always be a leader,” she says. “People won't volunteer if they don't want to.”
DAO members sometimes feel entitled. “They are not the boss, but they think they should be able to see my calendar or get a daily report,” Goldstein gripes. Say, “I own three MasterNodes and need to know X, Y, and Z.”
In most decentralized projects, strong community leaders are crucial to influencing culture.
Freuden says “the DAO's community builder is the cryptoland influencer.” They must “disseminate the DAO's culture, cause, and rally the troops” in English, not tech.
They must keep members happy.
So the community builder is vital. Building a community around a coin that promises riches is simple, but keeping DAO members motivated is difficult.
It's a human job. But tools like SourceCred or coordinate that measure contributions and allocate tokens are heavily marketed. Large growth funds/community funds/grant programs are common among DAOs.
The Future?
Onboarding, committed volunteers, and an iconic community builder may be all DAOs need.
It takes a DAO just one day to bring together a passionate (and sometimes obsessive) community. For organizations with a common goal, managing stakeholder expectations is critical.
A DAO's core values are community and cause, not scalable governance. “DAOs will work at scale like gaming communities, but we will have sub-DAOs everywhere like committees,” says Freuden.
So-called holographic consensuses “can handle, in principle, increasing rates of proposals by turning this tension between scale and resilience into an economical cost,” Field writes. Scalability is not guaranteed.
The DAO's key innovation is the fragmented workplace. “Voting is a subset of engagement,” says Freuden. DAO should allow for permissionless participation and engagement. DAOs allow for remote work.”
In 20 years, DAOs may be the AI-powered self-organizing concept. That seems far away now. But a new breed of productivity coordination organisms is maturing.

Matt Ward
3 years ago
Is Web3 nonsense?
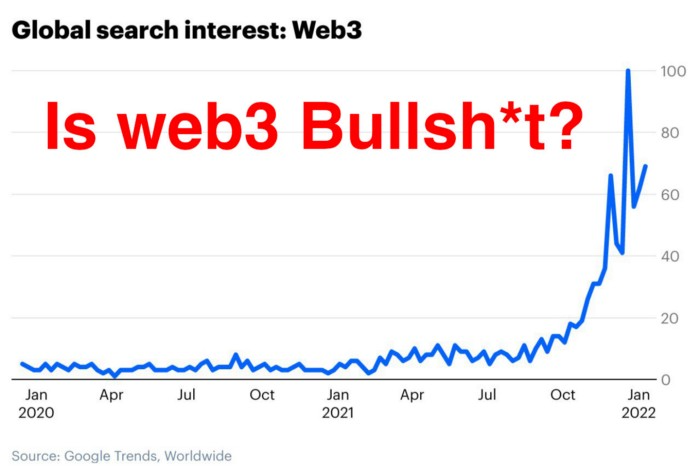
Crypto and blockchain have rebranded as web3. They probably thought it sounded better and didn't want the baggage of scam ICOs, STOs, and skirted securities laws.
It was like Facebook becoming Meta. Crypto's biggest players wanted to change public (and regulator) perception away from pump-and-dump schemes.
After the 2018 ICO gold rush, it's understandable. Every project that raised millions (or billions) never shipped a meaningful product.
Like many crazes, charlatans took the money and ran.
Despite its grifter past, web3 is THE hot topic today as more founders, venture firms, and larger institutions look to build the future decentralized internet.
Supposedly.
How often have you heard: This will change the world, fix the internet, and give people power?
Why are most of web3's biggest proponents (and beneficiaries) the same rich, powerful players who built and invested in the modern internet? It's like they want to remake and own the internet.
Something seems off about that.
Why are insiders getting preferential presale terms before the public, allowing early investors and proponents to flip dirt cheap tokens and advisors shares almost immediately after the public sale?
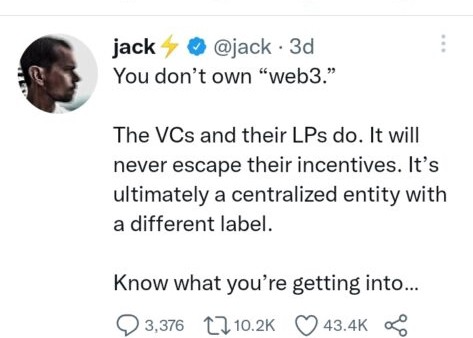
It's a good gig with guaranteed markups, no risk or progress.
If it sounds like insider trading, it is, at least practically. This is clear when people talk about blockchain/web3 launches and tokens.
Fast money, quick flips, and guaranteed markups/returns are common.
Incentives-wise, it's hard to blame them. Who can blame someone for following the rules to win? Is it their fault or regulators' for not leveling the playing field?
It's similar to oil companies polluting for profit, Instagram depressing you into buying a new dress, or pharma pushing an unnecessary pill.
All of that is fair game, at least until we change the playbook, because people (and corporations) change for pain or love. Who doesn't love money?
belief based on money gain
Sinclair:
“It is difficult to get a man to understand something when his salary depends upon his not understanding it.”
Bitcoin, blockchain, and web3 analogies?
Most blockchain and web3 proponents are true believers, not cynical capitalists. They believe blockchain's inherent transparency and permissionless trust allow humanity to evolve beyond our reptilian ways and build a better decentralized and democratic world.
They highlight issues with the modern internet and monopoly players like Google, Facebook, and Apple. Decentralization fixes everything
If we could give power back to the people and get governments/corporations/individuals out of the way, we'd fix everything.
Blockchain solves supply chain and child labor issues in China.
To meet Paris climate goals, reduce emissions. Create a carbon token.
Fixing online hatred and polarization Web3 Twitter and Facebook replacement.
Web3 must just be the answer for everything… your “perfect” silver bullet.
Nothing fits everyone. Blockchain has pros and cons like everything else.
Blockchain's viral, ponzi-like nature has an MLM (mid level marketing) feel. If you bought Taylor Swift's NFT, your investment is tied to her popularity.
Probably makes you promote Swift more. Play music loudly.
Here's another example:
Imagine if Jehovah’s Witnesses (or evangelical preachers…) got paid for every single person they converted to their cause.
It becomes a self-fulfilling prophecy as their faith and wealth grow.
Which breeds extremism? Ultra-Orthodox Jews are an example. maximalists
Bitcoin and blockchain are causes, religions. It's a money-making movement and ideal.
We're good at convincing ourselves of things we want to believe, hence filter bubbles.
I ignore anything that doesn't fit my worldview and seek out like-minded people, which algorithms amplify.
Then what?
Is web3 merely a new scam?
No, never!
Blockchain has many crucial uses.
Sending money home/abroad without bank fees;
Like fleeing a war-torn country and converting savings to Bitcoin;
Like preventing Twitter from silencing dissidents.
Permissionless, trustless databases could benefit society and humanity. There are, however, many limitations.
Lost password?
What if you're cheated?
What if Trump/Putin/your favorite dictator incites a coup d'état?
What-ifs abound. Decentralization's openness brings good and bad.
No gatekeepers or firefighters to rescue you.
ISIS's fundraising is also frictionless.
Community-owned apps with bad interfaces and service.
Trade-offs rule.
So what compromises does web3 make?
What are your trade-offs? Decentralization has many strengths and flaws. Like Bitcoin's wasteful proof-of-work or Ethereum's political/wealth-based proof-of-stake.
To ensure the survival and veracity of the network/blockchain and to safeguard its nodes, extreme measures have been designed/put in place to prevent hostile takeovers aimed at altering the blockchain, i.e., adding money to your own wallet (account), etc.
These protective measures require significant resources and pose challenges. Reduced speed and throughput, high gas fees (cost to submit/write a transaction to the blockchain), and delayed development times, not to mention forked blockchain chains oops, web3 projects.
Protecting dissidents or rogue regimes makes sense. You need safety, privacy, and calm.
First-world life?
What if you assumed EVERYONE you saw was out to rob/attack you? You'd never travel, trust anyone, accomplish much, or live fully. The economy would collapse.
It's like an ant colony where half the ants do nothing but wait to be attacked.
Waste of time and money.
11% of the US budget goes to the military. Imagine what we could do with the $766B+ we spend on what-ifs annually.
Is so much hypothetical security needed?
Blockchain and web3 are similar.
Does your app need permissionless decentralization? Does your scooter-sharing company really need a proof-of-stake system and 1000s of nodes to avoid Russian hackers? Why?
Worst-case scenario? It's not life or death, unless you overstate the what-ifs. Web3 proponents find improbable scenarios to justify decentralization and tokenization.
Do I need a token to prove ownership of my painting? Unless I'm a master thief, I probably bought it.
despite losing the receipt.
I do, however, love Web 3.
Enough Web3 bashing for now. Understand? Decentralization isn't perfect, but it has huge potential when applied to the right problems.
I see many of the right problems as disrupting big tech's ruthless monopolies. I wrote several years ago about how tokenized blockchains could be used to break big tech's stranglehold on platforms, marketplaces, and social media.
Tokenomics schemes can be used for good and are powerful. Here’s how.
Before the ICO boom, I made a series of predictions about blockchain/crypto's future. It's still true.
Here's where I was then and where I see web3 going:
My 11 Big & Bold Predictions for Blockchain
In the near future, people may wear crypto cash rings or bracelets.
While some governments repress cryptocurrency, others will start to embrace it.
Blockchain will fundamentally alter voting and governance, resulting in a more open election process.
Money freedom will lead to a more geographically open world where people will be more able to leave when there is unrest.
Blockchain will make record keeping significantly easier, eliminating the need for a significant portion of government workers whose sole responsibility is paperwork.
Overrated are smart contracts.
6. Tokens will replace company stocks.
7. Blockchain increases real estate's liquidity, value, and volatility.
8. Healthcare may be most affected.
9. Crypto could end privacy and lead to Minority Report.
10. New companies with network effects will displace incumbents.
11. Soon, people will wear rings or bracelets with crypto cash.
Some have already happened, while others are still possible.
Time will tell if they happen.
And finally:
What will web3 be?
Who will be in charge?
Closing remarks
Hope you enjoyed this web3 dive. There's much more to say, but that's for another day.
We're writing history as we go.
Tech regulation, mergers, Bitcoin surge How will history remember us?
What about web3 and blockchain?
Is this a revolution or a tulip craze?
Remember, actions speak louder than words (share them in the comments).
Your turn.