


More on Entrepreneurship/Creators

Hasan AboulHasan
3 years ago
High attachment products can help you earn money automatically.

Affiliate marketing is a popular online moneymaker. You promote others' products and get commissions. Affiliate marketing requires constant product promotion.
Affiliate marketing can be profitable even without much promotion. Yes, this is Autopilot Money.
How to Pick an Affiliate Program to Generate Income Autonomously
Autopilot moneymaking requires a recurring affiliate marketing program.
Finding the best product and testing it takes a lot of time and effort.
Here are three ways to choose the best service or product to promote:
Find a good attachment-rate product or service.
When choosing a product, ask if you can easily switch to another service. Attachment rate is how much people like a product.
Higher attachment rates mean better Autopilot products.
Consider promoting GetResponse. It's a 33% recurring commission email marketing tool. This means you get 33% of the customer's plan as long as he pays.
GetResponse has a high attachment rate because it's hard to leave and start over with another tool.
2. Pick a good or service with a lot of affiliate assets.
Check if a program has affiliate assets or creatives before joining.
Images and banners to promote the product in your business.
They save time; I look for promotional creatives. Creatives or affiliate assets are website banners or images. This reduces design time.
3. Select a service or item that consumers already adore.
New products are hard to sell. Choosing a trusted company's popular product or service is helpful.
As a beginner, let people buy a product they already love.
Online entrepreneurs and digital marketers love Systeme.io. It offers tools for creating pages, email marketing, funnels, and more. This product guarantees a high ROI.
Make the product known!
Affiliate marketers struggle to get traffic. Using affiliate marketing to make money is easier than you think if you have a solid marketing strategy.
Your plan should include:
1- Publish affiliate-related blog posts and SEO-optimize them
2- Sending new visitors product-related emails
3- Create a product resource page.
4-Review products
5-Make YouTube videos with links in the description.
6- Answering FAQs about your products and services on your blog and Quora.
7- Create an eCourse on how to use this product.
8- Adding Affiliate Banners to Your Website.
With these tips, you can promote your products and make money on autopilot.

Woo
3 years ago
How To Launch A Business Without Any Risk
> Say Hello To The Lean-Hedge Model
People think starting a business requires significant debt and investment. Like Shark Tank, you need a world-changing idea. I'm not saying to avoid investors or brilliant ideas.
Investing is essential to build a genuinely profitable company. Think Apple or Starbucks.
Entrepreneurship is risky because many people go bankrupt from debt. As starters, we shouldn't do it. Instead, use lean-hedge.
Simply defined, you construct a cash-flow business to hedge against long-term investment-heavy business expenses.
What the “fx!$rench-toast” is the lean-hedge model?
When you start a business, your money should move down, down, down, then up when it becomes profitable.
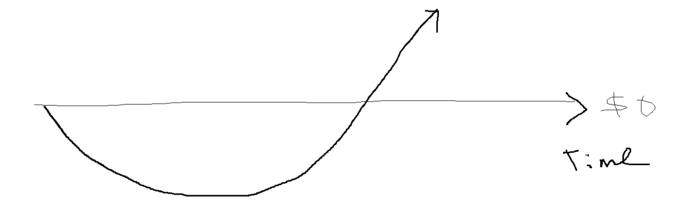
Many people don't survive the business's initial losses and debt. What if, we created a cash-flow business BEFORE we started our Starbucks to hedge against its initial expenses?
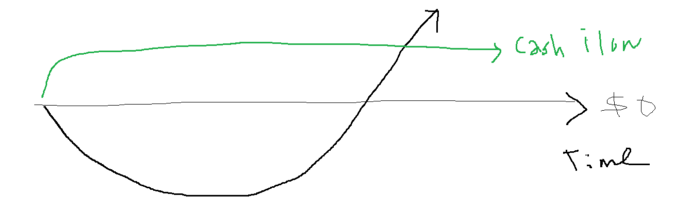
Lean-hedge has two sections. Start a cash-flow business. A cash-flow business takes minimal investment and usually involves sweat and time.
Let’s take a look at some examples:
A Translation company
Personal portfolio website (you make a site then you do cold e-mail marketing)
FREELANCE (UpWork, Fiverr).
Educational business.
Infomarketing. (You design a knowledge-based product. You sell the info).
Online fitness/diet/health coaching ($50-$300/month, calls, training plan)
Amazon e-book publishing. (Medium writers do this)
YouTube, cash-flow channel
A web development agency (I'm a dev, but if you're not, a graphic design agency, etc.) (Sell your time.)
Digital Marketing
Online paralegal (A million lawyers work in the U.S).
Some dropshipping (Organic Tik Tok dropshipping, where you create content to drive traffic to your shopify store instead of spend money on ads).
(Disclaimer: My first two cash-flow enterprises, which were language teaching, failed terribly. My translation firm is now booming because B2B e-mail marketing is easy.)
Crossover occurs. Your long-term business starts earning more money than your cash flow business.
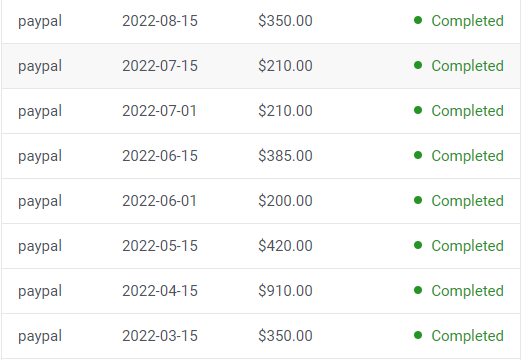
My cash-flow business (freelancing, translation) makes $7k+/month.
I’ve decided to start a slightly more investment-heavy digital marketing agency
Here are the anticipated business's time- and money-intensive investments:
($$$) Top Front-End designer's Figma/UI-UX design (in negotiation)
(Time): A little copywriting (I will do this myself)
($$) Creating an animated webpage with HTML (in negotiation)
Backend Development (Duration) (I'll carry out this myself using Laravel.)
Logo Design ($$)
Logo Intro Video for $
Video Intro (I’ll edit this myself with Premiere Pro)
etc.
Then evaluate product, place, price, and promotion. Consider promotion and pricing.
The lean-hedge model's point is:
Don't gamble. Avoid debt. First create a cash-flow project, then grow it steadily.
Check read my previous posts on “Nightmare Mode” (which teaches you how to make work as interesting as video games) and Why most people can't escape a 9-5 to learn how to develop a cash-flow business.

Jared Heyman
3 years ago
The survival and demise of Y Combinator startups
I've written a lot about Y Combinator's success, but as any startup founder or investor knows, many startups fail.
Rebel Fund invests in the top 5-10% of new Y Combinator startups each year, so we focus on identifying and supporting the most promising technology startups in our ecosystem. Given the power law dynamic and asymmetric risk/return profile of venture capital, we worry more about our successes than our failures. Since the latter still counts, this essay will focus on the proportion of YC startups that fail.
Since YC's launch in 2005, the figure below shows the percentage of active, inactive, and public/acquired YC startups by batch.
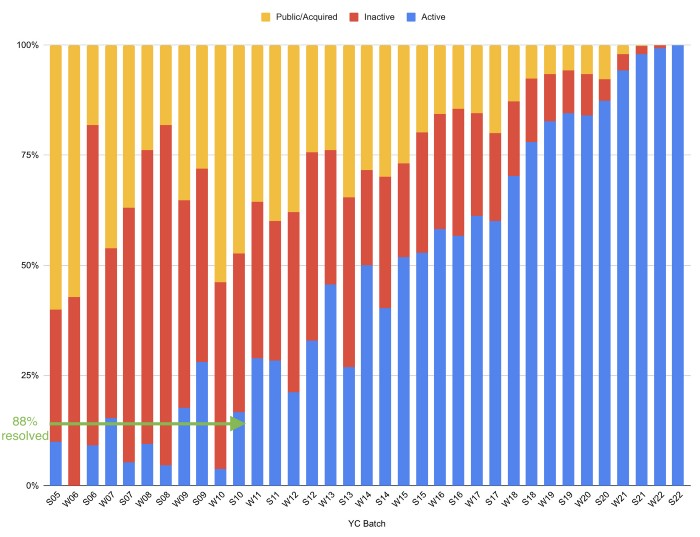
As more startups finish, the blue bars (active) decrease significantly. By 12 years, 88% of startups have closed or exited. Only 7% of startups reach resolution each year.
YC startups by status after 12 years:
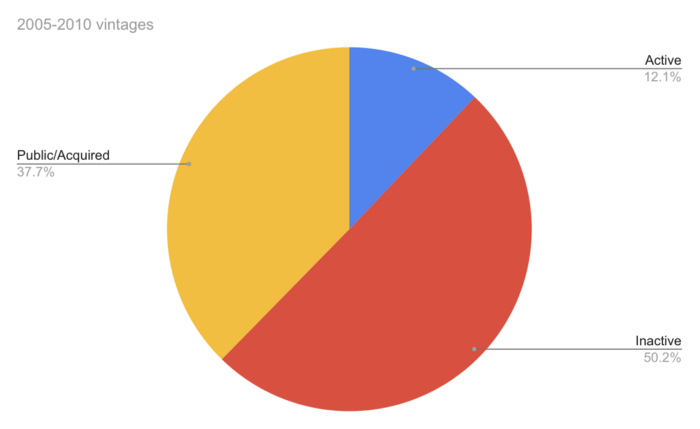
Half the startups have failed, over one-third have exited, and the rest are still operating.
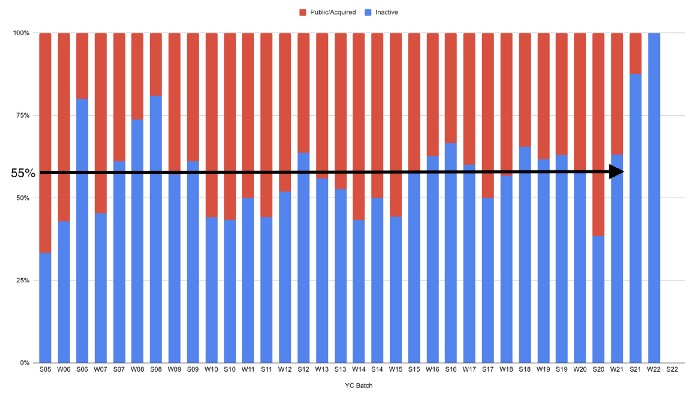
In venture investing, it's said that failed investments show up before successful ones. This is true for YC startups, but only in their early years.
Below, we only present resolved companies from the first chart. Some companies fail soon after establishment, but after a few years, the inactive vs. public/acquired ratio stabilizes around 55:45. After a few years, a YC firm is roughly as likely to quit as fail, which is better than I imagined.
I prepared this post because Rebel investors regularly question me about YC startup failure rates and how long it takes for them to exit or shut down.
Early-stage venture investors can overlook it because 100x investments matter more than 0x investments.
YC founders can ignore it because it shouldn't matter if many of their peers succeed or fail ;)
You might also like

INTΞGRITY team
3 years ago
Privacy Policy
Effective date: August 31, 2022
This Privacy Statement describes how INTΞGRITY ("we," or "us") collects, uses, and discloses your personal information. This Privacy Statement applies when you use our websites, mobile applications, and other online products and services that link to this Privacy Statement (collectively, our "Services"), communicate with our customer care team, interact with us on social media, or otherwise interact with us.
This Privacy Policy may be modified from time to time. If we make modifications, we will update the date at the top of this policy and, in certain instances, we may give you extra notice (such as adding a statement to our website or providing you with a notification). We encourage you to routinely review this Privacy Statement to remain informed about our information practices and available options.
INFORMATION COLLECTION
The Data You Provide to Us
We collect information that you directly supply to us. When you register an account, fill out a form, submit or post material through our Services, contact us via third-party platforms, request customer assistance, or otherwise communicate with us, you provide us with information directly. We may collect your name, display name, username, bio, email address, company information, your published content, including your avatar image, photos, posts, responses, and any other information you voluntarily give.
In certain instances, we may collect the information you submit about third parties. We will use your information to fulfill your request and will not send emails to your contacts unrelated to your request unless they separately opt to receive such communications or connect with us in some other way.
We do not collect payment details via the Services.
Automatically Collected Information When You Communicate with Us
In certain cases, we automatically collect the following information:
We gather data regarding your behavior on our Services, such as your reading history and when you share links, follow users, highlight posts, and like posts.
Device and Usage Information: We gather information about the device and network you use to access our Services, such as your hardware model, operating system version, mobile network, IP address, unique device identifiers, browser type, and app version. We also collect information regarding your activities on our Services, including access times, pages viewed, links clicked, and the page you visited immediately prior to accessing our Services.
Information Obtained Through Cookies and Comparable Tracking Technologies: We collect information about you through tracking technologies including cookies and web beacons. Cookies are little data files kept on your computer's hard disk or device's memory that assist us in enhancing our Services and your experience, determining which areas and features of our Services are the most popular, and tracking the number of visitors. Web beacons (also known as "pixel tags" or "clear GIFs") are electronic pictures that we employ on our Services and in our communications to assist with cookie delivery, session tracking, and usage analysis. We also partner with third-party analytics providers who use cookies, web beacons, device identifiers, and other technologies to collect information regarding your use of our Services and other websites and applications, including your IP address, web browser, mobile network information, pages viewed, time spent on pages or in mobile apps, and links clicked. INTΞGRITY and others may use your information to, among other things, analyze and track data, evaluate the popularity of certain content, present content tailored to your interests on our Services, and better comprehend your online activities. See Your Options for additional information on cookies and how to disable them.
Information Obtained from Outside Sources
We acquire information from external sources. We may collect information about you, for instance, through social networks, accounting service providers, and data analytics service providers. In addition, if you create or log into your INTΞGRITY account via a third-party platform (such as Apple, Facebook, Google, or Twitter), we will have access to certain information from that platform, including your name, lists of friends or followers, birthday, and profile picture, in accordance with the authorization procedures determined by that platform.
We may derive information about you or make assumptions based on the data we gather. We may deduce your location based on your IP address or your reading interests based on your reading history, for instance.
USAGE OF INFORMATION
We use the information we collect to deliver, maintain, and enhance our Services, including publishing and distributing user-generated content, and customizing the posts you see. Additionally, we utilize collected information to: create and administer your INTΞGRITY account;
Send transaction-related information, including confirmations, receipts, and user satisfaction surveys;
Send you technical notices, security alerts, and administrative and support messages;
Respond to your comments and queries and offer support;
Communicate with you about new INTΞGRITY content, goods, services, and features, as well as other news and information that we believe may be of interest to you (see Your Choices for details on how to opt out of these communications at any time);
Monitor and evaluate usage, trends, and activities associated with our Services;
Detect, investigate, and prevent security incidents and other harmful, misleading, fraudulent, or illegal conduct, and safeguard INTΞGRITY’s and others' rights and property;
Comply with our legal and financial requirements; and Carry out any other purpose specified to you at the time the information was obtained.
SHARING OF INFORMATION
We share personal information where required by law or as otherwise specified in this policy:
Personal information is shared with other Service users. If you use our Services to publish content, make comments, or send private messages, for instance, certain information about you, such as your name, photo, bio, and other account information you may supply, as well as information about your activity on our Services, will be available to others (e.g., your followers and who you follow, recent posts, likes, highlights, and responses).
We share personal information with vendors, service providers, and consultants who require access to such information to perform services on our behalf, such as companies that assist us with web hosting, storage, and other infrastructure, analytics, fraud prevention, and security, customer service, communications, and marketing.
We may release personally identifiable information if we think that doing so is in line with or required by any relevant law or legal process, including authorized demands from public authorities to meet national security or law enforcement obligations. If we intend to disclose your personal information in response to a court order, we will provide you with prior notice so that you may contest the disclosure (for example, by seeking court intervention), unless we are prohibited by law or believe that doing so could endanger others or lead to illegal conduct. We shall object to inappropriate legal requests for information regarding users of our Services.
If we believe your actions are inconsistent with our user agreements or policies, if we suspect you have violated the law, or if we believe it is necessary to defend the rights, property, and safety of INTΞGRITY, our users, the public, or others, we may disclose your personal information.
We share personal information with our attorneys and other professional advisers when necessary for obtaining counsel or otherwise protecting and managing our business interests.
We may disclose personal information in conjunction with or during talks for any merger, sale of corporate assets, financing, or purchase of all or part of our business by another firm.
Personal information is transferred between and among INTΞGRITY, its current and future parents, affiliates, subsidiaries, and other companies under common ownership and management.
We will only share your personal information with your permission or at your instruction.
We also disclose aggregated or anonymized data that cannot be used to identify you.
IMPLEMENTATIONS FROM THIRD PARTIES
Some of the content shown on our Services is not hosted by INTΞGRITY. Users are able to publish content hosted by a third party but embedded in our pages ("Embed"). When you interact with an Embed, it can send information to the hosting third party just as if you had visited the hosting third party's website directly. When you load an INTΞGRITY post page with a YouTube video Embed and view the video, for instance, YouTube collects information about your behavior, such as your IP address and how much of the video you watch. INTΞGRITY has no control over the information that third parties acquire via Embeds or what they do with it. This Privacy Statement does not apply to data gathered via Embeds. Before interacting with the Embed, it is recommended that you review the privacy policy of the third party hosting the Embed, which governs any information the Embed gathers.
INFORMATION TRANSFER TO THE UNITED STATES AND OTHER NATIONS
INTΞGRITY’s headquarters are located in the United States, and we have operations and service suppliers in other nations. Therefore, we and our service providers may transmit, store, or access your personal information in jurisdictions that may not provide a similar degree of data protection to your home jurisdiction. For instance, we transfer personal data to Amazon Web Services, one of our service providers that processes personal information on our behalf in numerous data centers throughout the world, including those indicated above. We shall take measures to guarantee that your personal information is adequately protected in the jurisdictions where it is processed.
YOUR SETTINGS
Account Specifics
You can access, modify, delete, and export your account information at any time by login into the Services and visiting the Settings page. Please be aware that if you delete your account, we may preserve certain information on you as needed by law or for our legitimate business purposes.
Cookies
The majority of web browsers accept cookies by default. You can often configure your browser to delete or refuse cookies if you wish. Please be aware that removing or rejecting cookies may impact the accessibility and performance of our services.
Communications
You may opt out of getting certain messages from us, such as digests, newsletters, and activity notifications, by following the instructions contained within those communications or by visiting the Settings page of your account. Even if you opt out, we may still send you emails regarding your account or our ongoing business relationships.
Mobile Push Notifications
We may send push notifications to your mobile device with your permission. You can cancel these messages at any time by modifying your mobile device's notification settings.
YOUR CALIFORNIA PRIVACY RIGHTS
The California Consumer Privacy Act, or "CCPA" (Cal. Civ. Code 1798.100 et seq. ), grants California residents some rights regarding their personal data. If you are a California resident, you are subject to this clause.
We have collected the following categories of personal information over the past year: identifiers, commercial information, internet or other electronic network activity information, and conclusions. Please refer to the section titled "Collection of Information" for specifics regarding the data points we gather and the sorts of sources from which we acquire them. We collect personal information for the business and marketing purposes outlined in the section on Use of Information. In the past 12 months, we have shared the following types of personal information to the following groups of recipients for business purposes:
Category of Personal Information: Identifiers
Categories of Recipients: Analytics Providers, Communication Providers, Custom Service Providers, Fraud Prevention and Security Providers, Infrastructure Providers, Marketing Providers, Payment Processors
Category of Personal Information: Commercial Information
Categories of Recipients: Analytics Providers, Infrastructure Providers, Payment Processors
Category of Personal Information: Internet or Other Electronic Network Activity Information
Categories of Recipients: Analytics Providers, Infrastructure Providers
Category of Personal Information: Inferences
Categories of Recipients: Analytics Providers, Infrastructure Providers
INTΞGRITY does not sell personally identifiable information.
You have the right, subject to certain limitations: (1) to request more information about the categories and specific pieces of personal information we collect, use, and disclose about you; (2) to request the deletion of your personal information; (3) to opt out of any future sales of your personal information; and (4) to not be discriminated against for exercising these rights. You may submit these requests by email to hello@int3grity.com. We shall not treat you differently if you exercise your rights under the CCPA.
If we receive your request from an authorized agent, we may request proof that you have granted the agent a valid power of attorney or that the agent otherwise possesses valid written authorization to submit requests on your behalf. This may involve requiring identity verification. Please contact us if you are an authorized agent wishing to make a request.
ADDITIONAL DISCLOSURES FOR INDIVIDUALS IN EUROPE
This section applies to you if you are based in the European Economic Area ("EEA"), the United Kingdom, or Switzerland and have specific rights and safeguards regarding the processing of your personal data under relevant law.
Legal Justification for Processing
We will process your personal information based on the following legal grounds:
To fulfill our obligations under our agreement with you (e.g., providing the products and services you requested).
When we have a legitimate interest in processing your personal information to operate our business or to safeguard our legitimate interests, we will do so (e.g., to provide, maintain, and improve our products and services, conduct data analytics, and communicate with you).
To meet our legal responsibilities (e.g., to maintain a record of your consents and track those who have opted out of non-administrative communications).
If we have your permission to do so (e.g., when you opt in to receive non-administrative communications from us). When consent is the legal basis for our processing of your personal information, you may at any time withdraw your consent.
Data Retention
We retain the personal information associated with your account so long as your account is active. If you close your account, your account information will be deleted within 14 days. We retain other personal data for as long as is required to fulfill the objectives for which it was obtained and for other legitimate business purposes, such as to meet our legal, regulatory, or other compliance responsibilities.
Data Access Requests
You have the right to request access to the personal data we hold on you and to get your data in a portable format, to request that your personal data be rectified or erased, and to object to or request that we restrict particular processing, subject to certain limitations. To assert your legal rights:
If you sign up for an INTΞGRITY account, you can request an export of your personal information at any time via the Settings website, or by visiting Settings and selecting Account from inside our app.
You can edit the information linked with your account on the Settings website, or by navigating to Settings and then Account in our app, and the Customize Your Interests page.
You may withdraw consent at any time by deleting your account via the Settings page, or by visiting Settings and then selecting Account within our app (except to the extent INTΞGRITY is prevented by law from deleting your information).
You may object to the use of your personal information at any time by contacting hello@int3grity.com.
Questions or Complaints
If we are unable to settle your concern over our processing of personal data, you have the right to file a complaint with the Data Protection Authority in your country. The links below provide access to the contact information for your Data Protection Authority.
For people in the EEA, please visit https://edpb.europa.eu/about-edpb/board/members en.
For persons in the United Kingdom, please visit https://ico.org.uk/global/contact-us.
For people in Switzerland: https://www.edoeb.admin.ch/edoeb/en/home/the-fdpic/contact.html
CONTACT US
Please contact us at hello@int3grity.com if you have any queries regarding this Privacy Statement.

Victoria Kurichenko
3 years ago
What Happened After I Posted an AI-Generated Post on My Website
This could cost you.

Content creators may have heard about Google's "Helpful content upgrade."
This change is another Google effort to remove low-quality, repetitive, and AI-generated content.
Why should content creators care?
Because too much content manipulates search results.
My experience includes the following.
Website admins seek high-quality guest posts from me. They send me AI-generated text after I say "yes." My readers are irrelevant. Backlinks are needed.
Companies copy high-ranking content to boost their Google rankings. Unfortunately, it's common.
What does this content offer?
Nothing.
Despite Google's updates and efforts to clean search results, webmasters create manipulative content.
As a marketer, I knew about AI-powered content generation tools. However, I've never tried them.
I use old-fashioned content creation methods to grow my website from 0 to 3,000 monthly views in one year.
Last year, I launched a niche website.
I do keyword research, analyze search intent and competitors' content, write an article, proofread it, and then optimize it.
This strategy is time-consuming.
But it yields results!
Here's proof from Google Analytics:
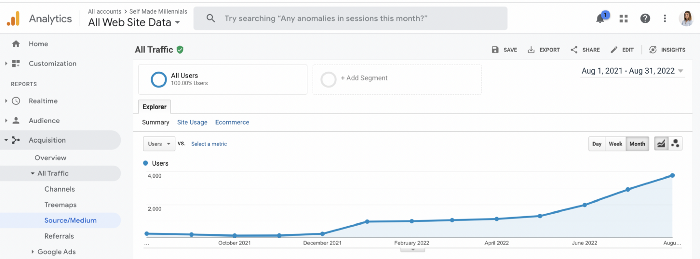
Proven strategies yield promising results.
To validate my assumptions and find new strategies, I run many experiments.
I tested an AI-powered content generator.
I used a tool to write this Google-optimized article about SEO for startups.
I wanted to analyze AI-generated content's Google performance.
Here are the outcomes of my test.
First, quality.
I dislike "meh" content. I expect articles to answer my questions. If not, I've wasted my time.
My essays usually include research, personal anecdotes, and what I accomplished and achieved.
AI-generated articles aren't as good because they lack individuality.
Read my AI-generated article about startup SEO to see what I mean.
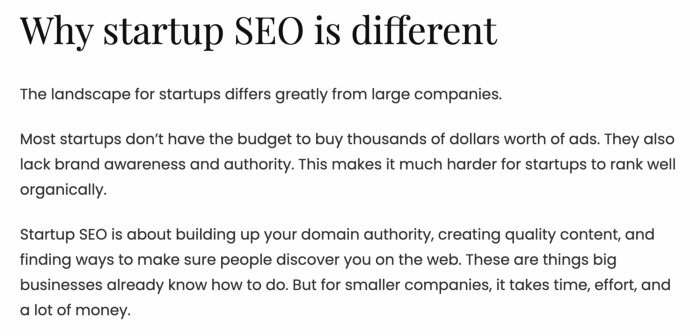
It's dry and shallow, IMO.
It seems robotic.
I'd use quotes and personal experience to show how SEO for startups is different.
My article paraphrases top-ranked articles on a certain topic.
It's readable but useless. Similar articles abound online. Why read it?
AI-generated content is low-quality.
Let me show you how this content ranks on Google.
The Google Search Console report shows impressions, clicks, and average position.
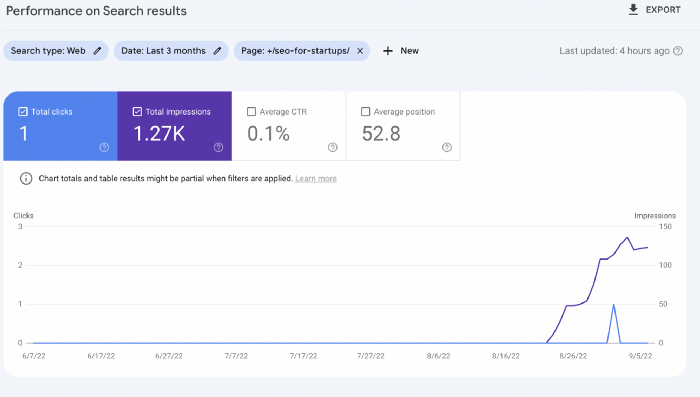
Low numbers.
No one opens the 5th Google search result page to read the article. Too far!
You may say the new article will improve.
Marketing-wise, I doubt it.
This article is shorter and less comprehensive than top-ranking pages. It's unlikely to win because of this.
AI-generated content's terrible reality.
I'll compare how this content I wrote for readers and SEO performs.
Both the AI and my article are fresh, but trends are emerging.
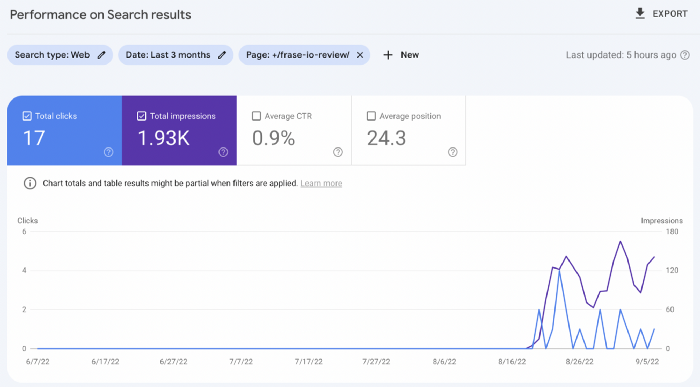
My article's CTR and average position are higher.
I spent a week researching and producing that piece, unlike AI-generated content. My expert perspective and unique consequences make it interesting to read.
Human-made.
In summary
No content generator can duplicate a human's tone, writing style, or creativity. Artificial content is always inferior.
Not "bad," but inferior.
Demand for content production tools will rise despite Google's efforts to eradicate thin content.
Most won't spend hours producing link-building articles. Costly.
As guest and sponsored posts, artificial content will thrive.
Before accepting a new arrangement, content creators and website owners should consider this.

Isaac Benson
3 years ago
What's the difference between Proof-of-Time and Proof-of-History?

Blockchain validates transactions with consensus algorithms. Bitcoin and Ethereum use Proof-of-Work, while Polkadot and Cardano use Proof-of-Stake.
Other consensus protocols are used to verify transactions besides these two. This post focuses on Proof-of-Time (PoT), used by Analog, and Proof-of-History (PoH), used by Solana as a hybrid consensus protocol.
PoT and PoH may seem similar to users, but they are actually very different protocols.
Proof-of-Time (PoT)
Analog developed Proof-of-Time (PoT) based on Delegated Proof-of-Stake (DPoS). Users select "delegates" to validate the next block in DPoS. PoT uses a ranking system, and validators stake an equal amount of tokens. Validators also "self-select" themselves via a verifiable random function."
The ranking system gives network validators a performance score, with trustworthy validators with a long history getting higher scores. System also considers validator's fixed stake. PoT's ledger is called "Timechain."
Voting on delegates borrows from DPoS, but there are changes. PoT's first voting stage has validators (or "time electors" putting forward a block to be included in the ledger).
Validators are chosen randomly based on their ranking score and fixed stake. One validator is chosen at a time using a Verifiable Delay Function (VDF).
Validators use a verifiable delay function to determine if they'll propose a Timechain block. If chosen, they validate the transaction and generate a VDF proof before submitting both to other Timechain nodes.
This leads to the second process, where the transaction is passed through 1,000 validators selected using the same method. Each validator checks the transaction to ensure it's valid.
If the transaction passes, validators accept the block, and if over 2/3 accept it, it's added to the Timechain.
Proof-of-History (PoH)
Proof-of-History is a consensus algorithm that proves when a transaction occurred. PoH uses a VDF to verify transactions, like Proof-of-Time. Similar to Proof-of-Work, VDFs use a lot of computing power to calculate but little to verify transactions, similar to (PoW).
This shows users and validators how long a transaction took to verify.
PoH uses VDFs to verify event intervals. This process uses cryptography to prevent determining output from input.
The outputs of one transaction are used as inputs for the next. Timestamps record the inputs' order. This checks if data was created before an event.
PoT vs. PoH
PoT and PoH differ in that:
PoT uses VDFs to select validators (or time electors), while PoH measures time between events.
PoH uses a VDF to validate transactions, while PoT uses a ranking system.
PoT's VDF-elected validators verify transactions proposed by a previous validator. PoH uses a VDF to validate transactions and data.
Conclusion
Both Proof-of-Time (PoT) and Proof-of-History (PoH) validate blockchain transactions differently. PoT uses a ranking system to randomly select validators to verify transactions.
PoH uses a Verifiable Delay Function to validate transactions, verify how much time has passed between two events, and allow validators to quickly verify a transaction without malicious actors knowing the input.