


More on Web3 & Crypto

Juxtathinka
4 years ago
Why Is Blockchain So Popular?
What is Bitcoin?
The blockchain is a shared, immutable ledger that helps businesses record transactions and track assets. The blockchain can track tangible assets like cars, houses, and land. Tangible assets like intellectual property can also be tracked on the blockchain.
Imagine a blockchain as a distributed database split among computer nodes. A blockchain stores data in blocks. When a block is full, it is closed and linked to the next. As a result, all subsequent information is compiled into a new block that will be added to the chain once it is filled.
The blockchain is designed so that adding a transaction requires consensus. That means a majority of network nodes must approve a transaction. No single authority can control transactions on the blockchain. The network nodes use cryptographic keys and passwords to validate each other's transactions.
Blockchain History
The blockchain was not as popular in 1991 when Stuart Haber and W. Scott Stornetta worked on it. The blocks were designed to prevent tampering with document timestamps. Stuart Haber and W. Scott Stornetta improved their work in 1992 by using Merkle trees to increase efficiency and collect more documents on a single block.
In 2004, he developed Reusable Proof of Work. This system allows users to verify token transfers in real time. Satoshi Nakamoto invented distributed blockchains in 2008. He improved the blockchain design so that new blocks could be added to the chain without being signed by trusted parties.
Satoshi Nakomoto mined the first Bitcoin block in 2009, earning 50 Bitcoins. Then, in 2013, Vitalik Buterin stated that Bitcoin needed a scripting language for building decentralized applications. He then created Ethereum, a new blockchain-based platform for decentralized apps. Since the Ethereum launch in 2015, different blockchain platforms have been launched: from Hyperledger by Linux Foundation, EOS.IO by block.one, IOTA, NEO and Monero dash blockchain. The block chain industry is still growing, and so are the businesses built on them.
Blockchain Components
The Blockchain is made up of many parts:
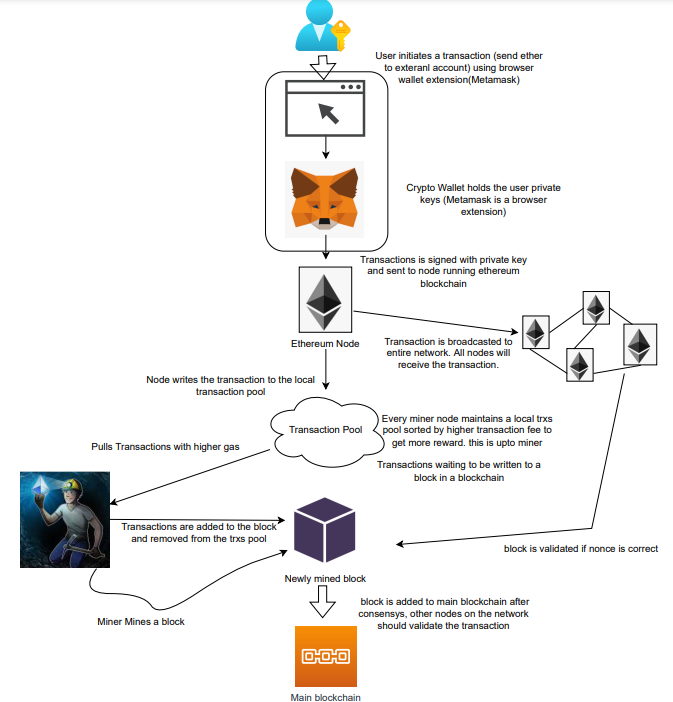
1. Node: The node is split into two parts: full and partial. The full node has the authority to validate, accept, or reject any transaction. Partial nodes or lightweight nodes only keep the transaction's hash value. It doesn't keep a full copy of the blockchain, so it has limited storage and processing power.
2. Ledger: A public database of information. A ledger can be public, decentralized, or distributed. Anyone on the blockchain can access the public ledger and add data to it. It allows each node to participate in every transaction. The distributed ledger copies the database to all nodes. A group of nodes can verify transactions or add data blocks to the blockchain.
3. Wallet: A blockchain wallet allows users to send, receive, store, and exchange digital assets, as well as monitor and manage their value. Wallets come in two flavors: hardware and software. Online or offline wallets exist. Online or hot wallets are used when online. Without an internet connection, offline wallets like paper and hardware wallets can store private keys and sign transactions. Wallets generally secure transactions with a private key and wallet address.
4. Nonce: A nonce is a short term for a "number used once''. It describes a unique random number. Nonces are frequently generated to modify cryptographic results. A nonce is a number that changes over time and is used to prevent value reuse. To prevent document reproduction, it can be a timestamp. A cryptographic hash function can also use it to vary input. Nonces can be used for authentication, hashing, or even electronic signatures.
5. Hash: A hash is a mathematical function that converts inputs of arbitrary length to outputs of fixed length. That is, regardless of file size, the hash will remain unique. A hash cannot generate input from hashed output, but it can identify a file. Hashes can be used to verify message integrity and authenticate data. Cryptographic hash functions add security to standard hash functions, making it difficult to decipher message contents or track senders.
Blockchain: Pros and Cons
The blockchain provides a trustworthy, secure, and trackable platform for business transactions quickly and affordably. The blockchain reduces paperwork, documentation errors, and the need for third parties to verify transactions.
Blockchain security relies on a system of unaltered transaction records with end-to-end encryption, reducing fraud and unauthorized activity. The blockchain also helps verify the authenticity of items like farm food, medicines, and even employee certification. The ability to control data gives users a level of privacy that no other platform can match.
In the case of Bitcoin, the blockchain can only handle seven transactions per second. Unlike Hyperledger and Visa, which can handle ten thousand transactions per second. Also, each participant node must verify and approve transactions, slowing down exchanges and limiting scalability.
The blockchain requires a lot of energy to run. In addition, the blockchain is not a hugely distributable system and it is destructible. The security of the block chain can be compromised by hackers; it is not completely foolproof. Also, since blockchain entries are immutable, data cannot be removed. The blockchain's high energy consumption and limited scalability reduce its efficiency.
Why Is Blockchain So Popular?
The blockchain is a technology giant. In 2018, 90% of US and European banks began exploring blockchain's potential. In 2021, 24% of companies are expected to invest $5 million to $10 million in blockchain. By the end of 2024, it is expected that corporations will spend $20 billion annually on blockchain technical services.
Blockchain is used in cryptocurrency, medical records storage, identity verification, election voting, security, agriculture, business, and many other fields. The blockchain offers a more secure, decentralized, and less corrupt system of making global payments, which cryptocurrency enthusiasts love. Users who want to save time and energy prefer it because it is faster and less bureaucratic than banking and healthcare systems.
Most organizations have jumped on the blockchain bandwagon, and for good reason: the blockchain industry has never had more potential. The launch of IBM's Blockchain Wire, Paystack, Aza Finance and Bloom are visible proof of the wonders that the blockchain has done. The blockchain's cryptocurrency segment may not be as popular in the future as the blockchain's other segments, as evidenced by the various industries where it is used. The blockchain is here to stay, and it will be discussed for a long time, not just in tech, but in many industries.
Read original post here
Olga Kharif
3 years ago
A month after freezing customer withdrawals, Celsius files for bankruptcy.

Alex Mashinsky, CEO of Celsius, speaks at Web Summit 2021 in Lisbon.
Celsius Network filed for Chapter 11 bankruptcy a month after freezing customer withdrawals, joining other crypto casualties.
Celsius took the step to stabilize its business and restructure for all stakeholders. The filing was done in the Southern District of New York.
The company, which amassed more than $20 billion by offering 18% interest on cryptocurrency deposits, paused withdrawals and other functions in mid-June, citing "extreme market conditions."
As the Fed raises interest rates aggressively, it hurts risk sentiment and squeezes funding costs. Voyager Digital Ltd. filed for Chapter 11 bankruptcy this month, and Three Arrows Capital has called in liquidators.
Celsius called the pause "difficult but necessary." Without the halt, "the acceleration of withdrawals would have allowed certain customers to be paid in full while leaving others to wait for Celsius to harvest value from illiquid or longer-term asset deployment activities," it said.
Celsius declined to comment. CEO Alex Mashinsky said the move will strengthen the company's future.
The company wants to keep operating. It's not requesting permission to allow customer withdrawals right now; Chapter 11 will handle customer claims. The filing estimates assets and liabilities between $1 billion and $10 billion.
Celsius is advised by Kirkland & Ellis, Centerview Partners, and Alvarez & Marsal.
Yield-promises
Celsius promised 18% returns on crypto loans. It lent those coins to institutional investors and participated in decentralized-finance apps.
When TerraUSD (UST) and Luna collapsed in May, Celsius pulled its funds from Terra's Anchor Protocol, which offered 20% returns on UST deposits. Recently, another large holding, staked ETH, or stETH, which is tied to Ether, became illiquid and discounted to Ether.
The lender is one of many crypto companies hurt by risky bets in the bear market. Also, Babel halted withdrawals. Voyager Digital filed for bankruptcy, and crypto hedge fund Three Arrows Capital filed for Chapter 15 bankruptcy.
According to blockchain data and tracker Zapper, Celsius repaid all of its debt in Aave, Compound, and MakerDAO last month.
Celsius charged Symbolic Capital Partners Ltd. 2,000 Ether as collateral for a cash loan on June 13. According to company filings, Symbolic was charged 2,545.25 Ether on June 11.
In July 6 filings, it said it reshuffled its board, appointing two new members and firing others.

TheRedKnight
3 years ago
Say goodbye to Ponzi yields - A new era of decentralized perpetual
Decentralized perpetual may be the next crypto market boom; with tons of perpetual popping up, let's look at two protocols that offer organic, non-inflationary yields.
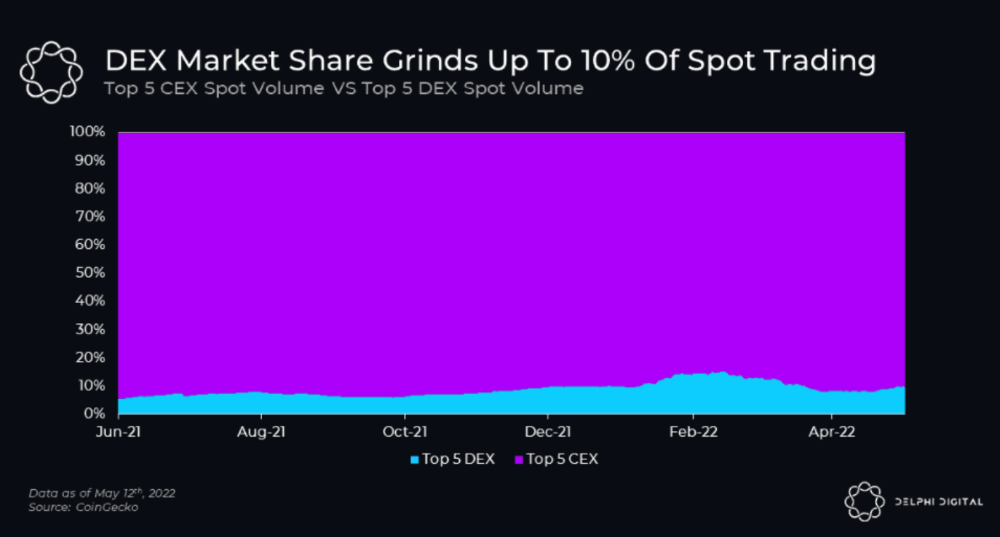
Decentralized derivatives exchanges' market share has increased tenfold in a year, but it's still 2% of CEXs'. DEXs have a long way to go before they can compete with centralized exchanges in speed, liquidity, user experience, and composability.
I'll cover gains.trade and GMX protocol in Polygon, Avalanche, and Arbitrum. Both protocols support leveraged perpetual crypto, stock, and Forex trading.
Why these protocols?
Decentralized GMX Gains protocol
Organic yield: path to sustainability
I've never trusted Defi's non-organic yields. Example: XYZ protocol. 20–75% of tokens may be set aside as farming rewards to provide liquidity, according to tokenomics.
Say you provide ETH-USDC liquidity. They advertise a 50% APR reward for this pair, 10% from trading fees and 40% from farming rewards. Only 10% is real, the rest is "Ponzi." The "real" reward is in protocol tokens.
Why keep this token? Governance voting or staking rewards are promoted services.
Most liquidity providers expect compensation for unused tokens. Basic psychological principles then? — Profit.
Nobody wants governance tokens. How many out of 100 care about the protocol's direction and will vote?
Staking increases your token's value. Currently, they're mostly non-liquid. If the protocol is compromised, you can't withdraw funds. Most people are sceptical of staking because of this.
"Free tokens," lack of use cases, and skepticism lead to tokens moving south. No farming reward protocols have lasted.
It may have shown strength in a bull market, but what about a bear market?
What is decentralized perpetual?
A perpetual contract is a type of futures contract that doesn't expire. So one can hold a position forever.
You can buy/sell any leveraged instruments (Long-Short) without expiration.
In centralized exchanges like Binance and coinbase, fees and revenue (liquidation) go to the exchanges, not users.
Users can provide liquidity that traders can use to leverage trade, and the revenue goes to liquidity providers.
Gains.trade and GMX protocol are perpetual trading platforms with a non-inflationary organic yield for liquidity providers.
GMX protocol
GMX is an Arbitrum and Avax protocol that rewards in ETH and Avax. GLP uses a fast oracle to borrow the "true price" from other trading venues, unlike a traditional AMM.
GLP and GMX are protocol tokens. GLP is used for leveraged trading, swapping, etc.
GLP is a basket of tokens, including ETH, BTC, AVAX, stablecoins, and UNI, LINK, and Stablecoins.
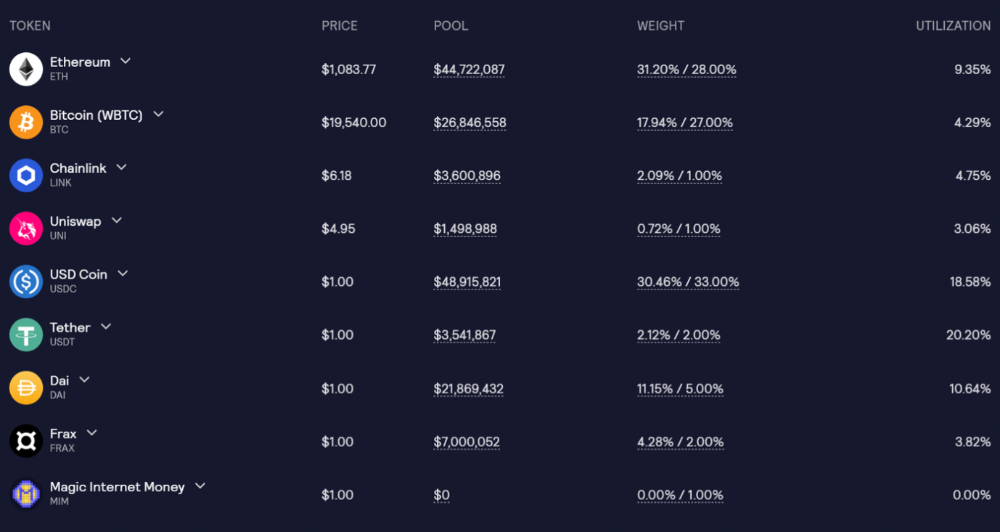
GLP composition on arbitrum
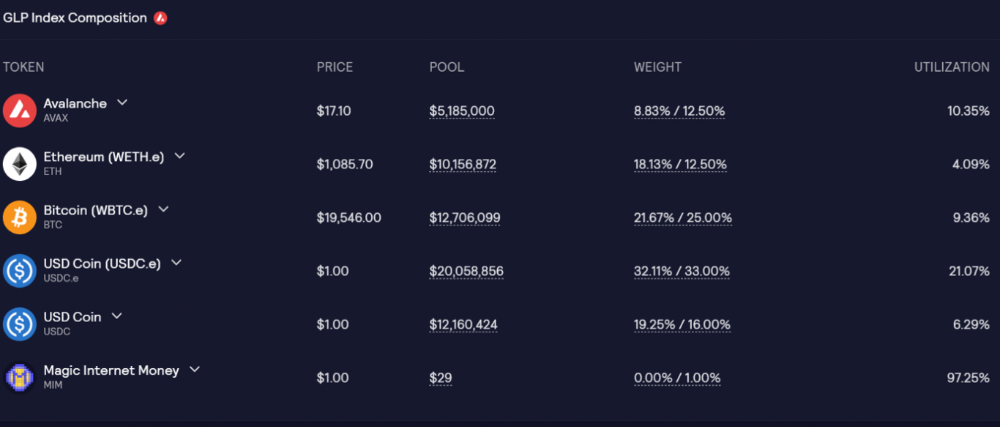
GLP composition on Avalanche
GLP token rebalances based on usage, providing liquidity without loss.
Protocol "runs" on Staking GLP. Depending on their chain, the protocol will reward users with ETH or AVAX. Current rewards are 22 percent (15.71 percent in ETH and the rest in escrowed GMX) and 21 percent (15.72 percent in AVAX and the rest in escrowed GMX). escGMX and ETH/AVAX percentages fluctuate.
Where is the yield coming from?
Swap fees, perpetual interest, and liquidations generate yield. 70% of fees go to GLP stakers, 30% to GMX. Organic yields aren't paid in inflationary farm tokens.
Escrowed GMX is vested GMX that unlocks in 365 days. To fully unlock GMX, you must farm the Escrowed GMX token for 365 days. That means less selling pressure for the GMX token.
GMX's status
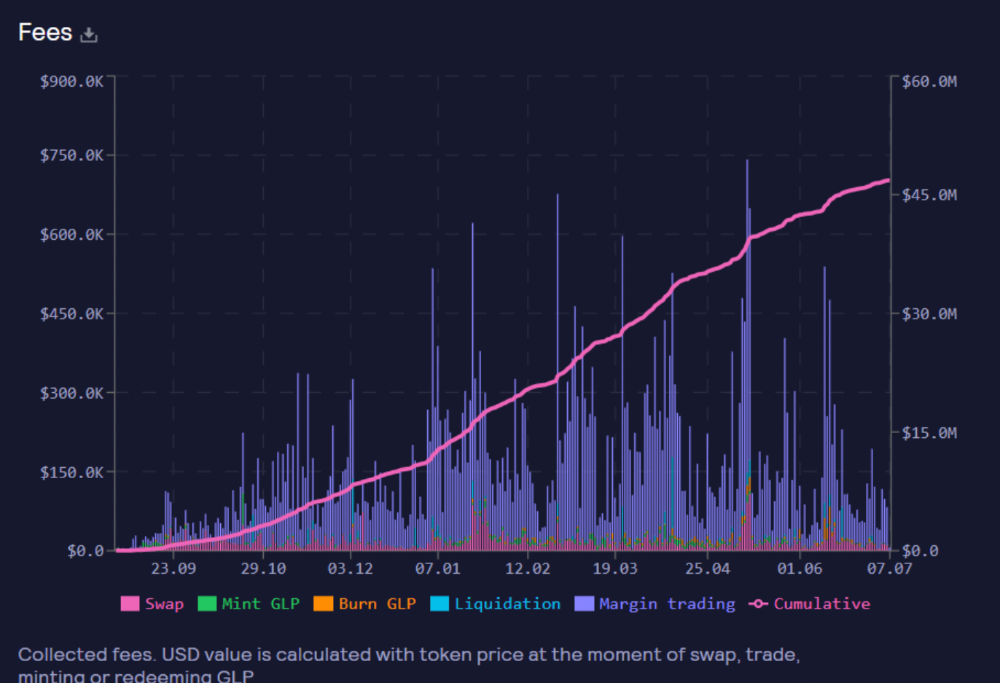
These are the fees in Arbitrum in the past 11 months by GMX.
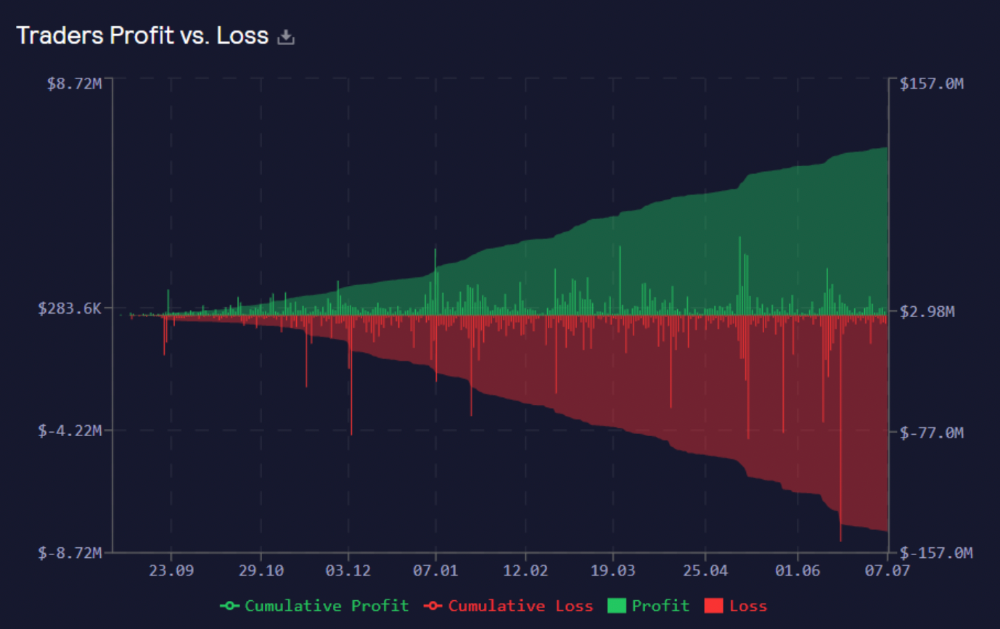
GMX works like a casino, which increases fees. Most fees come from Margin trading, which means most traders lose money; this money goes to the casino, or GLP stakers.
Strategies
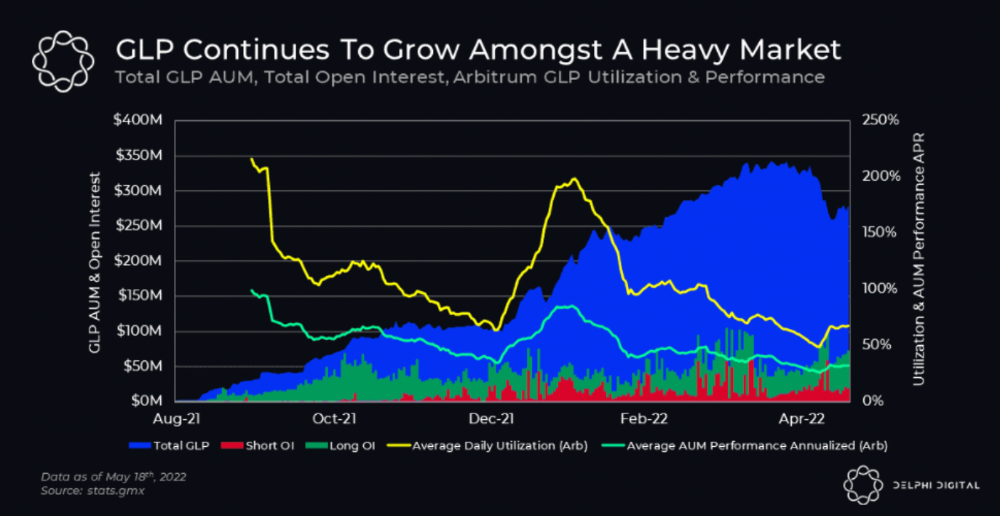
My personal strategy is to DCA into GLP when markets hit bottom and stake it; GLP will be less volatile with extra staking rewards.
GLP YoY return vs. naked buying
Let's say I invested $10,000 in BTC, AVAX, and ETH in January.
BTC price: 47665$
ETH price: 3760$
AVAX price: $145
Current prices
BTC $21,000 (Down 56 percent )
ETH $1233 (Down 67.2 percent )
AVAX $20.36 (Down 85.95 percent )
Your $10,000 investment is now worth around $3,000.
How about GLP? My initial investment is 50% stables and 50% other assets ( Assuming the coverage ratio for stables is 50 percent at that time)
Without GLP staking yield, your value is $6500.
Let's assume the average APR for GLP staking is 23%, or $1500. So 8000$ total. It's 50% safer than holding naked assets in a bear market.
In a bull market, naked assets are preferable to GLP.
Short farming using GLP
Simple GLP short farming.
You use a stable asset as collateral to borrow AVAX. Sell it and buy GLP. Even if GLP rises, it won't rise as fast as AVAX, so we can get yields.
Let's do the maths
You deposit $10,000 USDT in Aave and borrow Avax. Say you borrow $8,000; you sell it, buy GLP, and risk 20%.
After a year, ETH, AVAX, and BTC rise 20%. GLP is $8800. $800 vanishes. 20% yields $1600. You're profitable. Shorting Avax costs $1600. (Assumptions-ETH, AVAX, BTC move the same, GLP yield is 20%. GLP has a 50:50 stablecoin/others ratio. Aave won't liquidate
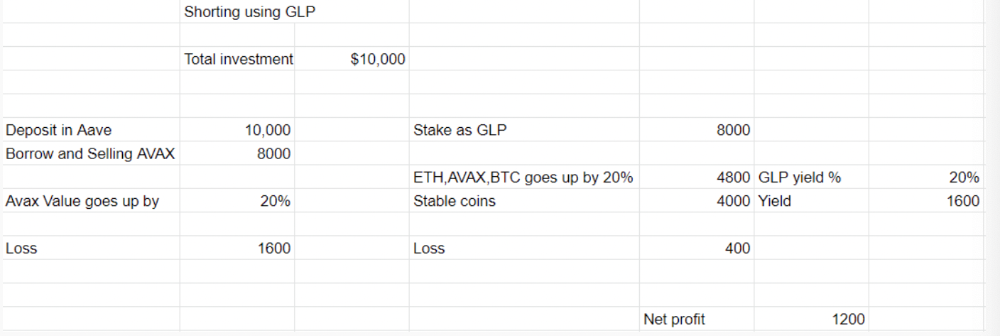
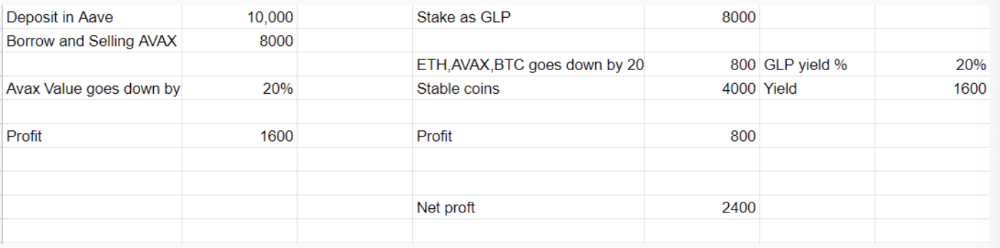
In naked Avax shorting, Avax falls 20% in a year. You'll make $1600. If you buy GLP and stake it using the sold Avax and BTC, ETH and Avax go down by 20% - your profit is 20%, but with the yield, your total gain is $2400.
Issues with GMX
GMX's historical funding rates are always net positive, so long always pays short. This makes long-term shorts less appealing.
Oracle price discovery isn't enough. This limitation doesn't affect Bitcoin and ETH, but it affects less liquid assets. Traders can buy and sell less liquid assets at a lower price than their actual cost as long as GMX exists.
As users must provide GLP liquidity, adding more assets to GMX will be difficult. Next iteration will have synthetic assets.
Gains Protocol
Best leveraged trading platform. Smart contract-based decentralized protocol. 46 crypto pairs can be leveraged 5–150x and 10 Forex pairs 5–1000x. $10 DAI @ 150x (min collateral x leverage pos size is $1500 DAI). No funding fees, no KYC, trade DAI from your wallet, keep funds.
DAI single-sided staking and the GNS-DAI pool are important parts of Gains trading. GNS-DAI stakers get 90% of trading fees and 100% swap fees. 10 percent of trading fees go to DAI stakers, which is currently 14 percent!
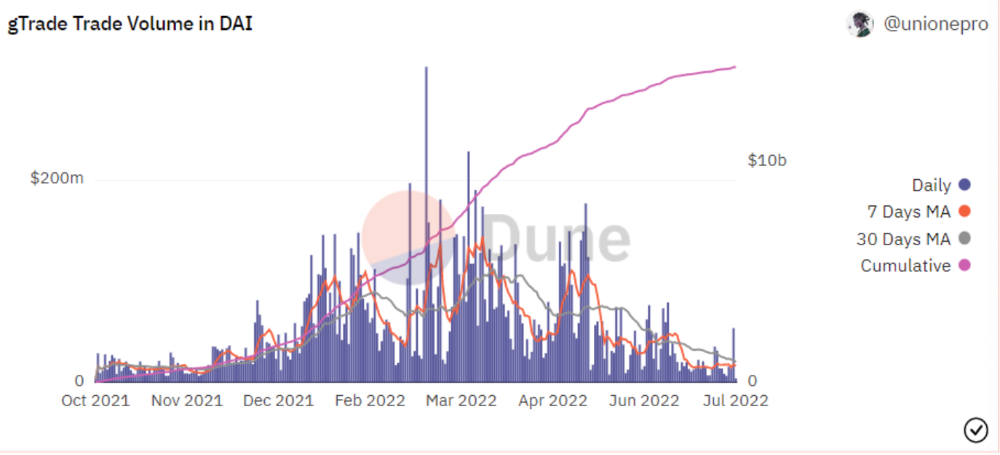
Trade volume
When a trader opens a trade, the leverage and profit are pulled from the DAI pool. If he loses, the protocol yield goes to the stakers.
If the trader's win rate is high and the DAI pool slowly depletes, the GNS token is minted and sold to refill DAI. Trader losses are used to burn GNS tokens. 25%+ of GNS is burned, making it deflationary.
Due to high leverage and volatility of crypto assets, most traders lose money and the protocol always wins, keeping GNS deflationary.
Gains uses a unique decentralized oracle for price feeds, which is better for leverage trading platforms. Let me explain.
Gains uses chainlink price oracles, not its own price feeds. Chainlink oracles only query centralized exchanges for price feeds every minute, which is unsuitable for high-precision trading.
Gains created a custom oracle that queries the eight chainlink nodes for the current price and, on average, for trade confirmation. This model eliminates every-second inquiries, which waste gas but are more efficient than chainlink's per-minute price.
This price oracle helps Gains open and close trades instantly, eliminate scam wicks, etc.
Other benefits include:
Stop-loss guarantee (open positions updated)
No scam wicks
Spot-pricing
Highest possible leverage
Fixed-spreads. During high volatility, a broker can increase the spread, which can hit your stop loss without the price moving.
Trade directly from your wallet and keep your funds.
>90% loss before liquidation (Some platforms liquidate as little as -50 percent)
KYC-free
Directly trade from wallet; keep funds safe
Further improvements
GNS-DAI liquidity providers fear the impermanent loss, so the protocol is migrating to its own liquidity and single staking GNS vaults. This allows users to stake GNS without permanent loss and obtain 90% DAI trading fees by staking. This starts in August.
Their upcoming improvements can be found here.
Gains constantly add new features and change pairs. It's an interesting protocol.
Conclusion
Next bull run, watch decentralized perpetual protocols. Effective tokenomics and non-inflationary yields may attract traders and liquidity providers. But still, there is a long way for them to develop, and I don't see them tackling the centralized exchanges any time soon until they fix their inherent problems and improve fast enough.
Read the full post here.
You might also like

Cory Doctorow
3 years ago
The current inflation is unique.
New Stiglitz just dropped.
Here's the inflation story everyone believes (warning: it's false): America gave the poor too much money during the recession, and now the economy is awash with free money, which made them so rich they're refusing to work, meaning the economy isn't making anything. Prices are soaring due to increased cash and missing labor.
Lawrence Summers says there's only one answer. We must impoverish the poor: raise interest rates, cause a recession, and eliminate millions of jobs, until the poor are stripped of their underserved fortunes and return to work.
https://pluralistic.net/2021/11/20/quiet-part-out-loud/#profiteering
This is nonsense. Countries around the world suffered inflation during and after lockdowns, whether they gave out humanitarian money to keep people from starvation. America has slightly greater inflation than other OECD countries, but it's not due to big relief packages.
The Causes of and Responses to Today's Inflation, a Roosevelt Institute report by Nobel-winning economist Joseph Stiglitz and macroeconomist Regmi Ira, debunks this bogus inflation story and offers a more credible explanation for inflation.
https://rooseveltinstitute.org/wp-content/uploads/2022/12/RI CausesofandResponsestoTodaysInflation Report 202212.pdf
Sharp interest rate hikes exacerbate the slump and increase inflation, the authors argue. They compare monetary policy inflation cures to medieval bloodletting, where doctors repeated the same treatment until the patient recovered (for which they received credit) or died (which was more likely).
Let's discuss bloodletting. Inflation hawks warn of the wage price spiral, when inflation rises and powerful workers bargain for higher pay, driving up expenses, prices, and wages. This is the fairy-tale narrative of the 1970s, and it's true except that OPEC's embargo drove up oil prices, which produced inflation. Oh well.
Let's be generous to seventies-haunted inflation hawks and say we're worried about a wage-price spiral. Fantastic! No. Real wages are 2.3% lower than they were in Oct 2021 after peaking in June at 4.8%.
Why did America's powerful workers take a paycut rather than demand inflation-based pay? Weak unions, globalization, economic developments.
Workers don't expect inflation to rise, so they're not requesting inflationary hikes. Inflationary expectations have remained moderate, consistent with our data interpretation.
https://www.newyorkfed.org/microeconomics/sce#/
Neither are workers. Working people see surplus savings as wealth and spend it gradually over their lives, despite rising demand. People may have saved money by staying in during the lockdown, but they don't eat out every night to make up for it. Instead, they keep those savings as precautionary balances. This is why the economy is lagging.
People don't buy non-traded goods with pandemic savings (basically, imports). Imports don't multiply like domestic purchases. If you buy a loaf of bread from the corner baker for $1 and they spend it at the tavern across the street, that dollar generates $3 in economic activity. Spending a dollar on foreign goods leaves the country and any multiplier effect happens there, not in the US.
Only marginally higher wages. The ECI is up 1.6% from 2019. Almost all gains went to the 25% lowest-paid Americans. Contrary to the inflation worry about too much savings, these workers don't make enough to save, even post-pandemic.
Recreation and transit spending are at or below pre-pandemic levels. Higher food and hotel prices (which doesn’t mean we’re buying more food than we were in 2019, just that it costs more).
What causes inflation if not greedy workers, free money, and high demand? The most expensive domestic goods produce the biggest revenues for their manufacturers. They charge you more without paying their workers or suppliers more.
The largest price-gougers are funneling their earnings to rich people who store it offshore through stock buybacks and dividends. A $1 billion stock buyback doesn't buy $1 billion in bread.
Five factors influence US inflation today:
I. Price rises for energy and food
II. shifts in consumer tastes
III. supply interruptions (mainly autos);
IV. increased rents (due to telecommuting);
V. monopoly (AKA price-gouging).
None can be remedied by raising interest rates or laying off workers.
Russia's invasion of Ukraine, omicron, and China's Zero Covid policy all disrupted the flow of food, energy, and production inputs. The price went higher because we made less.
After Russia invaded Ukraine, oil prices spiked, and sanctions made it worse. But that was February. By October, oil prices had returned to pre-pandemic, 2015 levels attributable to global economic adjustments, including a shift to renewables. Every new renewable installation reduces oil consumption and affects oil prices.
High food prices have a simple solution. The US and EU have bribed farmers not to produce for 50 years. If the war continues, this program may end, and food prices may decline.
Demand changes. We want different things than in 2019, not more. During the lockdown, people substituted goods. Half of the US toilet-paper supply in 2019 was on commercial-sized rolls. This is created from different mills and stock than our toilet paper.
Lockdown pushed toilet paper demand to residential rolls, causing shortages (the TP hoarding story was just another pandemic urban legend). Because supermarket stores don't have accounts with commercial paper distributors, ordering from languishing stores was difficult. Kleenex and paper towel substitutions caused greater shortages.
All that drove increased costs in numerous product categories, and there were more cases. These increases are transient, caused by supply chain inefficiencies that are resolving.
Demand for frontline staff saw a one-time repricing of pay, which is being recouped as we speak.
Illnesses. Brittle, hollowed-out global supply chains aggravated this. The constant pursuit of cheap labor and minimal regulation by monopolies that dominate most sectors means things are manufactured in far-flung locations. Financialization means any surplus capital assets were sold off years ago, leaving firms with little production slack. After the epidemic, several of these systems took years to restart.
Automobiles are to blame. Financialization and monopolization consolidated microchip and auto production in Taiwan and China. When the lockdowns came, these worldwide corporations cancelled their chip orders, and when they placed fresh orders, they were at the back of the line.
That drove up car prices, which is why the US has slightly higher inflation than other wealthy countries: the economy is car-centric. Automobile prices account for 9% of the CPI. France: 3.6%
Rent shocks and telecommuting. After the epidemic, many professionals moved to exurbs, small towns, and the countryside to work from home. As commercial properties were vacated, it was impractical to adapt them for residential use due to planning restrictions. Addressing these restrictions will cut rent prices more than raising inflation rates, which halts housing construction.
Statistical mirages cause some rent inflation. The CPI estimates what homeowners would pay to rent their properties. When rents rise in your neighborhood, the CPI believes you're spending more on rent even if you have a 30-year fixed-rate mortgage.
Market dominance. Almost every area of the US economy is dominated by monopolies, whose CEOs disclose on investor calls that they use inflation scares to jack up prices and make record profits.
https://pluralistic.net/2022/02/02/its-the-economy-stupid/#overinflated
Long-term profit margins are rising. Markups averaged 26% from 1960-1980. 2021: 72%. Market concentration explains 81% of markup increases (e.g. monopolization). Profit margins reach a 70-year high in 2022. These elements interact. Monopolies thin out their sectors, making them brittle and sensitive to shocks.
If we're worried about a shrinking workforce, there are more humanitarian and sensible solutions than causing a recession and mass unemployment. Instead, we may boost US production capacity by easing workers' entry into the workforce.
https://pluralistic.net/2022/06/01/factories-to-condos-pipeline/#stuff-not-money
US female workforce participation ranks towards the bottom of developed countries. Many women can't afford to work due to America's lack of daycare, low earnings, and bad working conditions in female-dominated fields. If America doesn't have enough workers, childcare subsidies and minimum wages can help.
By contrast, driving the country into recession with interest-rate hikes will reduce employment, and the last recruited (women, minorities) are the first fired and the last to be rehired. Forcing America into recession won't enhance its capacity to create what its people want; it will degrade it permanently.
Nothing the Fed does can stop price hikes from international markets, lack of supply chain investment, COVID-19 disruptions, climate change, the Ukraine war, or market power. They can worsen it. When supply problems generate inflation, raising interest rates decreases investments that can remedy shortages.
Increasing interest rates won't cut rents since landlords pass on the expenses and high rates restrict investment in new dwellings where tenants could escape the costs.
Fixing the supply fixes supply-side inflation. Increase renewables investment (as the Inflation Reduction Act does). Monopolies can be busted (as the IRA does). Reshore key goods (as the CHIPS Act does). Better pay and child care attract employees.
Windfall taxes can claw back price-gouging corporations' monopoly earnings.
https://pluralistic.net/2022/03/15/sanctions-financing/#soak-the-rich
In 2008, we ruled out fiscal solutions (bailouts for debtors) and turned to monetary policy (bank bailouts). This preserved the economy but increased inequality and eroded public trust.
Monetary policy won't help. Even monetary policy enthusiasts recognize an 18-month lag between action and result. That suggests monetary tightening is unnecessary. Like the medieval bloodletter, central bankers whose interest rate hikes don't work swiftly may do more of the same, bringing the economy to its knees.
Interest rates must rise. Zero-percent interest fueled foolish speculation and financialization. Increasing rates will stop this. Increasing interest rates will destroy the economy and dampen inflation.
Then what? All recent evidence indicate to inflation decreasing on its own, as the authors argue. Supply side difficulties are finally being overcome, evidence shows. Energy and food prices are showing considerable mean reversion, which is disinflationary.
The authors don't recommend doing nothing. Best case scenario, they argue, is that the Fed won't keep raising interest rates until morale improves.

Alex Mathers
25 years ago
400 articles later, nobody bothered to read them.

Writing for readers:
14 years of daily writing.
I post practically everything on social media. I authored hundreds of articles, thousands of tweets, and numerous volumes to almost no one.
Tens of thousands of readers regularly praise me.
I despised writing. I'm stuck now.
I've learned what readers like and what doesn't.
Here are some essential guidelines for writing with impact:
Readers won't understand your work if you can't.
Though obvious, this slipped me up. Share your truths.
Stories engage human brains.
Showing the journey of a person from worm to butterfly inspires the human spirit.
Overthinking hinders powerful writing.
The best ideas come from inner understanding in between thoughts.
Avoid writing to find it. Write.
Writing a masterpiece isn't motivating.
Write for five minutes to simplify. Step-by-step, entertaining, easy steps.
Good writing requires a willingness to make mistakes.
So write loads of garbage that you can edit into a good piece.
Courageous writing.
A courageous story will move readers. Personal experience is best.
Go where few dare.
Templates, outlines, and boundaries help.
Limitations enhance writing.
Excellent writing is straightforward and readable, removing all the unnecessary fat.
Use five words instead of nine.
Use ordinary words instead of uncommon ones.
Readers desire relatability.
Too much perfection will turn it off.
Write to solve an issue if you can't think of anything to write.
Instead, read to inspire. Best authors read.
Every tweet, thread, and novel must have a central idea.
What's its point?
This can make writing confusing.
️ Don't direct your reader.
Readers quit reading. Demonstrate, describe, and relate.
Even if no one responds, have fun. If you hate writing it, the reader will too.
Benjamin Lin
3 years ago
I sold my side project for $20,000: 6 lessons I learned
How I monetized and sold an abandoned side project for $20,000

The Origin Story
I've always wanted to be an entrepreneur but never succeeded. I often had business ideas, made a landing page, and told my buddies. Never got customers.
In April 2021, I decided to try again with a new strategy. I noticed that I had trouble acquiring an initial set of customers, so I wanted to start by acquiring a product that had a small user base that I could grow.
I found a SaaS marketplace called MicroAcquire.com where you could buy and sell SaaS products. I liked Shareit.video, an online Loom-like screen recorder.
Shareit.video didn't generate revenue, but 50 people visited daily to record screencasts.
Purchasing a Failed Side Project
I eventually bought Shareit.video for $12,000 from its owner.
$12,000 was probably too much for a website without revenue or registered users.
I thought time was most important. I could have recreated the website, but it would take months. $12,000 would give me an organized code base and a working product with a few users to monetize.

I considered buying a screen recording website and trying to grow it versus buying a new car or investing in crypto with the $12K.
Buying the website would make me a real entrepreneur, which I wanted more than anything.
Putting down so much money would force me to commit to the project and prevent me from quitting too soon.
A Year of Development
I rebranded the website to be called RecordJoy and worked on it with my cousin for about a year. Within a year, we made $5000 and had 3000 users.
We spent $3500 on ads, hosting, and software to run the business.
AppSumo promoted our $120 Life Time Deal in exchange for 30% of the revenue.
We put RecordJoy on maintenance mode after 6 months because we couldn't find a scalable user acquisition channel.
We improved SEO and redesigned our landing page, but nothing worked.

Despite not being able to grow RecordJoy any further, I had already learned so much from working on the project so I was fine with putting it on maintenance mode. RecordJoy still made $500 a month, which was great lunch money.
Getting Taken Over
One of our customers emailed me asking for some feature requests and I replied that we weren’t going to add any more features in the near future. They asked if we'd sell.
We got on a call with the customer and I asked if he would be interested in buying RecordJoy for 15k. The customer wanted around $8k but would consider it.
Since we were negotiating with one buyer, we put RecordJoy on MicroAcquire to see if there were other offers.

We quickly received 10+ offers. We got 18.5k. There was also about $1000 in AppSumo that we could not withdraw, so we agreed to transfer that over for $600 since about 40% of our sales on AppSumo usually end up being refunded.
Lessons Learned
First, create an acquisition channel
We couldn't discover a scalable acquisition route for RecordJoy. If I had to start another project, I'd develop a robust acquisition channel first. It might be LinkedIn, Medium, or YouTube.
Purchase Power of the Buyer Affects Acquisition Price
Some of the buyers we spoke to were individuals looking to buy side projects, as well as companies looking to launch a new product category. Individual buyers had less budgets than organizations.
Customers of AppSumo vary.
AppSumo customers value lifetime deals and low prices, which may not be a good way to build a business with recurring revenue. Designed for AppSumo users, your product may not connect with other users.
Try to increase acquisition trust
Acquisition often fails. The buyer can go cold feet, cease communicating, or run away with your stuff. Trusting the buyer ensures a smooth asset exchange. First acquisition meeting was unpleasant and price negotiation was tight. In later meetings, we spent the first few minutes trying to get to know the buyer’s motivations and background before jumping into the negotiation, which helped build trust.
Operating expenses can reduce your earnings.
Monitor operating costs. We were really happy when we withdrew the $5000 we made from AppSumo and Stripe until we realized that we had spent $3500 in operating fees. Spend money on software and consultants to help you understand what to build.
Don't overspend on advertising
We invested $1500 on Google Ads but made little money. For a side project, it’s better to focus on organic traffic from SEO rather than paid ads unless you know your ads are going to have a positive ROI.