


More on Marketing

M.G. Siegler
3 years ago
Apple: Showing Ads on Your iPhone
This report from Mark Gurman has stuck with me:
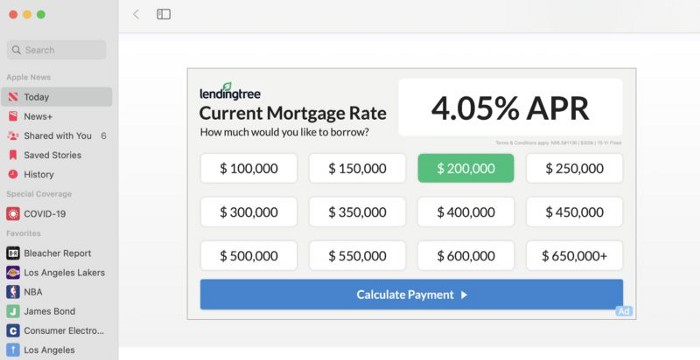
In the News and Stocks apps, the display ads are no different than what you might get on an ad-supported website. In the App Store, the ads are for actual apps, which are probably more useful for Apple users than mortgage rates. Some people may resent Apple putting ads in the News and Stocks apps. After all, the iPhone is supposed to be a premium device. Let’s say you shelled out $1,000 or more to buy one, do you want to feel like Apple is squeezing more money out of you just to use its standard features? Now, a portion of ad revenue from the News app’s Today tab goes to publishers, but it’s not clear how much. Apple also lets publishers advertise within their stories and keep the vast majority of that money. Surprisingly, Today ads also appear if you subscribe to News+ for $10 per month (though it’s a smaller number).
I use Apple News often. It's a good general news catch-up tool, like Twitter without the BS. Customized notifications are helpful. Fast and lovely. Except for advertisements. I have Apple One, which includes News+, and while I understand why the magazines still have brand ads, it's ridiculous to me that Apple enables web publishers to introduce awful ads into this experience. Apple's junky commercials are ridiculous.
We know publishers want and probably requested this. Let's keep Apple News ad-free for the much smaller percentage of paid users, and here's your portion. (Same with Stocks, which is more sillier.)
Paid app placement in the App Store is a wonderful approach for developers to find new users (though far too many of those ads are trying to trick users, in my opinion).
Apple is also planning to increase ads in its Maps app. This sounds like Google Maps, and I don't like it. I never find these relevant, and they clutter up the user experience. Apple Maps now has a UI advantage (though not a data/search one, which matters more).
Apple is nickel-and-diming its customers. We spend thousands for their products and premium services like Apple One. We all know why: income must rise, and new firms are needed to scale. This will eventually backfire.

Rita McGrath
3 years ago
Flywheels and Funnels
Traditional sales organizations used the concept of a sales “funnel” to describe the process through which potential customers move, ending up with sales at the end. Winners today have abandoned that way of thinking in favor of building flywheels — business models in which every element reinforces every other.
Ah, the marketing funnel…
Prospective clients go through a predictable set of experiences, students learn in business school marketing classes. It looks like this:
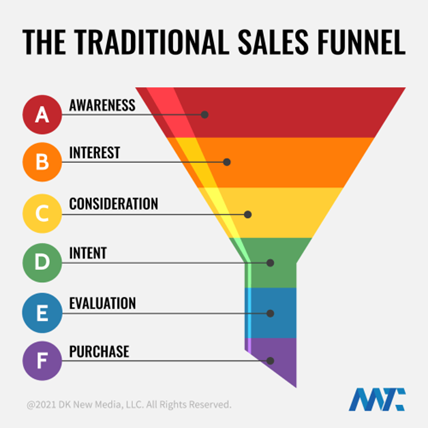
Understanding the funnel helps evaluate sales success indicators. Gail Goodwin, former CEO of small business direct mail provider Constant Contact, said managing the pipeline was key to escaping the sluggish SaaS ramp of death.
Like the funnel concept. To predict how well your business will do, measure how many potential clients are aware of it (awareness) and how many take the next step. If 1,000 people heard about your offering and 10% showed interest, you'd have 100 at that point. If 50% of these people made buyer-like noises, you'd know how many were, etc. It helped model buying trends.
TV, magazine, and radio advertising are pricey for B2C enterprises. Traditional B2B marketing involved armies of sales reps, which was expensive and a barrier to entry.
Cracks in the funnel model
Digital has exposed the funnel's limitations. Hubspot was born at a time when buyers and sellers had huge knowledge asymmetries, according to co-founder Brian Halligan. Those selling a product could use the buyer's lack of information to become a trusted partner.
As the world went digital, getting information and comparing offerings became faster, easier, and cheaper. Buyers didn't need a seller to move through a funnel. Interactions replaced transactions, and the relationship didn't end with a sale.
Instead, buyers and sellers interacted in a constant flow. In many modern models, the sale is midway through the process (particularly true with subscription and software-as-a-service models). Example:
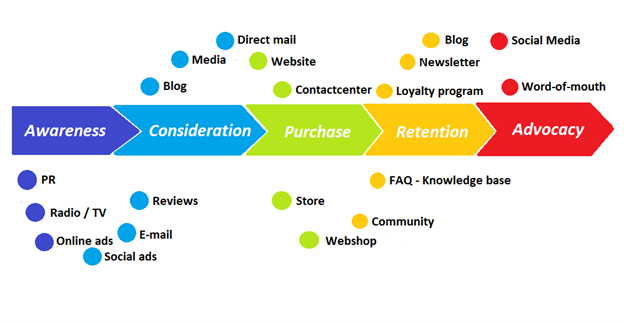
You're creating a winding journey with many touch points, not a funnel (and lots of opportunities for customers to get lost).
From winding journey to flywheel
Beyond this revised view of an interactive customer journey, a company can create what Jim Collins famously called a flywheel. Imagine rolling a heavy disc on its axis. The first few times you roll it, you put in a lot of effort for a small response. The same effort yields faster turns as it gains speed. Over time, the flywheel gains momentum and turns without your help.
Modern digital organizations have created flywheel business models, in which any additional force multiplies throughout the business. The flywheel becomes a force multiplier, according to Collins.
Amazon is a famous flywheel example. Collins explained the concept to Amazon CEO Jeff Bezos at a corporate retreat in 2001. In The Everything Store, Brad Stone describes in his book The Everything Store how he immediately understood Amazon's levers.
The result (drawn on a napkin):
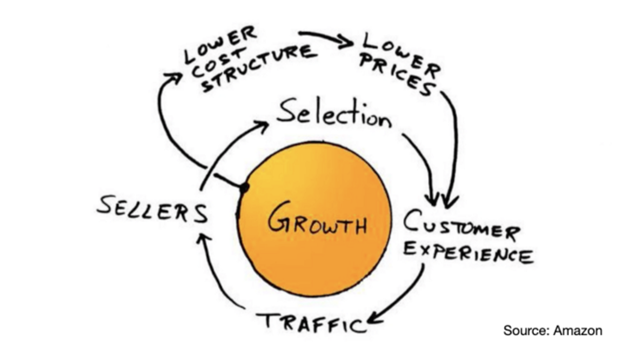
Low prices and a large selection of products attracted customers, while a focus on customer service kept them coming back, increasing traffic. Third-party sellers then increased selection. Low-cost structure supports low-price commitment. It's brilliant! Every wheel turn creates acceleration.
Where from here?
Flywheel over sales funnel! Consider these business terms.

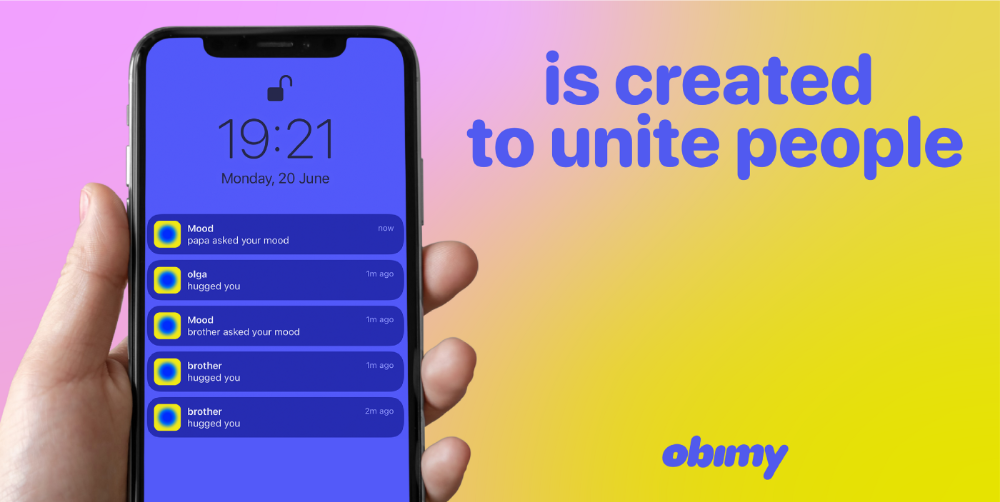
obimy.app
3 years ago
How TikTok helped us grow to 6 million users
This resulted to obimy's new audience.
Hi! obimy's official account. Here, we'll teach app developers and marketers. In 2022, our downloads increased dramatically, so we'll share what we learned.
obimy is what we call a ‘senseger’. It's a new method to communicate digitally. Instead of text, obimy users connect through senses and moods. Feeling playful? Flirt with your partner, pat a pal, or dump water on a classmate. Each feeling is an interactive animation with vibration. It's a wordless app. App Store and Google Play have obimy.
We had 20,000 users in 2022. Two to five thousand of them opened the app monthly. Our DAU metric was 500.
We have 6 million users after 6 months. 500,000 individuals use obimy daily. obimy was the top lifestyle app this week in the U.S.
And TikTok helped.
TikTok fuels obimys' growth. It's why our app exploded. How and what did we learn? Our Head of Marketing, Anastasia Avramenko, knows.
our actions prior to TikTok
We wanted to achieve product-market fit through organic expansion. Quora, Reddit, Facebook Groups, Facebook Ads, Google Ads, Apple Search Ads, and social media activity were tested. Nothing worked. Our CPI was sometimes $4, so unit economics didn't work.
We studied our markets and made audience hypotheses. We promoted our goods and studied our audience through social media quizzes. Our target demographic was Americans in long-distance relationships. I designed quizzes like Test the Strength of Your Relationship to better understand the user base. After each quiz, we encouraged users to download the app to enhance their connection and bridge the distance.
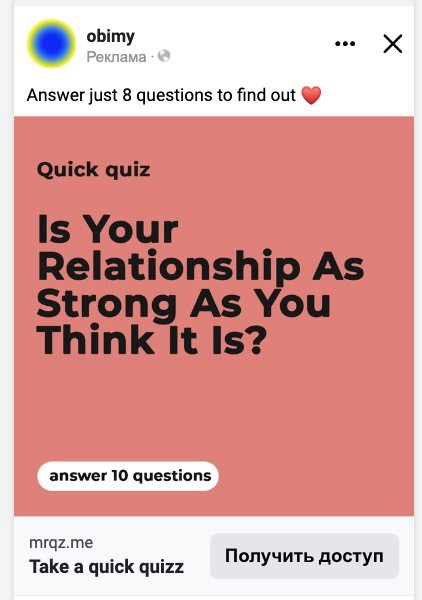
We got 1,000 responses for $50. This helped us comprehend the audience's grief and coping strategies (aka our rivals). I based action items on answers given. If you can't embrace a loved one, use obimy.
We also tried Facebook and Google ads. From the start, we knew it wouldn't work.
We were desperate to discover a free way to get more users.
Our journey to TikTok
TikTok is a great venue for emerging creators. It also helped reach people. Before obimy, my TikTok videos garnered 12 million views without sponsored promotion.
We had to act. TikTok was required.
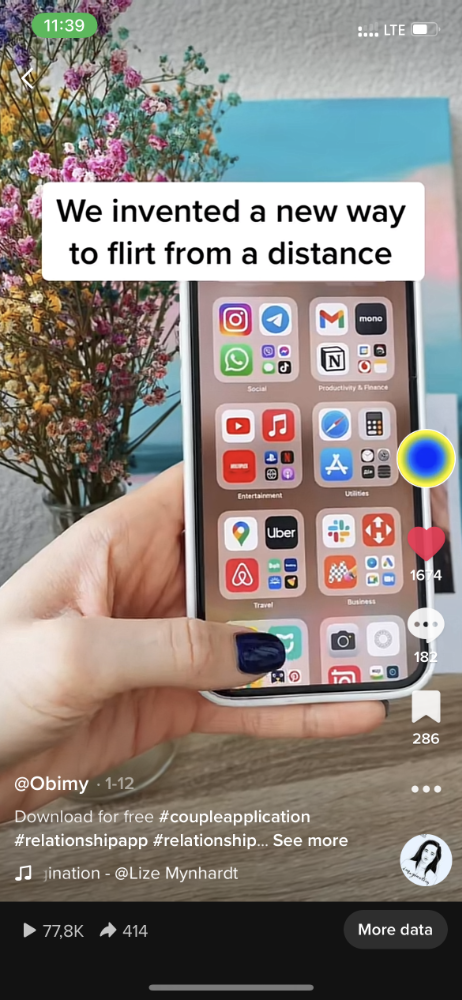
I wasn't a TikTok user before obimy. Initially, I uploaded promotional content. Call-to-actions appear strange next to dancing challenges and my money don't jiggle jiggle. I learned TikTok. Watch TikTok for an hour was on my to-do list. What a dream job!
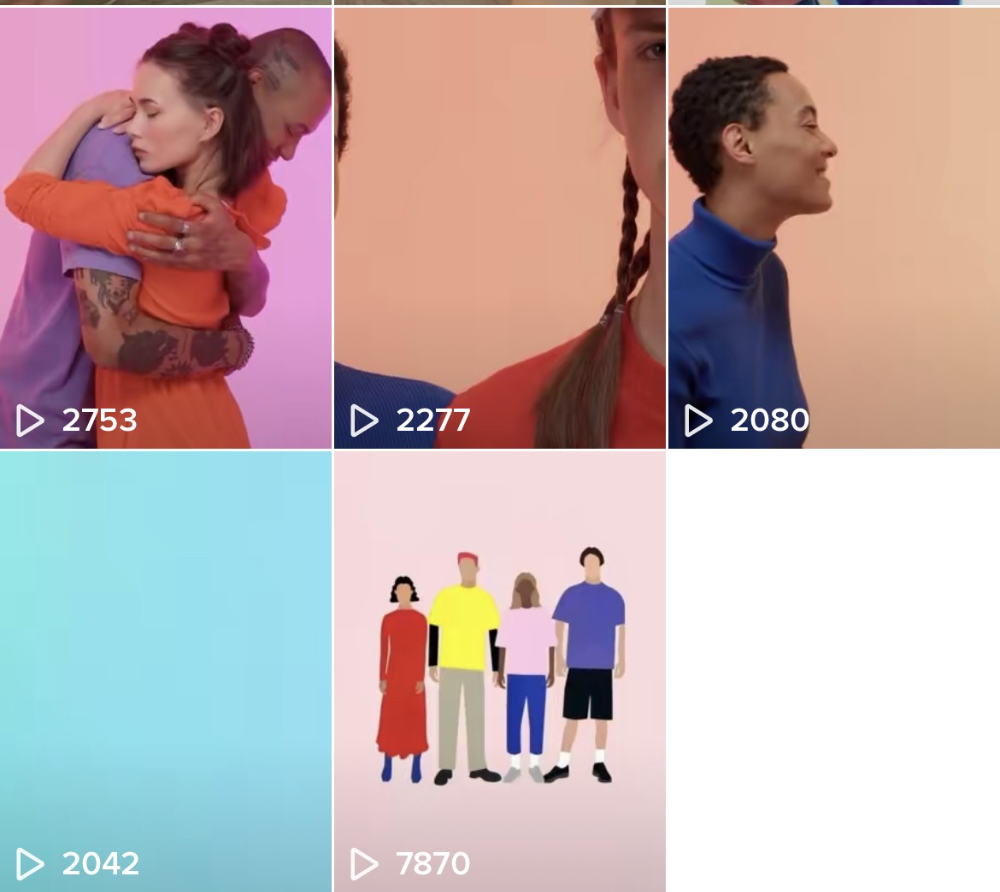
Our most popular movies presented the app alongside text outlining what it does. We started promoting them in Europe and the U.S. and got a 16% CTR and $1 CPI, an improvement over our previous efforts.
Somehow, we were expanding. So we came up with new hypotheses, calls to action, and content.
Four months passed, yet we saw no organic growth.
Russia attacked Ukraine.
Our app aimed to be helpful. For now, we're focusing on our Ukrainian audience. I posted sloppy TikToks illustrating how obimy can help during shelling or air raids.
In two hours, Kostia sent me our visitor count. Our servers crashed.
Initially, we had several thousand daily users. Over 200,000 users joined obimy in a week. They posted obimy videos on TikTok, drawing additional users. We've also resumed U.S. video promotion.
We gained 2,000,000 new members with less than $100 in ads, primarily in the U.S. and U.K.
TikTok helped.
The figures
We were confident we'd chosen the ideal tool for organic growth.
Over 45 million people have viewed our own videos plus a ton of user-generated content with the hashtag #obimy.
About 375 thousand people have liked all of our individual videos.
The number of downloads and the virality of videos are directly correlated.
Where are we now?
TikTok fuels our organic growth. We post 56 videos every week and pay to promote viral content.
We use UGC and influencers. We worked with Universal Music Italy on Eurovision. They offered to promote us through their million-follower TikTok influencers. We thought their followers would improve our audience, but it didn't matter. Integration didn't help us. Users that share obimy videos with their followers can reach several million views, which affects our download rate.
After the dust settled, we determined our key audience was 13-18-year-olds. They want to express themselves, but it's sometimes difficult. We're searching for methods to better engage with our users. We opened a Discord server to discuss anime and video games and gather app and content feedback.
TikTok helps us test product updates and hypotheses. Example: I once thought we might raise MAU by prompting users to add strangers as friends. Instead of asking our team to construct it, I made a TikTok urging users to share invite URLs. Users share links under every video we upload, embracing people worldwide.
Key lessons
Don't direct-sell. TikTok isn't for Instagram, Facebook, or YouTube promo videos. Conventional advertisements don't fit. Most users will swipe up and watch humorous doggos.
More product videos are better. Finally. So what?
Encourage interaction. Tagging friends in comments or making videos with the app promotes it more than any marketing spend.
Be odd and risqué. A user mistakenly sent a French kiss to their mom in one of our most popular videos.
TikTok helps test hypotheses and build your user base. It also helps develop apps. In our upcoming blog, we'll guide you through obimy's design revisions based on TikTok. Follow us on Twitter, Instagram, and TikTok.
You might also like

OnChain Wizard
4 years ago
How to make a >800 million dollars in crypto attacking the once 3rd largest stablecoin, Soros style
Everyone is talking about the $UST attack right now, including Janet Yellen. But no one is talking about how much money the attacker made (or how brilliant it was). Lets dig in.
Our story starts in late March, when the Luna Foundation Guard (or LFG) starts buying BTC to help back $UST. LFG started accumulating BTC on 3/22, and by March 26th had a $1bn+ BTC position. This is leg #1 that made this trade (or attack) brilliant.
The second leg comes in the form of the 4pool Frax announcement for $UST on April 1st. This added the second leg needed to help execute the strategy in a capital efficient way (liquidity will be lower and then the attack is on).
We don't know when the attacker borrowed 100k BTC to start the position, other than that it was sold into Kwon's buying (still speculation). LFG bought 15k BTC between March 27th and April 11th, so lets just take the average price between these dates ($42k).
So you have a ~$4.2bn short position built. Over the same time, the attacker builds a $1bn OTC position in $UST. The stage is now set to create a run on the bank and get paid on your BTC short. In anticipation of the 4pool, LFG initially removes $150mm from 3pool liquidity.
The liquidity was pulled on 5/8 and then the attacker uses $350mm of UST to drain curve liquidity (and LFG pulls another $100mm of liquidity).
But this only starts the de-pegging (down to 0.972 at the lows). LFG begins selling $BTC to defend the peg, causing downward pressure on BTC while the run on $UST was just getting started.
With the Curve liquidity drained, the attacker used the remainder of their $1b OTC $UST position ($650mm or so) to start offloading on Binance. As withdrawals from Anchor turned from concern into panic, this caused a real de-peg as people fled for the exits
So LFG is selling $BTC to restore the peg while the attacker is selling $UST on Binance. Eventually the chain gets congested and the CEXs suspend withdrawals of $UST, fueling the bank run panic. $UST de-pegs to 60c at the bottom, while $BTC bleeds out.
The crypto community panics as they wonder how much $BTC will be sold to keep the peg. There are liquidations across the board and LUNA pukes because of its redemption mechanism (the attacker very well could have shorted LUNA as well). BTC fell 25% from $42k on 4/11 to $31.3k
So how much did our attacker make? There aren't details on where they covered obviously, but if they are able to cover (or buy back) the entire position at ~$32k, that means they made $952mm on the short.
On the $350mm of $UST curve dumps I don't think they took much of a loss, lets assume 3% or just $11m. And lets assume that all the Binance dumps were done at 80c, thats another $125mm cost of doing business. For a grand total profit of $815mm (bf borrow cost).
BTC was the perfect playground for the trade, as the liquidity was there to pull it off. While having LFG involved in BTC, and foreseeing they would sell to keep the peg (and prevent LUNA from dying) was the kicker.
Lastly, the liquidity being low on 3pool in advance of 4pool allowed the attacker to drain it with only $350mm, causing the broader panic in both BTC and $UST. Any shorts on LUNA would've added a lot of P&L here as well, with it falling -65% since 5/7.
And for the reply guys, yes I know a lot of this involves some speculation & assumptions. But a lot of money was made here either way, and I thought it would be cool to dive into how they did it.

Anton Franzen
3 years ago
This is the driving force for my use of NFTs, which will completely transform the world.
Its not a fuc*ing fad.

It's not about boring monkeys or photos as nfts; that's just what's been pushed up and made a lot of money. The technology underlying those ridiculous nft photos will one day prove your house and automobile ownership and tell you where your banana came from. Are you ready for web3? Soar!
People don't realize that absolutely anything can and will be part of the blockchain and smart contracts, making them even better. I'll tell you a secret: it will and is happening.
Why?
Why is something blockchain-based a good idea? So let’s speak about cars!
So a new Tesla car is manufactured, and when you buy it, it is bound to an NFT on the blockchain that proves current ownership. The NFT in the smart contract can contain some data about the current owner of the car and some data about the car's status, such as the number of miles driven, the car's overall quality, and so on, as well as a reference to a digital document bound to the NFT that has more information.
Now, 40 years from now, if you want to buy a used automobile, you can scan the car's serial number to view its NFT and see all of its history, each owner, how long they owned it, if it had damages, and more. Since it's on the blockchain, it can't be tampered with.
When you're ready to buy it, the owner posts it for sale, you buy it, and it's sent to your wallet. 5 seconds to change owner, 100% safe and verifiable.
Incorporate insurance logic into the car contract. If you crashed, your car's smart contract would take money from your insurance contract and deposit it in an insurance company wallet.
It's limitless. Your funds may be used by investors to provide insurance as they profit from everyone's investments.
Or suppose all car owners in a country deposit a fixed amount of money into an insurance smart contract that promises if something happens, we'll take care of it. It could be as little as $100-$500 per year, and in a country with 10 million people, maybe 3 million would do that, which would be $500 000 000 in that smart contract and it would be used by the insurance company to invest in assets or take a cut, literally endless possibilities.
Instead of $300 per month, you may pay $300 per year to be covered if something goes wrong, and that may include multiple insurances.
What about your grocery store banana, though?
Yes that too.
You can scan a banana to learn its complete history. You'll be able to see where it was cultivated, every middleman in the supply chain, and hopefully the banana's quality, farm, and ingredients used.
If you want locally decent bananas, you can only buy them, offering you transparency and options. I believe it will be an online marketplace where farmers publish their farms and products for trust and transparency. You might also buy bananas from the farmer.
And? Food security to finish the article. If an order of bananas included a toxin, you could easily track down every banana from the same origin and supply chain and uncover the root cause. This is a tremendous thing that will save lives and have a big impact; did you realize that 1 in 6 Americans gets poisoned by food every year? This could lower the number.
To summarize:
Smart contracts can issue nfts as proof of ownership and include functionality.
Langston Thomas
3 years ago
A Simple Guide to NFT Blockchains
Ethereum's blockchain rules NFTs. Many consider it the one-stop shop for NFTs, and it's become the most talked-about and trafficked blockchain in existence.
Other blockchains are becoming popular in NFTs. Crypto-artists and NFT enthusiasts have sought new places to mint and trade NFTs due to Ethereum's high transaction costs and environmental impact.
When choosing a blockchain to mint on, there are several factors to consider. Size, creator costs, consumer spending habits, security, and community input are important. We've created a high-level summary of blockchains for NFTs to help clarify the fast-paced world of web3 tech.
Ethereum
Ethereum currently has the most NFTs. It's decentralized and provides financial and legal services without intermediaries. It houses popular NFT marketplaces (OpenSea), projects (CryptoPunks and the Bored Ape Yacht Club), and artists (Pak and Beeple).
It's also expensive and energy-intensive. This is because Ethereum works using a Proof-of-Work (PoW) mechanism. PoW requires computers to solve puzzles to add blocks and transactions to the blockchain. Solving these puzzles requires a lot of computer power, resulting in astronomical energy loss.
You should consider this blockchain first due to its popularity, security, decentralization, and ease of use.
Solana
Solana is a fast programmable blockchain. Its proof-of-history and proof-of-stake (PoS) consensus mechanisms eliminate complex puzzles. Reduced validation times and fees result.
PoS users stake their cryptocurrency to become a block validator. Validators get SOL. This encourages and rewards users to become stakers. PoH works with PoS to cryptographically verify time between events. Solana blockchain ensures transactions are in order and found by the correct leader (validator).
Solana's PoS and PoH mechanisms keep transaction fees and times low. Solana isn't as popular as Ethereum, so there are fewer NFT marketplaces and blockchain traders.
Tezos
Tezos is a greener blockchain. Tezos rose in 2021. Hic et Nunc was hailed as an economic alternative to Ethereum-centric marketplaces until Nov. 14, 2021.
Similar to Solana, Tezos uses a PoS consensus mechanism and only a PoS mechanism to reduce computational work. This blockchain uses two million times less energy than Ethereum. It's cheaper than Ethereum (but does cost more than Solana).
Tezos is a good place to start minting NFTs in bulk. Objkt is the largest Tezos marketplace.
Flow
Flow is a high-performance blockchain for NFTs, games, and decentralized apps (dApps). Flow is built with scalability in mind, so billions of people could interact with NFTs on the blockchain.
Flow became the NBA's blockchain partner in 2019. Flow, a product of Dapper labs (the team behind CryptoKitties), launched and hosts NBA Top Shot, making the blockchain integral to the popularity of non-fungible tokens.
Flow uses PoS to verify transactions, like Tezos. Developers are working on a model to handle 10,000 transactions per second on the blockchain. Low transaction fees.
Flow NFTs are tradeable on Blocktobay, OpenSea, Rarible, Foundation, and other platforms. NBA, NFL, UFC, and others have launched NFT marketplaces on Flow. Flow isn't as popular as Ethereum, resulting in fewer NFT marketplaces and blockchain traders.
Asset Exchange (WAX)
WAX is king of virtual collectibles. WAX is popular for digitalized versions of legacy collectibles like trading cards, figurines, memorabilia, etc.
Wax uses a PoS mechanism, but also creates carbon offset NFTs and partners with Climate Care. Like Flow, WAX transaction fees are low, and network fees are redistributed to the WAX community as an incentive to collectors.
WAX marketplaces host Topps, NASCAR, Hot Wheels, and cult classic film franchises like Godzilla, The Princess Bride, and Spiderman.
Binance Smart Chain
BSC is another good option for balancing fees and performance. High-speed transactions and low fees hurt decentralization. BSC is most centralized.
Binance Smart Chain uses Proof of Staked Authority (PoSA) to support a short block time and low fees. The 21 validators needed to run the exchange switch every 24 hours. 11 of the 21 validators are directly connected to the Binance Crypto Exchange, according to reports.
While many in the crypto and NFT ecosystems dislike centralization, the BSC NFT market picked up speed in 2021. OpenBiSea, AirNFTs, JuggerWorld, and others are gaining popularity despite not having as robust an ecosystem as Ethereum.