


More on Entrepreneurship/Creators

Mangu Solutions
3 years ago
Growing a New App to $15K/mo in 6 Months [SaaS Case Study]
Discover How We Used Facebook Ads to Grow a New Mobile App from $0 to $15K MRR in Just 6 Months and Our Strategy to Hit $100K a Month.
Our client introduced a mobile app for Poshmark resellers in December and wanted as many to experience it and subscribe to the monthly plan.
An Error We Committed
We initiated a Facebook ad campaign with a "awareness" goal, not "installs." This sent them to a landing page that linked to the iPhone App Store and Android Play Store. Smart, right?
We got some installs, but we couldn't tell how many came from the ad versus organic/other channels because the objective we chose only reported landing page clicks, not app installs.
We didn't know which interest groups/audiences had the best cost per install (CPI) to optimize and scale our budget.
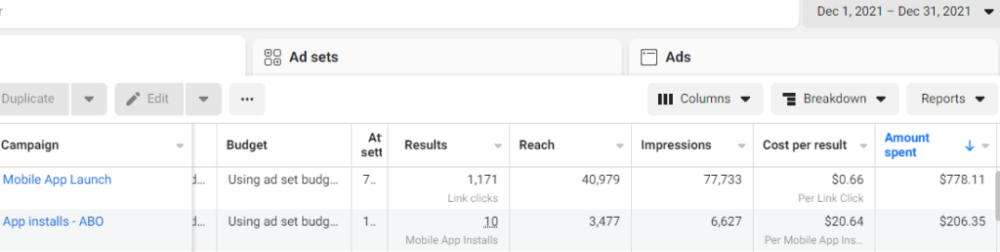
After spending $700 without adequate data (installs and trials report), we stopped the campaign and worked with our client's app developer to set up app events tracking.
This allowed us to create an installs campaign and track installs, trials, and purchases (in some cases).
Finding a Successful Audience
Once we knew what ad sets brought in what installs at what cost, we began optimizing and testing other interest groups and audiences, growing the profitable low CPI ones and eliminating the high CPI ones.
We did all our audience testing using an ABO campaign (Ad Set Budget Optimization), spending $10 to $30 on each ad set for three days and optimizing afterward. All ad sets under $30 were moved to a CBO campaign (Campaign Budget Optimization).
We let Facebook's AI decide how much to spend on each ad set, usually the one most likely to convert at the lowest cost.
If the CBO campaign maintains a nice CPI, we keep increasing the budget by $50 every few days or duplicating it sometimes in order to double the budget. This is how we've scaled to $400/day profitably.
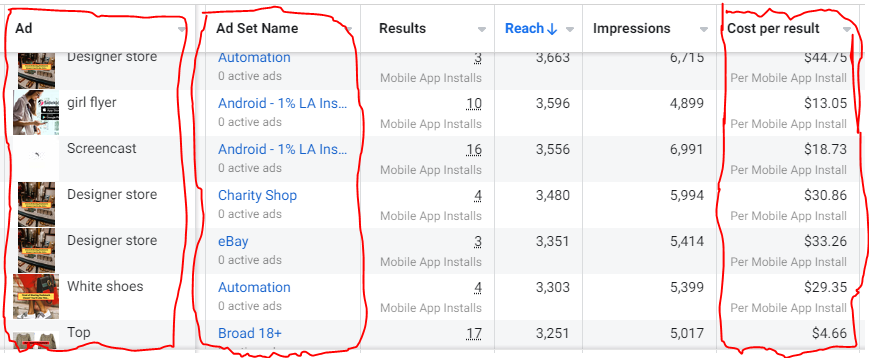
Finding Successful Creatives
Per campaign, we tested 2-6 images/videos. Same ad copy and CTA. There was no clear winner because some images did better with some interest groups.
The image above with mail packages, for example, got us a cheap CPI of $9.71 from our Goodwill Stores interest group but, a high $48 CPI from our lookalike audience. Once we had statistically significant data, we turned off the high-cost ad.
New marketers who are just discovering A/B testing may assume it's black and white — winner and loser. However, Facebook ads' machine learning and reporting has gotten so sophisticated that it's hard to call a creative a flat-out loser, but rather a 'bad fit' for some audiences, and perfect for others.
You can see how each creative performs across age groups and optimize.
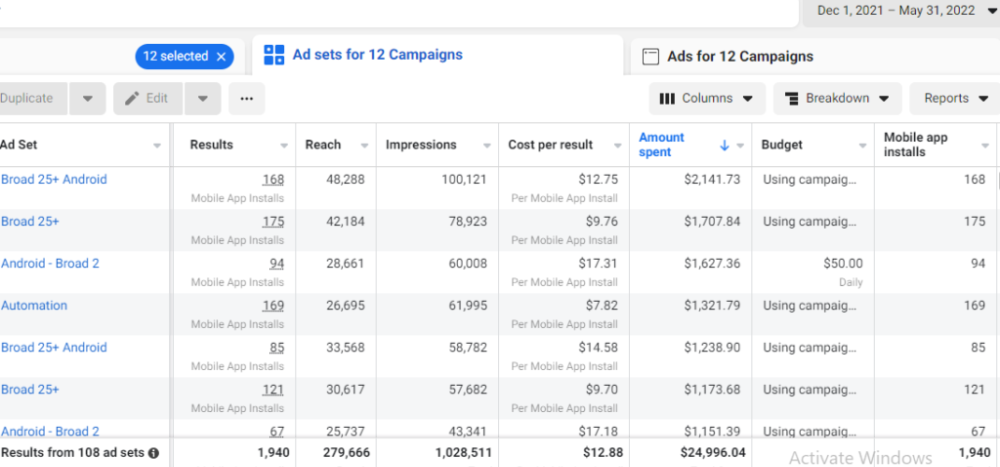
How Many Installs Did It Take Us to Earn $15K Per Month?
Six months after paying $25K, we got 1,940 app installs, 681 free trials, and 522 $30 monthly subscriptions. 522 * $30 gives us $15,660 in monthly recurring revenue (MRR).
Next, what? $100K per month
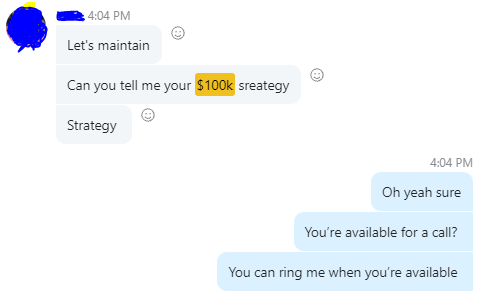
The conversation above is with the app's owner. We got on a 30-minute call where I shared how I plan to get the app to be making $100K a month like I’ve done for other businesses.
Reverse Engineering $100K
Formula:
For $100K/month, we need 3,334 people to pay $30/month. 522 people pay that. We need 2,812 more paid users.
522 paid users from 1,940 installs is a 27% conversion rate. To hit $100K/month, we need 10,415 more installs. Assuming...
With a $400 daily ad spend, we average 40 installs per day. This means that if everything stays the same, it would take us 260 days (around 9 months) to get to $100K a month (MRR).
Conclusion
You must market your goods to reach your income objective (without waiting forever). Paid ads is the way to go if you hate knocking on doors or irritating friends and family (who aren’t scalable anyways).
You must also test and optimize different angles, audiences, interest groups, and creatives.
Maddie Wang
3 years ago
Easiest and fastest way to test your startup idea!
Here's the fastest way to validate company concepts.
I squandered a year after dropping out of Stanford designing a product nobody wanted.
But today, I’m at 100k!
Differences:
I was designing a consumer product when I dropped out.
I coded MVP, got 1k users, and got YC interview.
Nice, huh?
WRONG!
Still coding and getting users 12 months later
WOULD PEOPLE PAY FOR IT? was the riskiest assumption I hadn't tested.
When asked why I didn't verify payment, I said,
Not-ready products. Now, nobody cares. The website needs work. Include this. Increase usage…
I feared people would say no.
After 1 year of pushing it off, my team told me they were really worried about the Business Model. Then I asked my audience if they'd buy my product.
So?
No, overwhelmingly.
I felt like I wasted a year building a product no one would buy.
Founders Cafe was the opposite.
Before building anything, I requested payment.
40 founders were interviewed.
Then we emailed Stanford, YC, and other top founders, asking them to join our community.
BOOM! 10/12 paid!
Without building anything, in 1 day I validated my startup's riskiest assumption. NOT 1 year.
Asking people to pay is one of the scariest things.
I understand.
I asked Stanford queer women to pay before joining my gay sorority.
I was afraid I'd turn them off or no one would pay.
Gay women, like those founders, were in such excruciating pain that they were willing to pay me upfront to help.
You can ask for payment (before you build) to see if people have the burning pain. Then they'll pay!
Examples from Founders Cafe members:
😮 Using a fake landing page, a college dropout tested a product. Paying! He built it and made $3m!
😮 YC solo founder faked a Powerpoint demo. 5 Enterprise paid LOIs. $1.5m raised, built, and in YC!
😮 A Harvard founder can convert Figma to React. 1 day, 10 customers. Built a tool to automate Figma -> React after manually fulfilling requests. 1m+
Bad example:
😭 Stanford Dropout Spends 1 Year Building Product Without Payment Validation
Some people build for a year and then get paying customers.
What I'm sharing is my experience and what Founders Cafe members have told me about validating startup ideas.
Don't waste a year like I did.
After my first startup failed, I planned to re-enroll at Stanford/work at Facebook.
After people paid, I quit for good.
I've hit $100k!
Hope this inspires you to request upfront payment! It'll change your life

Alex Mathers
25 years ago
400 articles later, nobody bothered to read them.

Writing for readers:
14 years of daily writing.
I post practically everything on social media. I authored hundreds of articles, thousands of tweets, and numerous volumes to almost no one.
Tens of thousands of readers regularly praise me.
I despised writing. I'm stuck now.
I've learned what readers like and what doesn't.
Here are some essential guidelines for writing with impact:
Readers won't understand your work if you can't.
Though obvious, this slipped me up. Share your truths.
Stories engage human brains.
Showing the journey of a person from worm to butterfly inspires the human spirit.
Overthinking hinders powerful writing.
The best ideas come from inner understanding in between thoughts.
Avoid writing to find it. Write.
Writing a masterpiece isn't motivating.
Write for five minutes to simplify. Step-by-step, entertaining, easy steps.
Good writing requires a willingness to make mistakes.
So write loads of garbage that you can edit into a good piece.
Courageous writing.
A courageous story will move readers. Personal experience is best.
Go where few dare.
Templates, outlines, and boundaries help.
Limitations enhance writing.
Excellent writing is straightforward and readable, removing all the unnecessary fat.
Use five words instead of nine.
Use ordinary words instead of uncommon ones.
Readers desire relatability.
Too much perfection will turn it off.
Write to solve an issue if you can't think of anything to write.
Instead, read to inspire. Best authors read.
Every tweet, thread, and novel must have a central idea.
What's its point?
This can make writing confusing.
️ Don't direct your reader.
Readers quit reading. Demonstrate, describe, and relate.
Even if no one responds, have fun. If you hate writing it, the reader will too.
You might also like

Sam Hickmann
3 years ago
Token taxonomy: Utility vs Security vs NFT
Let's examine the differences between the three main token types and their functions.
As Ethereum grew, the term "token" became a catch-all term for all assets built on the Ethereum blockchain. However, different tokens were grouped based on their applications and features, causing some confusion. Let's examine the modification of three main token types: security, utility, and non-fungible.
Utility tokens
They provide a specific utility benefit (or a number of such). A utility token is similar to a casino chip, a table game ticket, or a voucher. Depending on the terms of issuing, they can be earned and used in various ways. A utility token is a type of token that represents a tool or mechanism required to use the application in question. Like a service, a utility token's price is determined by supply and demand. Tokens can also be used as a bonus or reward mechanism in decentralized systems: for example, if you like someone's work, give them an upvote and they get a certain number of tokens. This is a way for authors or creators to earn money indirectly.
The most common way to use a utility token is to pay with them instead of cash for discounted goods or services.
Utility tokens are the most widely used by blockchain companies. Most cryptocurrency exchanges accept fees in native utility tokens.
Utility tokens can also be used as a reward. Companies tokenize their loyalty programs so that points can be bought and sold on blockchain exchanges. These tokens are widely used in decentralized companies as a bonus system. You can use utility tokens to reward creators for their contributions to a platform, for example. It also allows members to exchange tokens for specific bonuses and rewards on your site.
Unlike security tokens, which are subject to legal restrictions, utility tokens can be freely traded.
Security tokens
Security tokens are essentially traditional securities like shares, bonds, and investment fund units in a crypto token form.
The key distinction is that security tokens are typically issued by private firms (rather than public companies) that are not listed on stock exchanges and in which you can not invest right now. Banks and large venture funds used to be the only sources of funding. A person could only invest in private firms if they had millions of dollars in their bank account. Privately issued security tokens outperform traditional public stocks in terms of yield. Private markets grew 50% faster than public markets over the last decade, according to McKinsey Private Equity Research.
A security token is a crypto token whose value is derived from an external asset or company. So it is governed as security (read about the Howey test further in this article). That is, an ownership token derives its value from the company's valuation, assets on the balance sheet, or dividends paid to token holders.
Why are Security Tokens Important?
Cryptocurrency is a lucrative investment. Choosing from thousands of crypto assets can mean the difference between millionaire and bankrupt. Without security tokens, crypto investing becomes riskier and generating long-term profits becomes difficult. These tokens have lower risk than other cryptocurrencies because they are backed by real assets or business cash flows. So having them helps to diversify a portfolio and preserve the return on investment in riskier assets.
Security tokens open up new funding avenues for businesses. As a result, investors can invest in high-profit businesses that are not listed on the stock exchange.
The distinction between utility and security tokens isn't as clear as it seems. However, this increases the risk for token issuers, especially in the USA. The Howey test is the main pillar regulating judicial precedent in this area.
What is a Howey Test?
An "investment contract" is determined by the Howey Test, a lawsuit settled by the US Supreme Court. If it does, it's a security and must be disclosed and registered under the Securities Act of 1933 and the Securities Exchange Act of 1934.
If the SEC decides that a cryptocurrency token is a security, a slew of issues arise. In practice, this ensures that the SEC will decide when a token can be offered to US investors and if the project is required to file a registration statement with the SEC.
Due to the Howey test's extensive wording, most utility tokens will be classified as securities, even if not intended to be. Because of these restrictions, most ICOs are not available to US investors. When asked about ICOs in 2018, then-SEC Chairman Jay Clayton said they were securities. The given statement adds to the risk. If a company issues utility tokens without registering them as securities, the regulator may impose huge fines or even criminal charges.
What other documents regulate tokens?
Securities Act (1993) or Securities Exchange Act (1934) in the USA; MiFID directive and Prospectus Regulation in the EU. These laws require registering the placement of security tokens, limiting their transfer, but protecting investors.
Utility tokens have much less regulation. The Howey test determines whether a given utility token is a security. Tokens recognized as securities are now regulated as such. Having a legal opinion that your token isn't makes the implementation process much easier. Most countries don't have strict regulations regarding utility tokens except KYC (Know Your Client) and AML (Anti Money-Laundering).
As cryptocurrency and blockchain technologies evolve, more countries create UT regulations. If your company is based in the US, be aware of the Howey test and the Bank Secrecy Act. It classifies UTs and their issuance as money transmission services in most states, necessitating a license and strict regulations. Due to high regulatory demands, UT issuers try to avoid the United States as a whole. A new law separating utility tokens from bank secrecy act will be introduced in the near future, giving hope to American issuers.
The rest of the world has much simpler rules requiring issuers to create basic investor disclosures. For example, the latest European legislation (MiCA) allows businesses to issue utility tokens without regulator approval. They must also prepare a paper with all the necessary information for the investors.
A payment token is a utility token that is used to make a payment. They may be subject to electronic money laws.
Because non-fungible tokens are a new instrument, there is no regulating paper yet. However, if the NFT is fractionalized, the smaller tokens acquired may be seen as securities.
NFT Tokens
Collectible tokens are also known as non-fungible tokens. Their distinctive feature is that they denote unique items such as artwork, merch, or ranks. Unlike utility tokens, which are fungible, meaning that two of the same tokens are identical, NFTs represent a unit of possession that is strictly one of a kind. In a way, NFTs are like baseball cards, each one unique and valuable.
As for today, the most recognizable NFT function is to preserve the fact of possession. Owning an NFT with a particular gif, meme, or sketch does not transfer the intellectual right to the possessor, but is analogous to owning an original painting signed by the author.
Collectible tokens can also be used as digital souvenirs, so to say. Businesses can improve their brand image by issuing their own branded NFTs, which represent ranks or achievements within the corporate ecosystem. Gamifying business ecosystems would allow people to connect with a brand and feel part of a community.
Which type of tokens is right for you as a business to raise capital?
For most businesses, it's best to raise capital with security tokens by selling existing shares to global investors. Utility tokens aren't meant to increase in value over time, so leave them for gamification and community engagement. In a blockchain-based business, however, a utility token is often the lifeblood of the operation, and its appreciation potential is directly linked to the company's growth. You can issue multiple tokens at once, rather than just one type. It exposes you to various investors and maximizes the use of digital assets.
Which tokens should I buy?
There are no universally best tokens. Their volatility, industry, and risk-reward profile vary. This means evaluating tokens in relation to your overall portfolio and personal preferences: what industries do you understand best, what excites you, how do you approach taxes, and what is your planning horizon? To build a balanced portfolio, you need to know these factors.
Conclusion
The three most common types of tokens today are security, utility, and NFT. Security tokens represent stocks, mutual funds, and bonds. Utility tokens can be perceived as an inside-product "currency" or "ignition key" that grants you access to goods and services or empowers with other perks. NFTs are unique collectible units that identify you as the owner of something.

Ellane W
3 years ago
The Last To-Do List Template I'll Ever Need, Years in the Making
The holy grail of plain text task management is finally within reach

Plain text task management? Are you serious?? Dedicated task managers exist for a reason, you know. Sheesh.
—Oh, I know. Believe me, I know! But hear me out.
I've managed projects and tasks in plain text for more than four years. Since reorganizing my to-do list, plain text task management is within reach.
Data completely yours? One billion percent. Beef it up with coding? Be my guest.
Enter: The List
The answer? A list. That’s it!
Write down tasks. Obsidian, Notenik, Drafts, or iA Writer are good plain text note-taking apps.
List too long? Of course, it is! A large list tells you what to do. Feel the itch and friction. Then fix it.
But I want to be able to distinguish between work and personal life! List two things.
However, I need to know what should be completed first. Put those items at the top.
However, some things keep coming up, and I need to be reminded of them! Put those in your calendar and make an alarm for them.
But since individual X hasn't completed task Y, I can't proceed with this. Create a Waiting section on your list by dividing it.
But I must know what I'm supposed to be doing right now! Read your list(s). Check your calendar. Think critically.
Before I begin a new one, I remind myself that "Listory Never Repeats."
There’s no such thing as too many lists if all are needed. There is such a thing as too many lists if you make them before they’re needed. Before they complain that their previous room was small or too crowded or needed a new light.
A list that feels too long has a voice; it’s telling you what to do next.
I use one Master List. It's a control panel that tells me what to focus on short-term. If something doesn't need semi-immediate attention, it goes on my Backlog list.
Todd Lewandowski's DWTS (Done, Waiting, Top 3, Soon) performance deserves praise. His DWTS to-do list structure has transformed my plain-text task management. I didn't realize it was upside down.
This is my take on it:
D = Done
Move finished items here. If they pile up, clear them out every week or month. I have a Done Archive folder.
W = Waiting
Things seething in the background, awaiting action. Stir them occasionally so they don't burn.
T = Top 3
Three priorities. Personal comes first, then work. There will always be a top 3 (no more than 5) in every category. Projects, not chores, usually.
S = Soon
This part is action-oriented. It's for anything you can accomplish to finish one of the Top 3. This collection includes thoughts and project lists. The sole requirement is that they should be short-term goals.
Some of you have probably concluded this isn't for you. Please read Todd's piece before throwing out the baby. Often. You shouldn't miss a newborn.
As much as Dancing With The Stars helps me recall this method, I may try switching their order. TSWD; Drilling Tunnel Seismic? Serenity After Task?
Master List Showcase
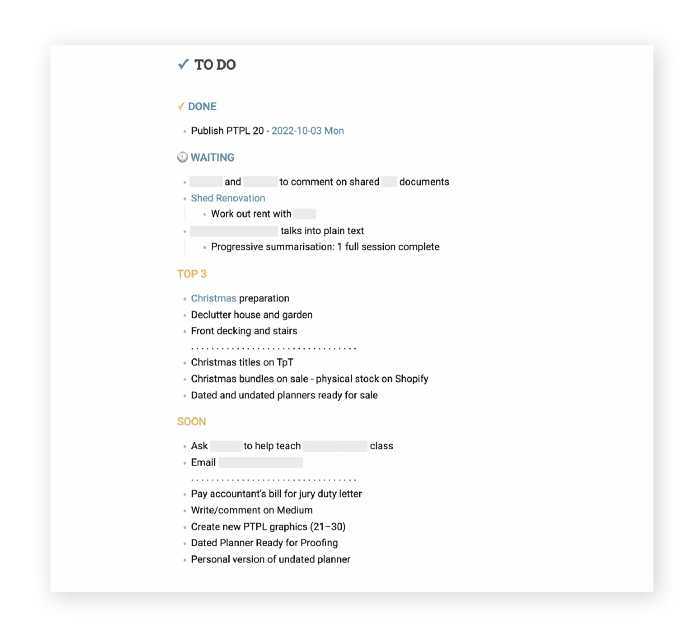
My Master List lives alone in its own file, but sometimes appears in other places. It's included in my Weekly List template. Here's a (soon-to-be-updated) demo vault of my Obsidian planning setup to download for free.
Here's the code behind my weekly screenshot:
## [[Master List - 2022|✓]]  TO DO

![[Master List - 2022]]
FYI, I use the Minimal Theme in Obsidian, with a few tweaks.
You may note I'm utilizing a checkmark as a link. For me, that's easier than locating the proper spot to click on the embed.
Blue headings for Done and Waiting are links. Done links to the Done Archive page and Waiting to a general waiting page.
Read my full article here.
Rishi Dean
3 years ago
Coinbase's web3 app
Use popular Ethereum dapps with Coinbase’s new dapp wallet and browser
Tl;dr: This post highlights the ability to access web3 directly from your Coinbase app using our new dapp wallet and browser.
Decentralized autonomous organizations (DAOs) and decentralized finance (DeFi) have gained popularity in the last year (DAOs). The total value locked (TVL) of DeFi investments on the Ethereum blockchain has grown to over $110B USD, while NFTs sales have grown to over $30B USD in the last 12 months (LTM). New innovative real-world applications are emerging every day.
Today, a small group of Coinbase app users can access Ethereum-based dapps. Buying NFTs on Coinbase NFT and OpenSea, trading on Uniswap and Sushiswap, and borrowing and lending on Curve and Compound are examples.
Our new dapp wallet and dapp browser enable you to access and explore web3 directly from your Coinbase app.
Web3 in the Coinbase app
Users can now access dapps without a recovery phrase. This innovative dapp wallet experience uses Multi-Party Computation (MPC) technology to secure your on-chain wallet. This wallet's design allows you and Coinbase to share the 'key.' If you lose access to your device, the key to your dapp wallet is still safe and Coinbase can help recover it.
Set up your new dapp wallet by clicking the "Browser" tab in the Android app's navigation bar. Once set up, the Coinbase app's new dapp browser lets you search, discover, and use Ethereum-based dapps.
Looking forward
We want to enable everyone to seamlessly and safely participate in web3, and today’s launch is another step on that journey. We're rolling out the new dapp wallet and browser in the US on Android first to a small subset of users and plan to expand soon. Stay tuned!