


More on Web3 & Crypto

Vitalik
4 years ago
Fairness alternatives to selling below market clearing prices (or community sentiment, or fun)
When a seller has a limited supply of an item in high (or uncertain and possibly high) demand, they frequently set a price far below what "the market will bear." As a result, the item sells out quickly, with lucky buyers being those who tried to buy first. This has happened in the Ethereum ecosystem, particularly with NFT sales and token sales/ICOs. But this phenomenon is much older; concerts and restaurants frequently make similar choices, resulting in fast sell-outs or long lines.
Why do sellers do this? Economists have long wondered. A seller should sell at the market-clearing price if the amount buyers are willing to buy exactly equals the amount the seller has to sell. If the seller is unsure of the market-clearing price, they should sell at auction and let the market decide. So, if you want to sell something below market value, don't do it. It will hurt your sales and it will hurt your customers. The competitions created by non-price-based allocation mechanisms can sometimes have negative externalities that harm third parties, as we will see.
However, the prevalence of below-market-clearing pricing suggests that sellers do it for good reason. And indeed, as decades of research into this topic has shown, there often are. So, is it possible to achieve the same goals with less unfairness, inefficiency, and harm?
Selling at below market-clearing prices has large inefficiencies and negative externalities
An item that is sold at market value or at an auction allows someone who really wants it to pay the high price or bid high in the auction. So, if a seller sells an item below market value, some people will get it and others won't. But the mechanism deciding who gets the item isn't random, and it's not always well correlated with participant desire. It's not always about being the fastest at clicking buttons. Sometimes it means waking up at 2 a.m. (but 11 p.m. or even 2 p.m. elsewhere). Sometimes it's just a "auction by other means" that's more chaotic, less efficient, and has far more negative externalities.
There are many examples of this in the Ethereum ecosystem. Let's start with the 2017 ICO craze. For example, an ICO project would set the price of the token and a hard maximum for how many tokens they are willing to sell, and the sale would start automatically at some point in time. The sale ends when the cap is reached.
So what? In practice, these sales often ended in 30 seconds or less. Everyone would start sending transactions in as soon as (or just before) the sale started, offering higher and higher fees to encourage miners to include their transaction first. Instead of the token seller receiving revenue, miners receive it, and the sale prices out all other applications on-chain.
The most expensive transaction in the BAT sale set a fee of 580,000 gwei, paying a fee of $6,600 to get included in the sale.
Many ICOs after that tried various strategies to avoid these gas price auctions; one ICO notably had a smart contract that checked the transaction's gasprice and rejected it if it exceeded 50 gwei. But that didn't solve the issue. Buyers hoping to game the system sent many transactions hoping one would get through. An auction by another name, clogging the chain even more.
ICOs have recently lost popularity, but NFTs and NFT sales have risen in popularity. But the NFT space didn't learn from 2017; they do fixed-quantity sales just like ICOs (eg. see the mint function on lines 97-108 of this contract here). So what?
That's not the worst; some NFT sales have caused gas price spikes of up to 2000 gwei.
High gas prices from users fighting to get in first by sending higher and higher transaction fees. An auction renamed, pricing out all other applications on-chain for 15 minutes.
So why do sellers sometimes sell below market price?
Selling below market value is nothing new, and many articles, papers, and podcasts have written (and sometimes bitterly complained) about the unwillingness to use auctions or set prices to market-clearing levels.
Many of the arguments are the same for both blockchain (NFTs and ICOs) and non-blockchain examples (popular restaurants and concerts). Fairness and the desire not to exclude the poor, lose fans or create tension by being perceived as greedy are major concerns. The 1986 paper by Kahneman, Knetsch, and Thaler explains how fairness and greed can influence these decisions. I recall that the desire to avoid perceptions of greed was also a major factor in discouraging the use of auction-like mechanisms in 2017.
Aside from fairness concerns, there is the argument that selling out and long lines create a sense of popularity and prestige, making the product more appealing to others. Long lines should have the same effect as high prices in a rational actor model, but this is not the case in reality. This applies to ICOs and NFTs as well as restaurants. Aside from increasing marketing value, some people find the game of grabbing a limited set of opportunities first before everyone else is quite entertaining.
But there are some blockchain-specific factors. One argument for selling ICO tokens below market value (and one that persuaded the OmiseGo team to adopt their capped sale strategy) is community dynamics. The first rule of community sentiment management is to encourage price increases. People are happy if they are "in the green." If the price drops below what the community members paid, they are unhappy and start calling you a scammer, possibly causing a social media cascade where everyone calls you a scammer.
This effect can only be avoided by pricing low enough that post-launch market prices will almost certainly be higher. But how do you do this without creating a rush for the gates that leads to an auction?
Interesting solutions
It's 2021. We have a blockchain. The blockchain is home to a powerful decentralized finance ecosystem, as well as a rapidly expanding set of non-financial tools. The blockchain also allows us to reset social norms. Where decades of economists yelling about "efficiency" failed, blockchains may be able to legitimize new uses of mechanism design. If we could use our more advanced tools to create an approach that more directly solves the problems, with fewer side effects, wouldn't that be better than fiddling with a coarse-grained one-dimensional strategy space of selling at market price versus below market price?
Begin with the goals. We'll try to cover ICOs, NFTs, and conference tickets (really a type of NFT) all at the same time.
1. Fairness: don't completely exclude low-income people from participation; give them a chance. The goal of token sales is to avoid high initial wealth concentration and have a larger and more diverse initial token holder community.
2. Don’t create races: Avoid situations where many people rush to do the same thing and only a few get in (this is the type of situation that leads to the horrible auctions-by-another-name that we saw above).
3. Don't require precise market knowledge: the mechanism should work even if the seller has no idea how much demand exists.
4. Fun: The process of participating in the sale should be fun and game-like, but not frustrating.
5. Give buyers positive expected returns: in the case of a token (or an NFT), buyers should expect price increases rather than decreases. This requires selling below market value.
Let's start with (1). From Ethereum's perspective, there is a simple solution. Use a tool designed for the job: proof of personhood protocols! Here's one quick idea:
Mechanism 1 Each participant (verified by ID) can buy up to ‘’X’’ tokens at price P, with the option to buy more at an auction.
With the per-person mechanism, buyers can get positive expected returns for the portion sold through the per-person mechanism, and the auction part does not require sellers to understand demand levels. Is it race-free? The number of participants buying through the per-person pool appears to be high. But what if the per-person pool isn't big enough to accommodate everyone?
Make the per-person allocation amount dynamic.
Mechanism 2 Each participant can deposit up to X tokens into a smart contract to declare interest. Last but not least, each buyer receives min(X, N / buyers) tokens, where N is the total sold through the per-person pool (some other amount can also be sold by auction). The buyer gets their deposit back if it exceeds the amount needed to buy their allocation.
No longer is there a race condition based on the number of buyers per person. No matter how high the demand, it's always better to join sooner rather than later.
Here's another idea if you like clever game mechanics with fancy quadratic formulas.
Mechanism 3 Each participant can buy X units at a price P X 2 up to a maximum of C tokens per buyer. C starts low and gradually increases until enough units are sold.
The quantity allocated to each buyer is theoretically optimal, though post-sale transfers will degrade this optimality over time. Mechanisms 2 and 3 appear to meet all of the above objectives. They're not perfect, but they're good starting points.
One more issue. For fixed and limited supply NFTs, the equilibrium purchased quantity per participant may be fractional (in mechanism 2, number of buyers > N, and in mechanism 3, setting C = 1 may already lead to over-subscription). With fractional sales, you can offer lottery tickets: if there are N items available, you have a chance of N/number of buyers of getting the item, otherwise you get a refund. For a conference, groups could bundle their lottery tickets to guarantee a win or a loss. The certainty of getting the item can be auctioned.
The bottom tier of "sponsorships" can be used to sell conference tickets at market rate. You may end up with a sponsor board full of people's faces, but is that okay? After all, John Lilic was on EthCC's sponsor board!
Simply put, if you want to be reliably fair to people, you need an input that explicitly measures people. Authentication protocols do this (and if desired can be combined with zero knowledge proofs to ensure privacy). So we should combine the efficiency of market and auction-based pricing with the equality of proof of personhood mechanics.
Answers to possible questions
Q: Won't people who don't care about your project buy the item and immediately resell it?
A: Not at first. Meta-games take time to appear in practice. If they do, making them untradeable for a while may help mitigate the damage. Using your face to claim that your previous account was hacked and that your identity, including everything in it, should be moved to another account works because proof-of-personhood identities are untradeable.
Q: What if I want to make my item available to a specific community?
A: Instead of ID, use proof of participation tokens linked to community events. Another option, also serving egalitarian and gamification purposes, is to encrypt items within publicly available puzzle solutions.
Q: How do we know they'll accept? Strange new mechanisms have previously been resisted.
A: Having economists write screeds about how they "should" accept a new mechanism that they find strange is difficult (or even "equity"). However, abrupt changes in context effectively reset people's expectations. So the blockchain space is the best place to try this. You could wait for the "metaverse", but it's possible that the best version will run on Ethereum anyway, so start now.

Juxtathinka
4 years ago
Why Is Blockchain So Popular?
What is Bitcoin?
The blockchain is a shared, immutable ledger that helps businesses record transactions and track assets. The blockchain can track tangible assets like cars, houses, and land. Tangible assets like intellectual property can also be tracked on the blockchain.
Imagine a blockchain as a distributed database split among computer nodes. A blockchain stores data in blocks. When a block is full, it is closed and linked to the next. As a result, all subsequent information is compiled into a new block that will be added to the chain once it is filled.
The blockchain is designed so that adding a transaction requires consensus. That means a majority of network nodes must approve a transaction. No single authority can control transactions on the blockchain. The network nodes use cryptographic keys and passwords to validate each other's transactions.
Blockchain History
The blockchain was not as popular in 1991 when Stuart Haber and W. Scott Stornetta worked on it. The blocks were designed to prevent tampering with document timestamps. Stuart Haber and W. Scott Stornetta improved their work in 1992 by using Merkle trees to increase efficiency and collect more documents on a single block.
In 2004, he developed Reusable Proof of Work. This system allows users to verify token transfers in real time. Satoshi Nakamoto invented distributed blockchains in 2008. He improved the blockchain design so that new blocks could be added to the chain without being signed by trusted parties.
Satoshi Nakomoto mined the first Bitcoin block in 2009, earning 50 Bitcoins. Then, in 2013, Vitalik Buterin stated that Bitcoin needed a scripting language for building decentralized applications. He then created Ethereum, a new blockchain-based platform for decentralized apps. Since the Ethereum launch in 2015, different blockchain platforms have been launched: from Hyperledger by Linux Foundation, EOS.IO by block.one, IOTA, NEO and Monero dash blockchain. The block chain industry is still growing, and so are the businesses built on them.
Blockchain Components
The Blockchain is made up of many parts:
1. Node: The node is split into two parts: full and partial. The full node has the authority to validate, accept, or reject any transaction. Partial nodes or lightweight nodes only keep the transaction's hash value. It doesn't keep a full copy of the blockchain, so it has limited storage and processing power.
2. Ledger: A public database of information. A ledger can be public, decentralized, or distributed. Anyone on the blockchain can access the public ledger and add data to it. It allows each node to participate in every transaction. The distributed ledger copies the database to all nodes. A group of nodes can verify transactions or add data blocks to the blockchain.
3. Wallet: A blockchain wallet allows users to send, receive, store, and exchange digital assets, as well as monitor and manage their value. Wallets come in two flavors: hardware and software. Online or offline wallets exist. Online or hot wallets are used when online. Without an internet connection, offline wallets like paper and hardware wallets can store private keys and sign transactions. Wallets generally secure transactions with a private key and wallet address.
4. Nonce: A nonce is a short term for a "number used once''. It describes a unique random number. Nonces are frequently generated to modify cryptographic results. A nonce is a number that changes over time and is used to prevent value reuse. To prevent document reproduction, it can be a timestamp. A cryptographic hash function can also use it to vary input. Nonces can be used for authentication, hashing, or even electronic signatures.
5. Hash: A hash is a mathematical function that converts inputs of arbitrary length to outputs of fixed length. That is, regardless of file size, the hash will remain unique. A hash cannot generate input from hashed output, but it can identify a file. Hashes can be used to verify message integrity and authenticate data. Cryptographic hash functions add security to standard hash functions, making it difficult to decipher message contents or track senders.
Blockchain: Pros and Cons
The blockchain provides a trustworthy, secure, and trackable platform for business transactions quickly and affordably. The blockchain reduces paperwork, documentation errors, and the need for third parties to verify transactions.
Blockchain security relies on a system of unaltered transaction records with end-to-end encryption, reducing fraud and unauthorized activity. The blockchain also helps verify the authenticity of items like farm food, medicines, and even employee certification. The ability to control data gives users a level of privacy that no other platform can match.
In the case of Bitcoin, the blockchain can only handle seven transactions per second. Unlike Hyperledger and Visa, which can handle ten thousand transactions per second. Also, each participant node must verify and approve transactions, slowing down exchanges and limiting scalability.
The blockchain requires a lot of energy to run. In addition, the blockchain is not a hugely distributable system and it is destructible. The security of the block chain can be compromised by hackers; it is not completely foolproof. Also, since blockchain entries are immutable, data cannot be removed. The blockchain's high energy consumption and limited scalability reduce its efficiency.
Why Is Blockchain So Popular?
The blockchain is a technology giant. In 2018, 90% of US and European banks began exploring blockchain's potential. In 2021, 24% of companies are expected to invest $5 million to $10 million in blockchain. By the end of 2024, it is expected that corporations will spend $20 billion annually on blockchain technical services.
Blockchain is used in cryptocurrency, medical records storage, identity verification, election voting, security, agriculture, business, and many other fields. The blockchain offers a more secure, decentralized, and less corrupt system of making global payments, which cryptocurrency enthusiasts love. Users who want to save time and energy prefer it because it is faster and less bureaucratic than banking and healthcare systems.
Most organizations have jumped on the blockchain bandwagon, and for good reason: the blockchain industry has never had more potential. The launch of IBM's Blockchain Wire, Paystack, Aza Finance and Bloom are visible proof of the wonders that the blockchain has done. The blockchain's cryptocurrency segment may not be as popular in the future as the blockchain's other segments, as evidenced by the various industries where it is used. The blockchain is here to stay, and it will be discussed for a long time, not just in tech, but in many industries.
Read original post here

Dylan Smyth
4 years ago
10 Ways to Make Money Online in 2022
As a tech-savvy person (and software engineer) or just a casual technology user, I'm sure you've had this same question countless times: How do I make money online? and how do I make money with my PC/Mac?
You're in luck! Today, I will list the top 5 easiest ways to make money online. Maybe a top ten in the future? Top 5 tips for 2022.
1. Using the gig economy
There are many websites on the internet that allow you to earn extra money using skills and equipment that you already own.
I'm referring to the gig economy. It's a great way to earn a steady passive income from the comfort of your own home. For some sites, premium subscriptions are available to increase sales and access features like bidding on more proposals.
Some of these are:
- Freelancer
- Upwork
- Fiverr (⭐ my personal favorite)
- TaskRabbit
2. Mineprize
MINEPRIZE is a great way to make money online. What's more, You need not do anything! You earn money by lending your idle CPU power to MINEPRIZE.
To register with MINEPRIZE, all you need is an email address and a password. Let MINEPRIZE use your resources, and watch the money roll in! You can earn up to $100 per month by letting your computer calculate. That's insane.
3. Writing
“O Romeo, Romeo, why art thou Romeo?” Okay, I admit that not all writing is Shakespearean. To be a copywriter, you'll need to be fluent in English. Thankfully, we don't have to use typewriters anymore.
Writing is a skill that can earn you a lot of money (claps for the rhyme).
Here are a few ways you can make money typing on your fancy keyboard:
Self-publish a book
Write scripts for video creators
Write for social media
Book-checking
Content marketing help
What a list within a list!
4. Coding
Yes, kids. You've probably coded before if you understand
You've probably coded before if you understand
print("hello world");
Computational thinking (or coding) is one of the most lucrative ways to earn extra money, or even as a main source of income.
Of course, there are hardcode coders (like me) who write everything line by line, binary di — okay, that last part is a bit exaggerated.
But you can also make money by writing websites or apps or creating low code or no code platforms.
But you can also make money by writing websites or apps or creating low code or no code platforms.
Some low-code platforms
Sheet : spreadsheets to apps :
Loading... We'll install your new app... No-Code Your team can create apps and automate tasks. Agile…
www.appsheet.com
Low-code platform | Business app creator - Zoho Creator
Work is going digital, and businesses of all sizes must adapt quickly. Zoho Creator is a...
www.zoho.com
Sell your data with TrueSource. NO CODE NEEDED
Upload data, configure your product, and earn in minutes.
www.truesource.io
Cool, huh?
5. Created Content
If we use the internet correctly, we can gain unfathomable wealth and extra money. But this one is a bit more difficult. Unlike some of the other items on this list, it takes a lot of time up front.
I'm referring to sites like YouTube and Medium. It's a great way to earn money both passively and actively. With the likes of Jake- and Logan Paul, PewDiePie (a.k.a. Felix Kjellberg) and others, it's never too late to become a millionaire on YouTube. YouTubers are always rising to the top with great content.
6. NFTs and Cryptocurrency
It is now possible to amass large sums of money by buying and selling digital assets on NFTs and cryptocurrency exchanges. Binance's Initial Game Offer rewards early investors who produce the best results.
One awesome game sold a piece of its plot for US$7.2 million! It's Axie Infinity. It's free and available on Google Play and Apple Store.
7. Affiliate Marketing
Affiliate marketing is a form of advertising where businesses pay others (like bloggers) to promote their goods and services. Here's an example. I write a blog (like this one) and post an affiliate link to an item I recommend buying — say, a camera — and if you buy the camera, I get a commission!
These programs pay well:
- Elementor
- AWeber
- Sendinblue
- ConvertKit\sLeadpages
- GetResponse
- SEMRush\sFiverr
- Pabbly
8. Start a blog
Now, if you're a writer or just really passionate about something or a niche, blogging could potentially monetize that passion!
Create a blog about anything you can think of. It's okay to start right here on Medium, as I did.
9. Dropshipping
And I mean that in the best possible way — drop shopping is ridiculously easy to set up, but difficult to maintain for some.
Luckily, Shopify has made setting up an online store a breeze. Drop-shipping from Alibaba and DHGate is quite common. You've got a winner if you can find a local distributor willing to let you drop ship their product!
10. Set up an Online Course
If you have a skill and can articulate it, online education is for you.
Skillshare, Pluralsight, and Coursera have all made inroads in recent years, upskilling people with courses that YOU can create and earn from.
That's it for today! Please share if you liked this post. If not, well —
You might also like

Will Lockett
3 years ago
Russia's nukes may be useless
Russia's nuclear threat may be nullified by physics.
Putin seems nostalgic and wants to relive the Cold War. He's started a deadly war to reclaim the old Soviet state of Ukraine and is threatening the West with nuclear war. NATO can't risk starting a global nuclear war that could wipe out humanity to support Ukraine's independence as much as they want to. Fortunately, nuclear physics may have rendered Putin's nuclear weapons useless. However? How will Ukraine and NATO react?
To understand why Russia's nuclear weapons may be ineffective, we must first know what kind they are.
Russia has the world's largest nuclear arsenal, with 4,447 strategic and 1,912 tactical weapons (all of which are ready to be rolled out quickly). The difference between these two weapons is small, but it affects their use and logistics. Strategic nuclear weapons are ICBMs designed to destroy a city across the globe. Russia's ICBMs have many designs and a yield of 300–800 kilotonnes. 300 kilotonnes can destroy Washington. Tactical nuclear weapons are smaller and can be fired from artillery guns or small truck-mounted missile launchers, giving them a 1,500 km range. Instead of destroying a distant city, they are designed to eliminate specific positions, bases, or military infrastructure. They produce 1–50 kilotonnes.
These two nuclear weapons use different nuclear reactions. Pure fission bombs are compact enough to fit in a shell or small missile. All early nuclear weapons used this design for their fission bombs. This technology is inefficient for bombs over 50 kilotonnes. Larger bombs are thermonuclear. Thermonuclear weapons use a small fission bomb to compress and heat a hydrogen capsule, which undergoes fusion and releases far more energy than ignition fission reactions, allowing for effective giant bombs.
Here's Russia's issue.
A thermonuclear bomb needs deuterium (hydrogen with one neutron) and tritium (hydrogen with two neutrons). Because these two isotopes fuse at lower energies than others, the bomb works. One problem. Tritium is highly radioactive, with a half-life of only 12.5 years, and must be artificially made.
Tritium is made by irradiating lithium in nuclear reactors and extracting the gas. Tritium is one of the most expensive materials ever made, at $30,000 per gram.
Why does this affect Putin's nukes?
Thermonuclear weapons need tritium. Tritium decays quickly, so they must be regularly refilled at great cost, which Russia may struggle to do.
Russia has a smaller economy than New York, yet they are running an invasion, fending off international sanctions, and refining tritium for 4,447 thermonuclear weapons.
The Russian military is underfunded. Because the state can't afford it, Russian troops must buy their own body armor. Arguably, Putin cares more about the Ukraine conflict than maintaining his nuclear deterrent. Putin will likely lose power if he loses the Ukraine war.
It's possible that Putin halted tritium production and refueling to save money for Ukraine. His threats of nuclear attacks and escalating nuclear war may be a bluff.
This doesn't help Ukraine, sadly. Russia's tactical nuclear weapons don't need expensive refueling and will help with the invasion. So Ukraine still risks a nuclear attack. The bomb that destroyed Hiroshima was 15 kilotonnes, and Russia's tactical Iskander-K nuclear missile has a 50-kiloton yield. Even "little" bombs are deadly.
We can't guarantee it's happening in Russia. Putin may prioritize tritium. He knows the power of nuclear deterrence. Russia may have enough tritium for this conflict. Stockpiling a material with a short shelf life is unlikely, though.
This means that Russia's most powerful weapons may be nearly useless, but they may still be deadly. If true, this could allow NATO to offer full support to Ukraine and push the Russian tyrant back where he belongs. If Putin withholds funds from his crumbling military to maintain his nuclear deterrent, he may be willing to sink the ship with him. Let's hope the former.

Antonio Neto
4 years ago
Should you skip the minimum viable product?
Are MVPs outdated and have no place in modern product culture?
Frank Robinson coined "MVP" in 2001. In the same year as the Agile Manifesto, the first Scrum experiment began. MVPs are old.
The concept was created to solve the waterfall problem at the time.
The market was still sour from the .com bubble. The tech industry needed a new approach. Product and Agile gained popularity because they weren't waterfall.
More than 20 years later, waterfall is dead as dead can be, but we are still talking about MVPs. Does that make sense?
What is an MVP?
Minimum viable product. You probably know that, so I'll be brief:
[…] The MVP fits your company and customer. It's big enough to cause adoption, satisfaction, and sales, but not bloated and risky. It's the product with the highest ROI/risk. […] — Frank Robinson, SyncDev
MVP is a complete product. It's not a prototype. It's your product's first iteration, which you'll improve. It must drive sales and be user-friendly.
At the MVP stage, you should know your product's core value, audience, and price. We are way deep into early adoption territory.
What about all the things that come before?
Modern product discovery
Eric Ries popularized the term with The Lean Startup in 2011. (Ries would work with the concept since 2008, but wide adoption came after the book was released).
Ries' definition of MVP was similar to Robinson's: "Test the market" before releasing anything. Ries never mentioned money, unlike Jobs. His MVP's goal was learning.
“Remove any feature, process, or effort that doesn't directly contribute to learning” — Eric Ries, The Lean Startup
Product has since become more about "what" to build than building it. What started as a learning tool is now a discovery discipline: fake doors, prototyping, lean inception, value proposition canvas, continuous interview, opportunity tree... These are cheap, effective learning tools.
Over time, companies realized that "maximum ROI divided by risk" started with discovery, not the MVP. MVPs are still considered discovery tools. What is the problem with that?
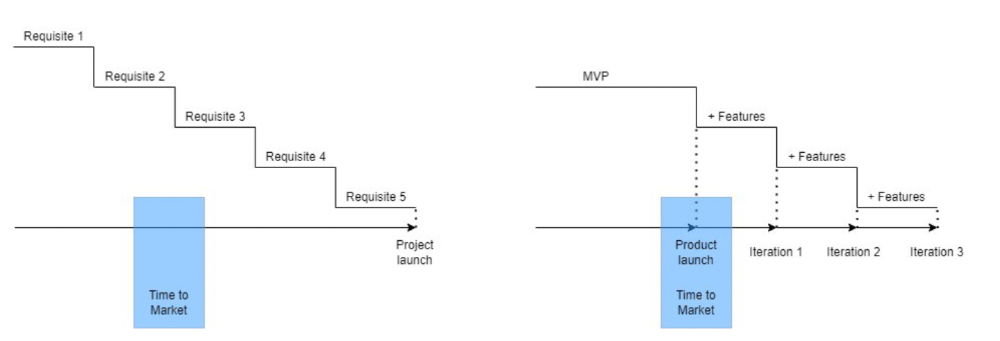
Time to Market vs Product Market Fit
Waterfall's Time to Market is its biggest flaw. Since projects are sliced horizontally rather than vertically, when there is nothing else to be done, it’s not because the product is ready, it’s because no one cares to buy it anymore.
MVPs were originally conceived as a way to cut corners and speed Time to Market by delivering more customer requests after they paid.
Original product development was waterfall-like.
Time to Market defines an optimal, specific window in which value should be delivered. It's impossible to predict how long or how often this window will be open.
Product Market Fit makes this window a "state." You don’t achieve Product Market Fit, you have it… and you may lose it.
Take, for example, Snapchat. They had a great time to market, but lost product-market fit later. They regained product-market fit in 2018 and have grown since.
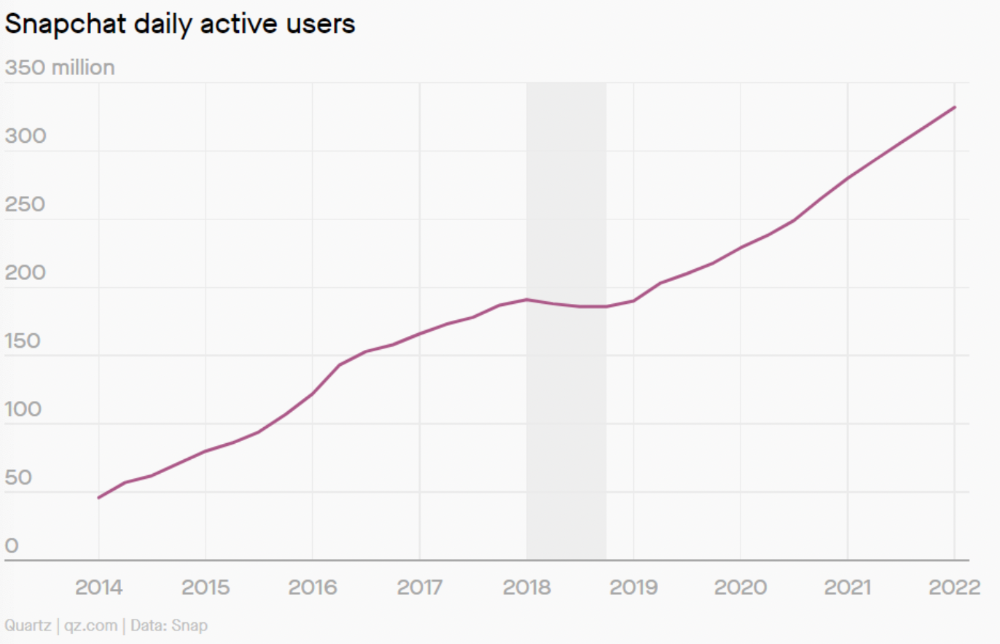
An MVP couldn't handle this. What should Snapchat do? Launch Snapchat 2 and see what the market was expecting differently from the last time? MVPs are a snapshot in time that may be wrong in two weeks.
MVPs are mini-projects. Instead of spending a lot of time and money on waterfall, you spend less but are still unsure of the results.
MVPs aren't always wrong. When releasing your first product version, consider an MVP.
Minimum viable product became less of a thing on its own and more interchangeable with Alpha Release or V.1 release over time.
Modern discovery technics are more assertive and predictable than the MVP, but clarity comes only when you reach the market.
MVPs aren't the starting point, but they're the best way to validate your product concept.

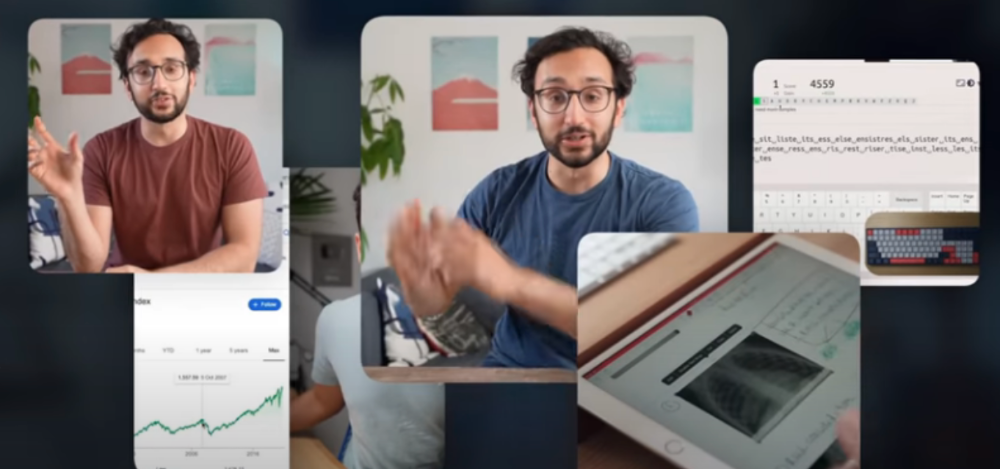
Owolabi Judah
3 years ago
How much did YouTube pay for 10 million views?
Ali's $1,054,053.74 YouTube Adsense haul.
YouTuber, entrepreneur, and former doctor Ali Abdaal. He began filming productivity and financial videos in 2017. Ali Abdaal has 3 million YouTube subscribers and has crossed $1 million in AdSense revenue. Crazy, no?
Ali will share the revenue of his top 5 youtube videos, things he's learned that you can apply to your side hustle, and how many views it takes to make a livelihood off youtube.
First, "The Long Game."
All good things take time to bear fruit. Compounding improves everything. Long-term work yields better returns. Ali made his first dollar after nine months and 85 videos.
Second, "One piece of content can transform your life, but you never know which one."
Had he abandoned YouTube at 84 videos without making any money, he wouldn't have filmed the 85th video that altered everything.
Third Lesson: Your Industry Choice Can Multiply.
The industry or niche you target as a business owner or side hustler can have a major impact on how much money you make.
Here are the top 5 videos.
1) 9.8m views: $191,258.16 for 9 passive income ideas
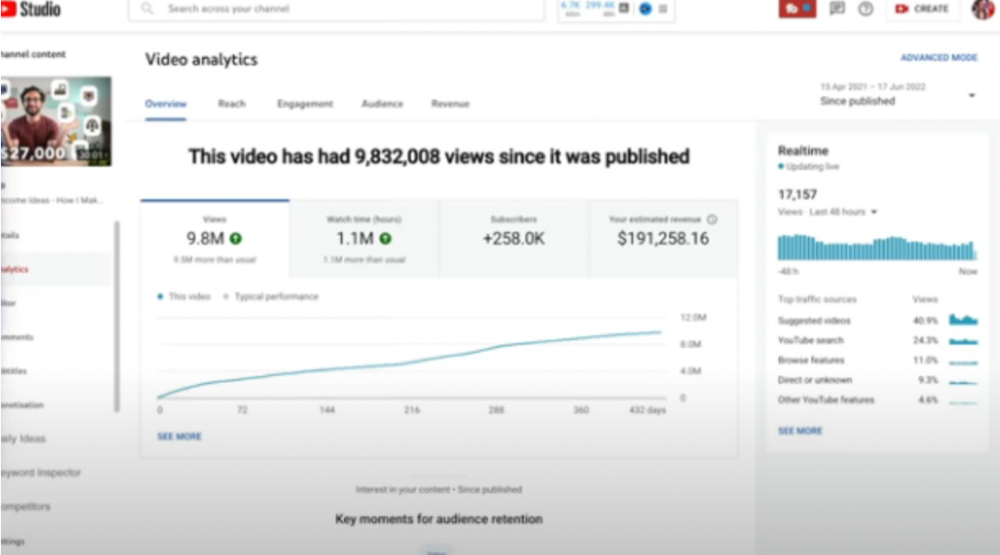
Ali made 2 points.
We should consider YouTube videos digital assets. They're investments, which make us money. His investments are yielding passive income.
Investing extra time and effort in your films can pay off.
2) How to Invest for Beginners — 5.2m Views: $87,200.08.
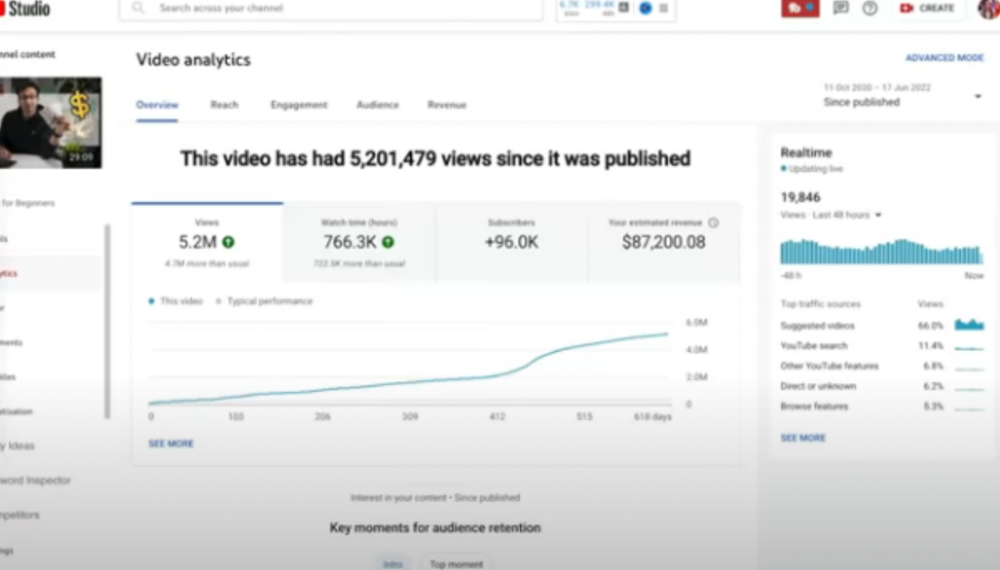
This video did poorly in the first several weeks after it was published; it was his tenth poorest performer. Don't worry about things you can't control. This applies to life, not just YouTube videos.
He stated we constantly have anxieties, fears, and concerns about things outside our control, but if we can find that line, life is easier and more pleasurable.
3) How to Build a Website in 2022— 866.3k views: $42,132.72.
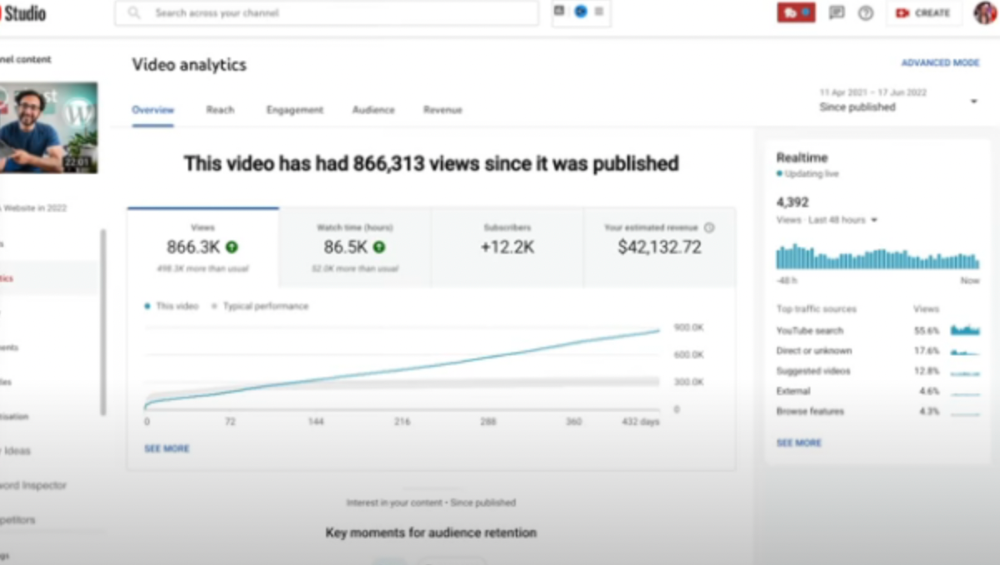
The RPM was $48.86 per thousand views, making it his highest-earning video. Squarespace, Wix, and other website builders are trying to put ads on it and competing against one other, so ad rates go up.
Because it was beyond his niche, Ali almost didn't make the video. He made the video because he wanted to help at least one person.
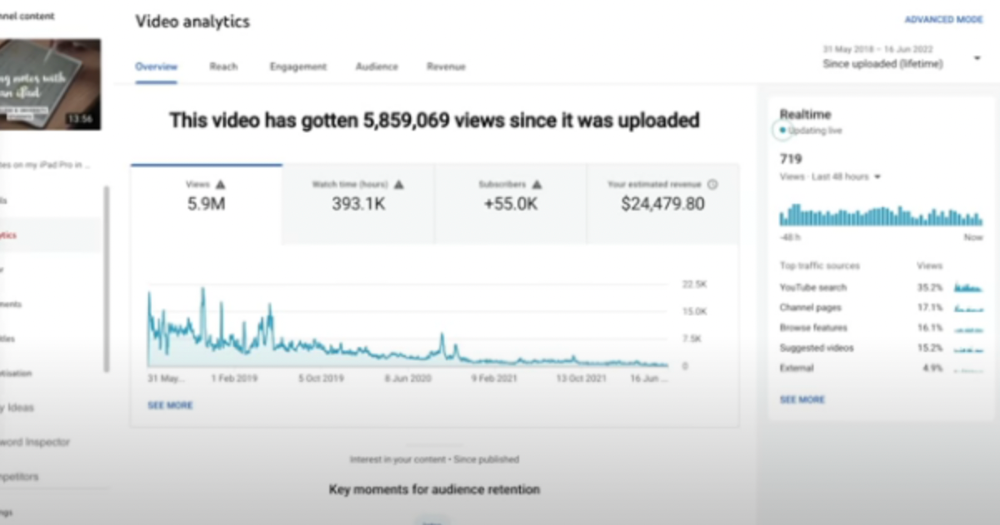
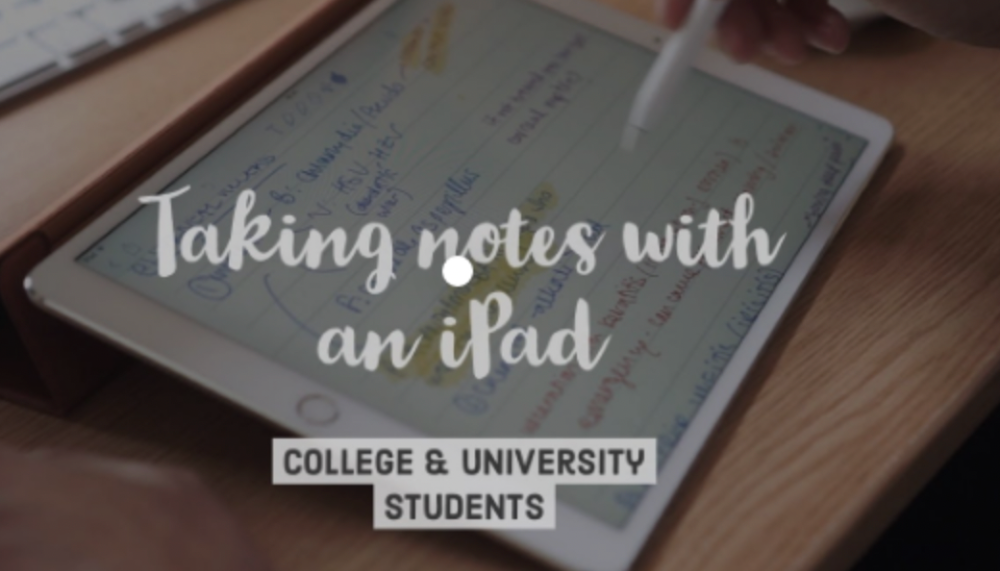
4) How I take notes on my iPad in medical school — 5.9m views: $24,479.80
85th video. It's the video that affected Ali's YouTube channel and his life the most. The video's success wasn't certain.
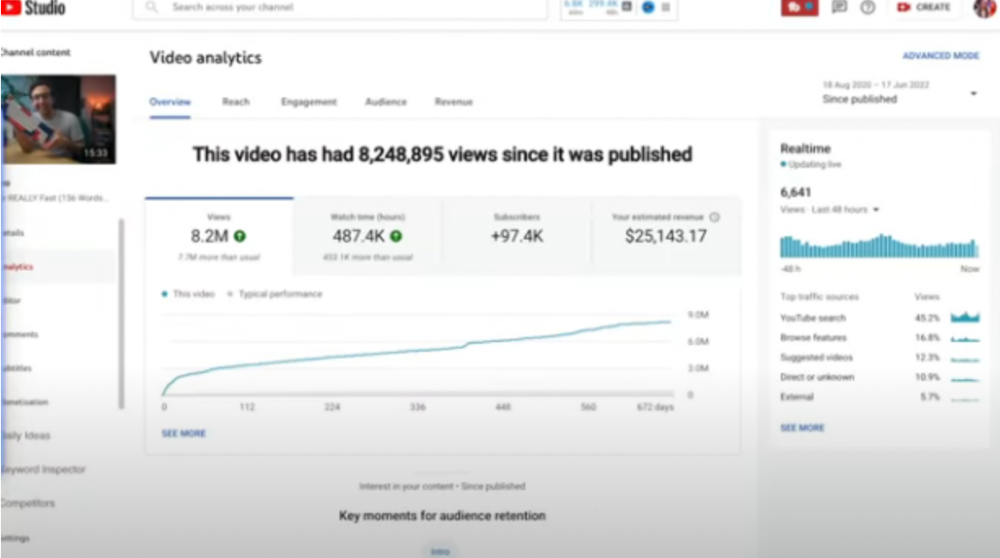
5) How I Type Fast 156 Words Per Minute — 8.2M views: $25,143.17
Ali didn't know this video would perform well; he made it because he can type fast and has been practicing for 10 years. So he made a video with his best advice.
How many views to different wealth levels?
It depends on geography, niche, and other monetization sources. To keep things simple, he would solely utilize AdSense.
How many views to generate money?
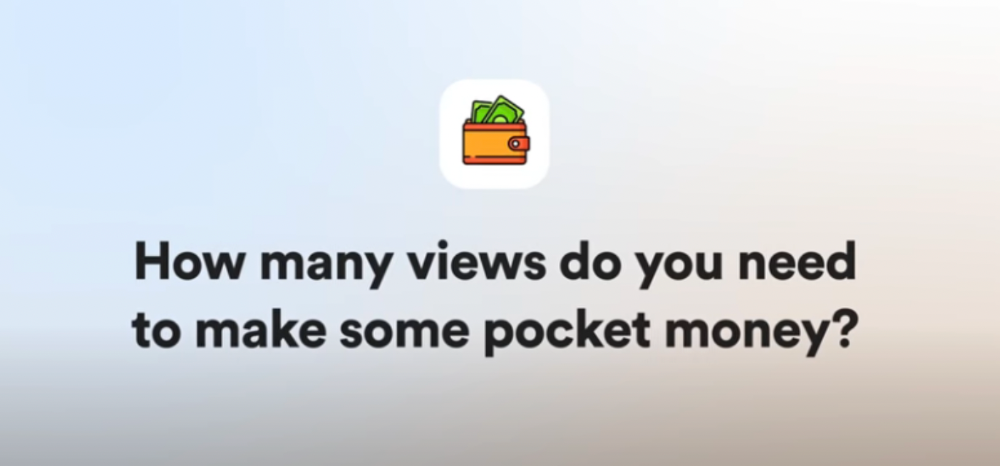
To generate money on Youtube, you need 1,000 subscribers and 4,000 hours of view time. How much work do you need to make pocket money?
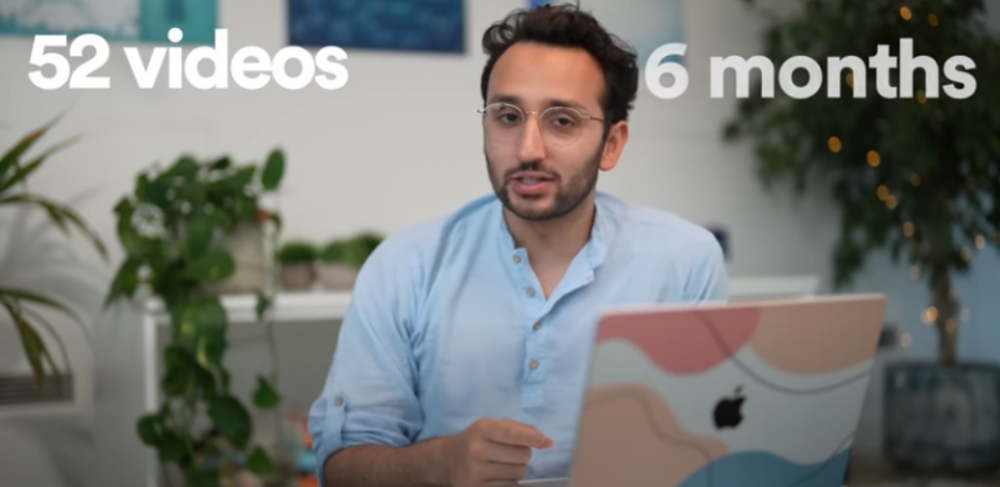
Ali's first 1,000 subscribers took 52 videos and 6 months. The typical channel with 1,000 subscribers contains 152 videos, according to Tubebuddy. It's time-consuming.
After monetizing, you'll need 15,000 views/month to make $5-$10/day.
How many views to go part-time?
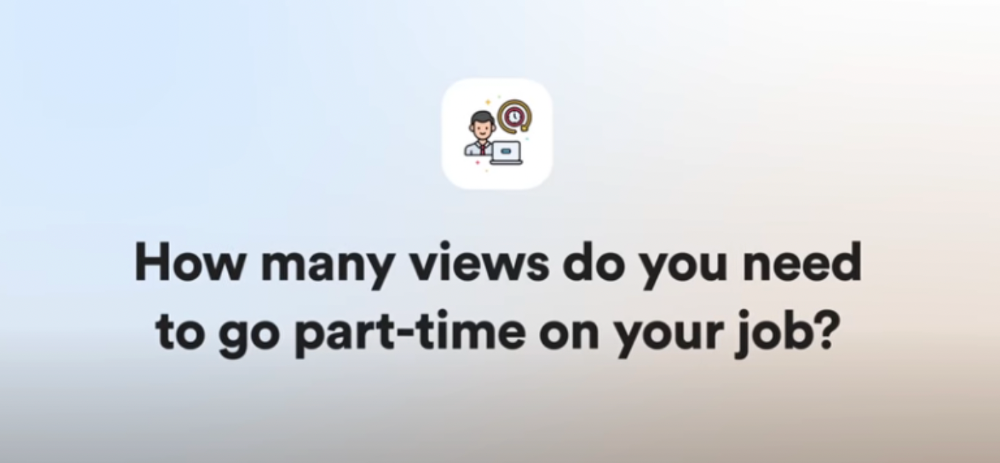
Say you make $35,000/year at your day job. If you work 5 days/week, you make $7,000/year each day. If you want to drop down from 5 days to 4 days/week, you need to make an extra $7,000/year from YouTube, or $600/month.
What's the quit-your-job budget?
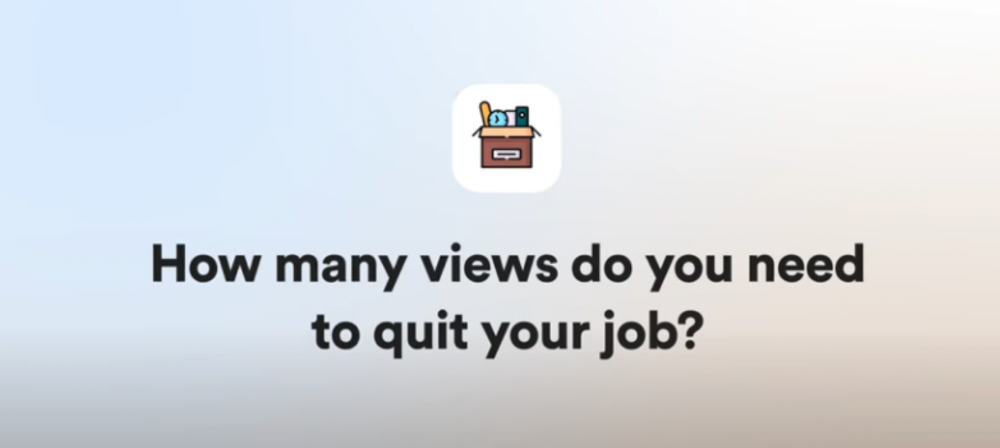
Silicon Valley Girl is in a highly successful niche targeting tech-focused folks in the west. When her channel had 500k views/month, she made roughly $3,000/month or $47,000/year, enough to quit your work.
Marina has another 1.5m subscriber channel in Russia, which has a lower rpm because fewer corporations advertise there than in the west. 2.3 million views/month is $4,000/month or $50,000/year, enough to quit your employment.
Marina is an intriguing example because she has three YouTube channels with the same skills, but one is 16x more profitable due to the niche she chose.
In Ali's case, he made 100+ videos when his channel was producing enough money to quit his job, roughly $4,000/month.
How many views make you rich?
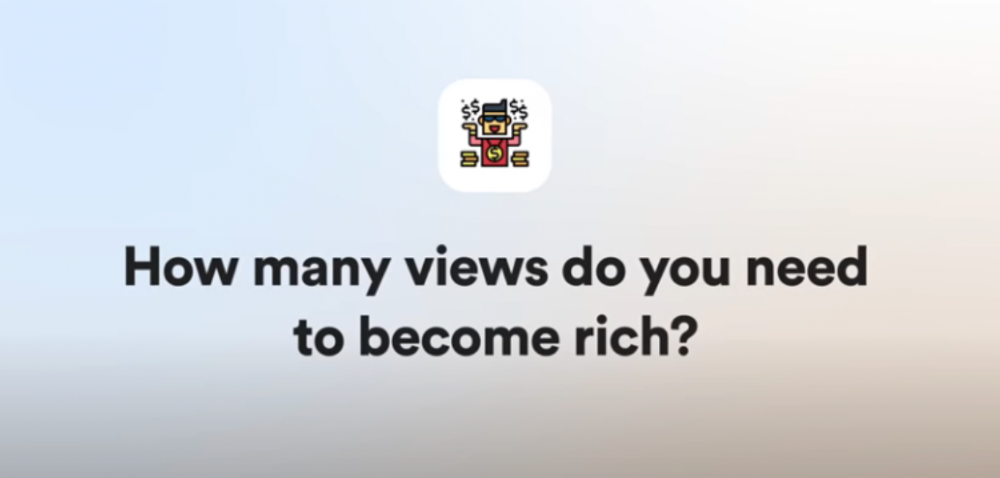
Depending on how you define rich. Ali felt prosperous with over $100,000/year and 3–5m views/month.
Conclusion
YouTubers and artists don't treat their work like a company, which is a mistake. Businesses have been attempting to figure this out for decades, if not centuries.
We can learn from the business world how to monetize YouTube, Instagram, and Tiktok and make them into sustainable enterprises where we can hire people and delegate tasks.
Bonus
Watch Ali's video explaining all this:
This post is a summary. Read the full article here