


More on Marketing

Joseph Mavericks
3 years ago
You Don't Have to Spend $250 on TikTok Ads Because I Did
900K impressions, 8K clicks, and $$$ orders…

I recently started dropshipping. Now that I own my business and can charge it as a business expense, it feels less like money wasted if it doesn't work. I also made t-shirts to sell. I intended to open a t-shirt store and had many designs on a hard drive. I read that Tiktok advertising had a high conversion rate and low cost because they were new. According to many, the advertising' cost/efficiency ratio would plummet and become as bad as Google or Facebook Ads. Now felt like the moment to try Tiktok marketing and dropshipping. I work in marketing for a SaaS firm and have seen how poorly ads perform. I wanted to try it alone.
I set up $250 and ran advertising for a week. Before that, I made my own products, store, and marketing. In this post, I'll show you my process and results.
Setting up the store
Dropshipping is a sort of retail business in which the manufacturer ships the product directly to the client through an online platform maintained by a seller. The seller takes orders but has no stock. The manufacturer handles all orders. This no-stock concept increases profitability and flexibility.
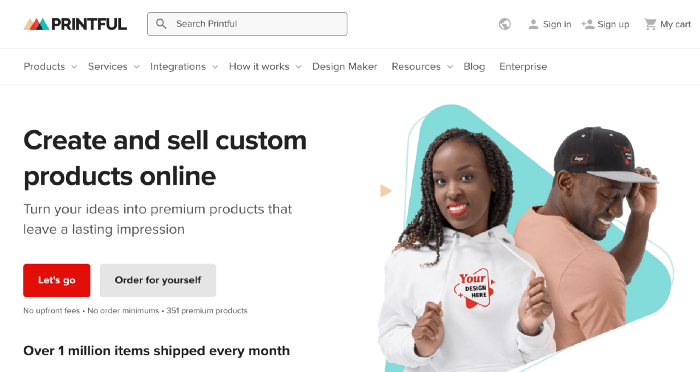
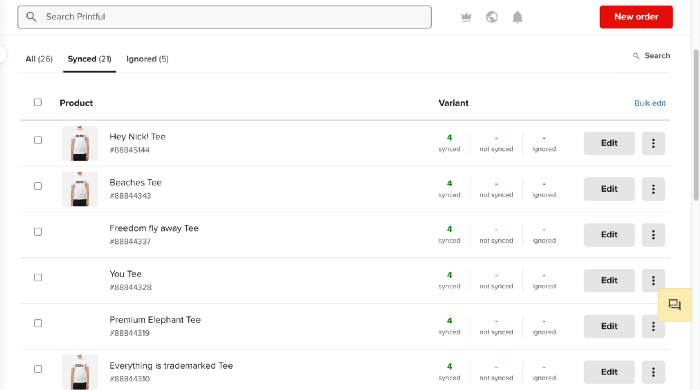
In my situation, I used previous t-shirt designs to make my own product. I didn't want to handle order fulfillment logistics, so I looked for a way to print my designs on demand, ship them, and handle order tracking/returns automatically. So I found Printful.
I needed to connect my backend and supplier to a storefront so visitors could buy. 99% of dropshippers use Shopify, but I didn't want to master the difficult application. I wanted a one-day project. I'd previously worked with Big Cartel, so I chose them.
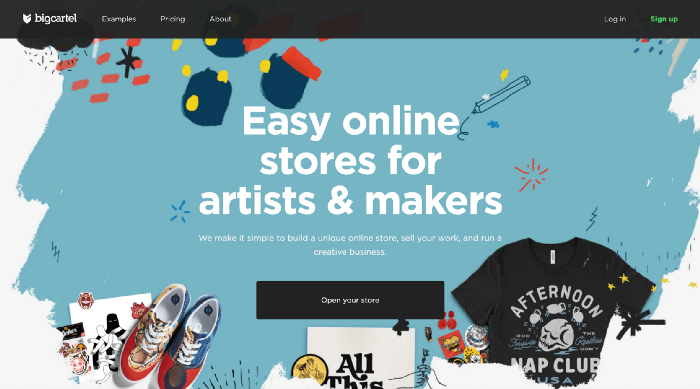
Big Cartel doesn't collect commissions on sales, simply a monthly flat price ($9.99 to $19.99 depending on your plan).
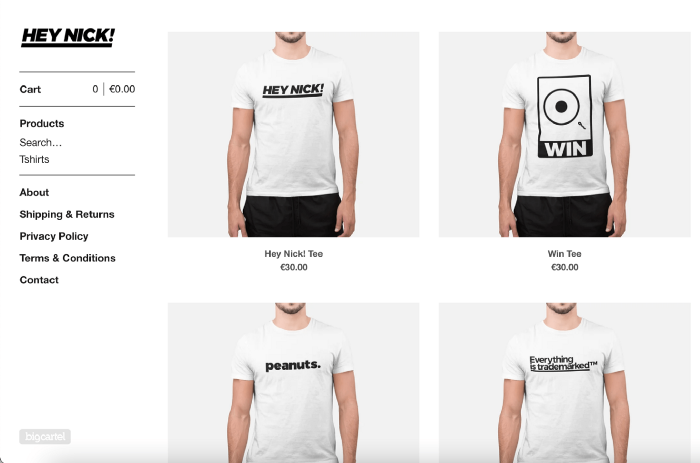
After opening a Big Cartel account, I uploaded 21 designs and product shots, then synced each product with Printful.
Developing the ads
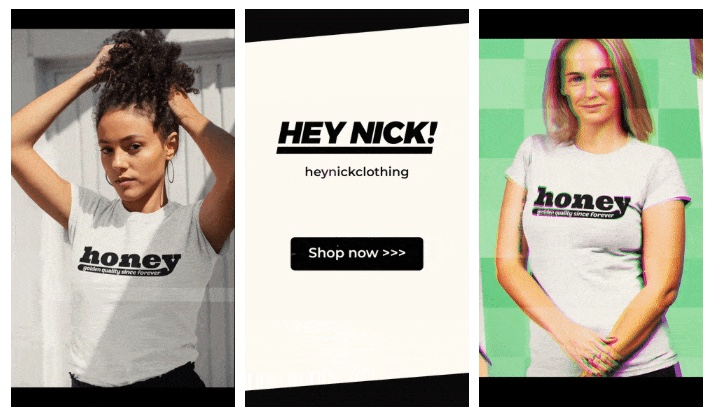
I mocked up my designs on cool people photographs from placeit.net, a great tool for creating product visuals when you don't have a studio, camera gear, or models to wear your t-shirts.
I opened an account on the website and had advertising visuals within 2 hours.
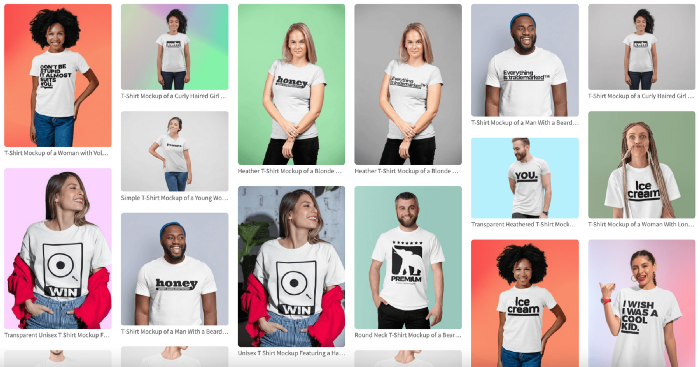
Because my designs are simple (black design on white t-shirt), I chose happy, stylish people on plain-colored backdrops. After that, I had to develop an animated slideshow.
Because I'm a graphic designer, I chose to use Adobe Premiere to create animated Tiktok advertising.
Premiere is a fancy video editing application used for more than advertisements. Premiere is used to edit movies, not social media marketing. I wanted this experiment to be quick, so I got 3 social media ad templates from motionarray.com and threw my visuals in. All the transitions and animations were pre-made in the files, so it only took a few hours to compile. The result:
I downloaded 3 different soundtracks for the videos to determine which would convert best.
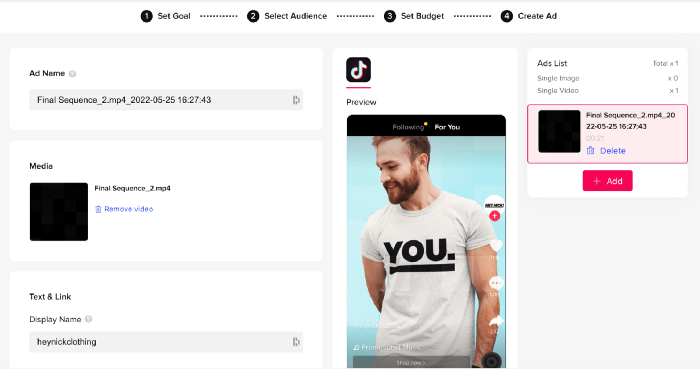
After that, I opened a Tiktok business account, uploaded my films, and inserted ad info. They went live within one hour.
The (poor) outcomes
As a European company, I couldn't deliver ads in the US. All of my advertisements' material (title, description, and call to action) was in English, hence they continued getting rejected in Europe for countries that didn't speak English. There are a lot of them:
I lost a lot of quality traffic, but I felt that if the images were engaging, people would check out the store and buy my t-shirts. I was wrong.
51,071 impressions on Day 1. 0 orders after 411 clicks
114,053 impressions on Day 2. 1.004 clicks and no orders
Day 3: 987 clicks, 103,685 impressions, and 0 orders
101,437 impressions on Day 4. 0 orders after 963 clicks
115,053 impressions on Day 5. 1,050 clicks and no purchases
125,799 impressions on day 6. 1,184 clicks, no purchases
115,547 impressions on Day 7. 1,050 clicks and no purchases
121,456 impressions on day 8. 1,083 clicks, no purchases
47,586 impressions on Day 9. 419 Clicks. No orders
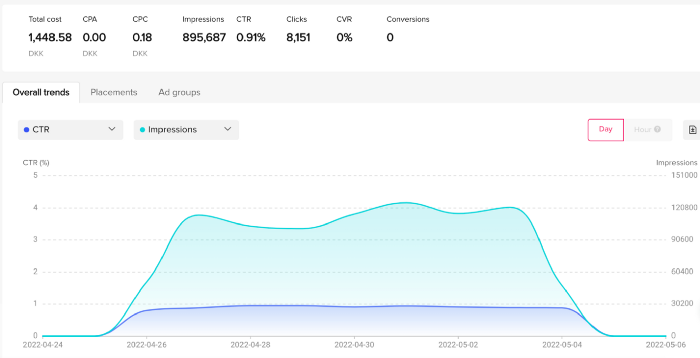
My overall conversion rate for video advertisements was 0.9%. TikTok's paid ad formats all result in strong engagement rates (ads average 3% to 12% CTR to site), therefore a 1 to 2% CTR should have been doable.
My one-week experiment yielded 8,151 ad clicks but no sales. Even if 0.1% of those clicks converted, I should have made 8 sales. Even companies with horrible web marketing would get one download or trial sign-up for every 8,151 clicks. I knew that because my advertising were in English, I had no impressions in the main EU markets (France, Spain, Italy, Germany), and that this impacted my conversion potential. I still couldn't believe my numbers.
I dug into the statistics and found that Tiktok's stats didn't match my store traffic data.
Looking more closely at the numbers
My ads were approved on April 26 but didn't appear until April 27. My store dashboard showed 440 visitors but 1,004 clicks on Tiktok. This happens often while tracking campaign results since different platforms handle comparable user activities (click, view) differently. In online marketing, residual data won't always match across tools.
My data gap was too large. Even if half of the 1,004 persons who clicked closed their browser or left before the store site loaded, I would have gained 502 visitors. The significant difference between Tiktok clicks and Big Cartel store visits made me suspicious. It happened all week:
Day 1: 440 store visits and 1004 ad clicks
Day 2: 482 store visits, 987 ad clicks
3rd day: 963 hits on ads, 452 store visits
443 store visits and 1,050 ad clicks on day 4.
Day 5: 459 store visits and 1,184 ad clicks
Day 6: 430 store visits and 1,050 ad clicks
Day 7: 409 store visits and 1,031 ad clicks
Day 8: 166 store visits and 418 ad clicks
The disparity wasn't related to residual data or data processing. The disparity between visits and clicks looked regular, but I couldn't explain it.
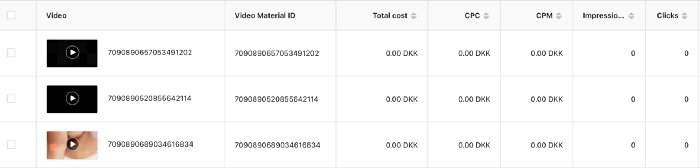
After the campaign concluded, I discovered all my creative assets (the videos) had a 0% CTR and a $0 expenditure in a separate dashboard. Whether it's a dashboard reporting issue or a budget allocation bug, online marketers shouldn't see this.
Tiktok can present any stats they want on their dashboard, just like any other platform that runs advertisements to promote content to its users. I can't verify that 895,687 individuals saw and clicked on my ad. I invested $200 for what appears to be around 900K impressions, which is an excellent ROI. No one bought a t-shirt, even an unattractive one, out of 900K people?
Would I do it again?
Nope. Whether I didn't make sales because Tiktok inflated the dashboard numbers or because I'm horrible at producing advertising and items that sell, I’ll stick to writing content and making videos. If setting up a business and ads in a few days was all it took to make money online, everyone would do it.
Video advertisements and dropshipping aren't dead. As long as the internet exists, people will click ads and buy stuff. Converting ads and selling stuff takes a lot of work, and I want to focus on other things.
I had always wanted to try dropshipping and I’m happy I did, I just won’t stick to it because that’s not something I’m interested in getting better at.
If I want to sell t-shirts again, I'll avoid Tiktok advertisements and find another route.

Camilla Dudley
3 years ago
How to gain Twitter followers: A 101 Guide

No wonder brands use Twitter to reach their audience. 53% of Twitter users buy new products first.
Twitter growth does more than make your brand look popular. It helps clients trust your business. It boosts your industry standing. It shows clients, prospects, and even competitors you mean business.
How can you naturally gain Twitter followers?
Share useful information
Post visual content
Tweet consistently
Socialize
Spread your @name everywhere.
Use existing customers
Promote followers
Share useful information
Twitter users join conversations and consume material. To build your followers, make sure your material appeals to them and gives value, whether it's sales, product lessons, or current events.
Use Twitter Analytics to learn what your audience likes.
Explore popular topics by utilizing relevant keywords and hashtags. Check out this post on how to use Twitter trends.
Post visual content
97% of Twitter users focus on images, so incorporating media can help your Tweets stand out. Visuals and videos make content more engaging and memorable.
Tweet often
Your audience should expect regular content updates. Plan your ideas and tweet during crucial seasons and events with a content calendar.
Socialize
Twitter connects people. Do more than tweet. Follow industry leaders. Retweet influencers, engage with thought leaders, and reply to mentions and customers to boost engagement.
Micro-influencers can promote your brand or items. They can help you gain new audiences' trust.
Spread your @name everywhere.
Maximize brand exposure. Add a follow button on your website, link to it in your email signature and newsletters, and promote it on business cards or menus.
Use existing customers
Emails can be used to find existing Twitter clients. Upload your email contacts and follow your customers on Twitter to start a dialogue.
Promote followers
Run a followers campaign to boost your organic growth. Followers campaigns promote your account to a particular demographic, and you only pay when someone follows you.
Consider short campaigns to enhance momentum or an always-on campaign to gain new followers.
Increasing your brand's Twitter followers takes effort and experimentation, but the payback is huge.
👋 Follow me on twitter

Saskia Ketz
2 years ago
I hate marketing for my business, but here's how I push myself to keep going
Start now.

When it comes to building my business, I’m passionate about a lot of things. I love creating user experiences that simplify branding essentials. I love creating new typefaces and color combinations to inspire logo designers. I love fixing problems to improve my product.
Business marketing isn't my thing.
This is shared by many. Many solopreneurs, like me, struggle to advertise their business and drive themselves to work on it.
Without a lot of promotion, no company will succeed. Marketing is 80% of developing a firm, and when you're starting out, it's even more. Some believe that you shouldn't build anything until you've begun marketing your idea and found enough buyers.
Marketing your business without marketing experience is difficult. There are various outlets and techniques to learn. Instead of figuring out where to start, it's easier to return to your area of expertise, whether that's writing, designing product features, or improving your site's back end. Right?
First, realize that your role as a founder is to market your firm. Being a founder focused on product, I rarely work on it.
Secondly, use these basic methods that have helped me dedicate adequate time and focus to marketing. They're all simple to apply, and they've increased my business's visibility and success.
1. Establish buckets for every task.
You've probably heard to schedule tasks you don't like. As simple as it sounds, blocking a substantial piece of my workday for marketing duties like LinkedIn or Twitter outreach, AppSumo customer support, or SEO has forced me to spend time on them.
Giving me lots of room to focus on product development has helped even more. Sure, this means scheduling time to work on product enhancements after my four-hour marketing sprint.
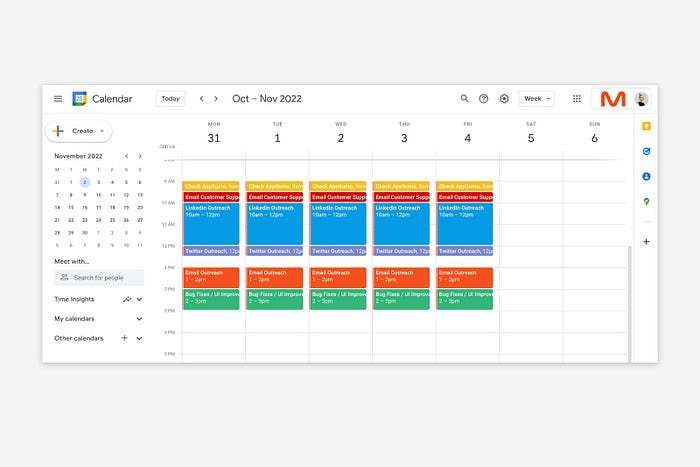
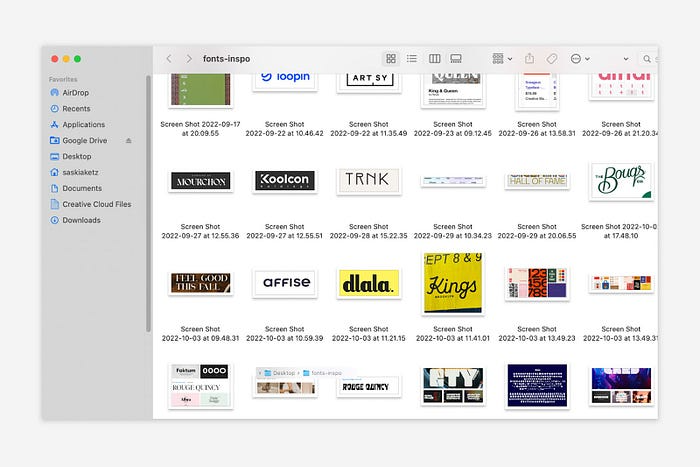
It also involves making space to store product inspiration and ideas throughout the day so I don't get distracted. This is like the advice to keep a notebook beside your bed to write down your insomniac ideas. I keep fonts, color palettes, and product ideas in folders on my desktop. Knowing these concepts won't be lost lets me focus on marketing in the moment. When I have limited time to work on something, I don't have to conduct the research I've been collecting, so I can get more done faster.
2. Look for various accountability systems
Accountability is essential for self-discipline. To keep focused on my marketing tasks, I've needed various streams of accountability, big and little.
Accountability groups are great for bigger things. SaaS Camp, a sales outreach coaching program, is mine. We discuss marketing duties and results every week. This motivates me to do enough each week to be proud of my accomplishments. Yet hearing what works (or doesn't) for others gives me benchmarks for my own marketing outcomes and plenty of fresh techniques to attempt.
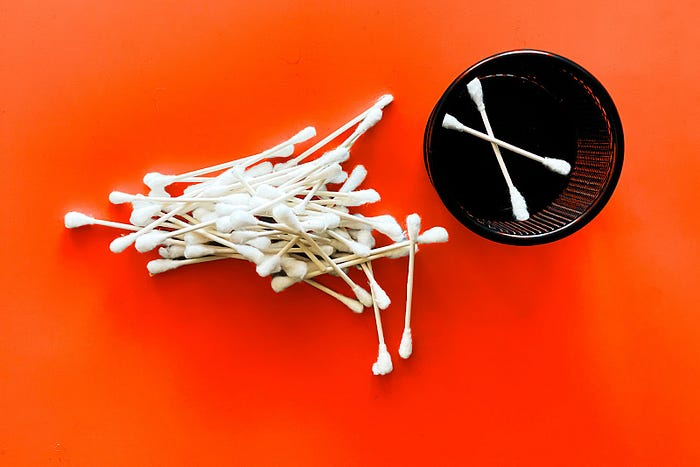
… say, I want to DM 50 people on Twitter about my product — I get that many Q-tips and place them in one pen holder on my desk.
The best accountability group can't watch you 24/7. I use a friend's simple method that shouldn't work (but it does). When I have a lot of marketing chores, like DMing 50 Twitter users about my product, That many Q-tips go in my desk pen holder. After each task, I relocate one Q-tip to an empty pen holder. When you have a lot of minor jobs to perform, it helps to see your progress. You might use toothpicks, M&Ms, or anything else you have a lot of.
3. Continue to monitor your feedback loops
Knowing which marketing methods work best requires monitoring results. As an entrepreneur with little go-to-market expertise, every tactic I pursue is an experiment. I need to know how each trial is doing to maximize my time.
I placed Google and Facebook advertisements on hold since they took too much time and money to obtain Return. LinkedIn outreach has been invaluable to me. I feel that talking to potential consumers one-on-one is the fastest method to grasp their problem areas, figure out my messaging, and find product market fit.
Data proximity offers another benefit. Seeing positive results makes it simpler to maintain doing a work you don't like. Why every fitness program tracks progress.
Marketing's goal is to increase customers and revenues, therefore I've found it helpful to track those metrics and celebrate monthly advances. I provide these updates for extra accountability.
Finding faster feedback loops is also motivating. Marketing brings more clients and feedback, in my opinion. Product-focused founders love that feedback. Positive reviews make me proud that my product is benefitting others, while negative ones provide me with suggestions for product changes that can improve my business.
The best advice I can give a lone creator who's afraid of marketing is to just start. Start early to learn by doing and reduce marketing stress. Start early to develop habits and successes that will keep you going. The sooner you start, the sooner you'll have enough consumers to return to your favorite work.
You might also like

Onchain Wizard
3 years ago
Three Arrows Capital & Celsius Updates
I read 1k+ page 3AC liquidation documentation so you don't have to. Also sharing revised Celsius recovery plans.
3AC's liquidation documents:
Someone disclosed 3AC liquidation records in the BVI courts recently. I'll discuss the leak's timeline and other highlights.
Three Arrows Capital began trading traditional currencies in emerging markets in 2012. They switched to equities and crypto, then purely crypto in 2018.
By 2020, the firm had $703mm in net assets and $1.8bn in loans (these guys really like debt).
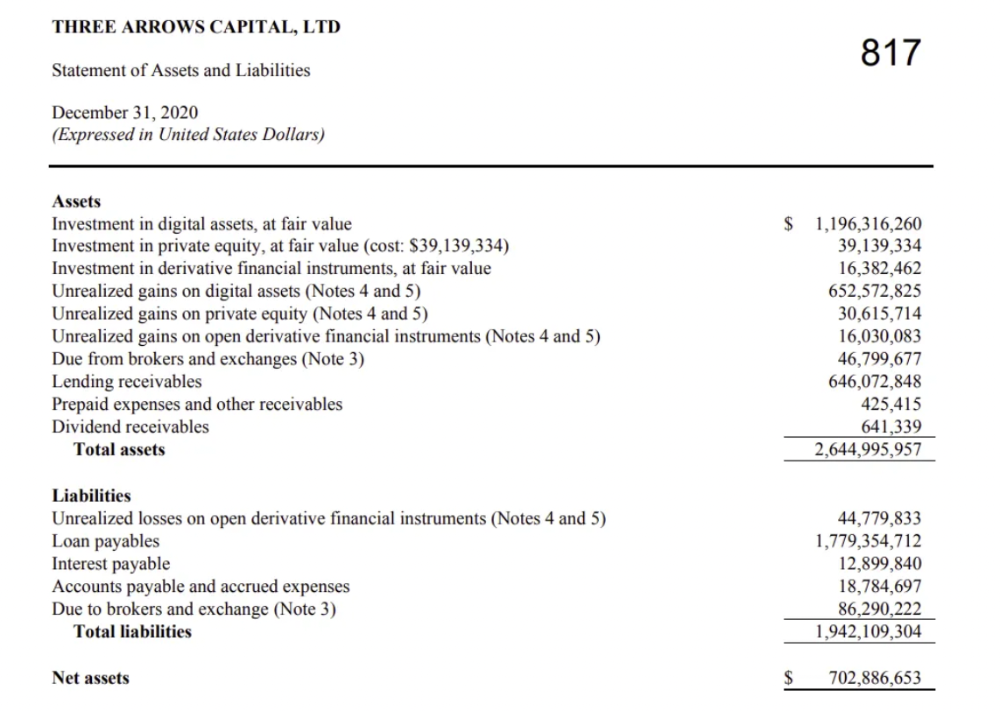
The firm's net assets under control reached $3bn in April 2022, according to the filings. 3AC had $600mm of LUNA/UST exposure before May 9th 2022, which put them over.
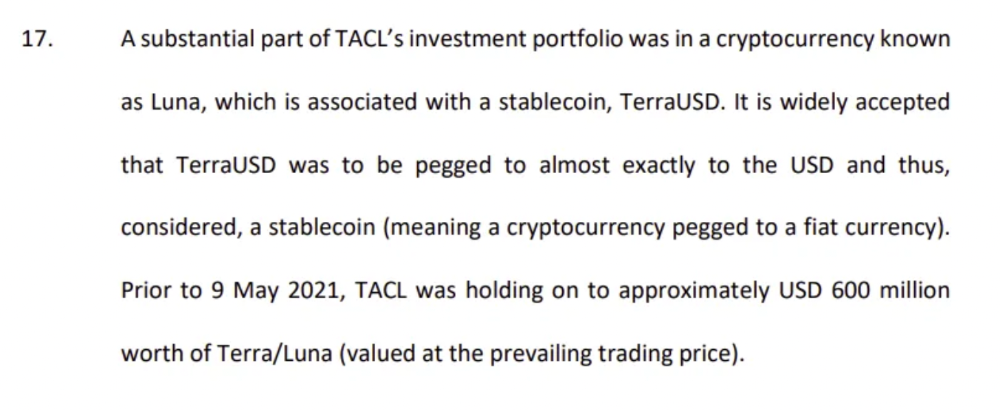
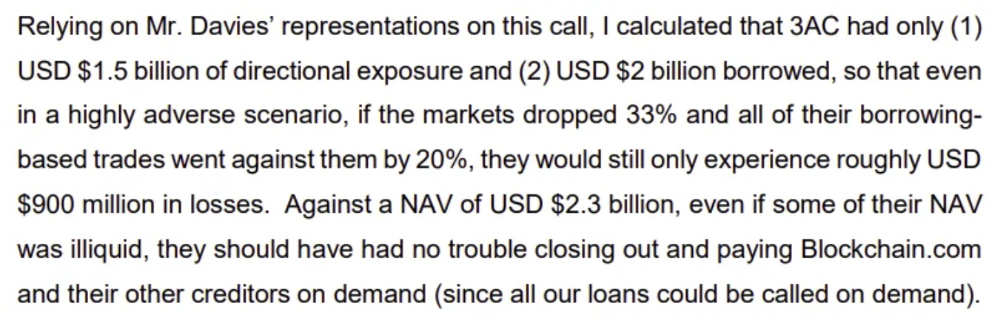
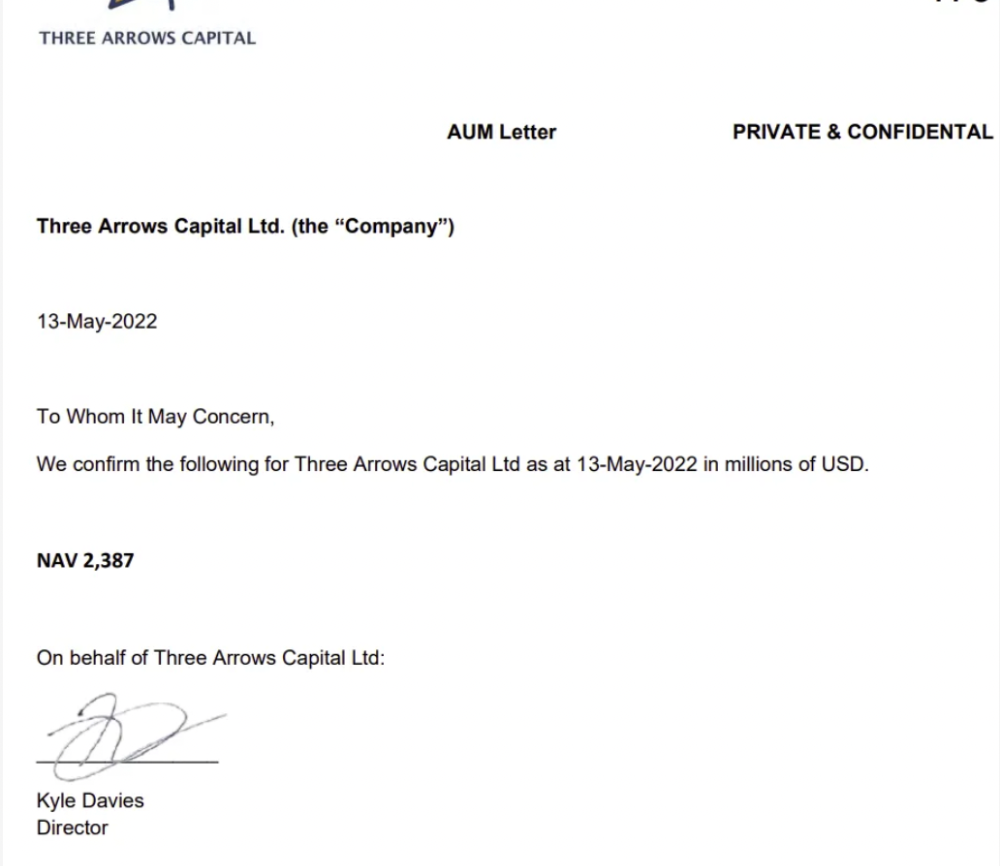
LUNA and UST go to zero quickly (I wrote about the mechanics of the blowup here). Kyle Davies, 3AC co-founder, told Blockchain.com on May 13 that they have $2.4bn in assets and $2.3bn NAV vs. $2bn in borrowings. As BTC and ETH plunged 33% and 50%, the company became insolvent by mid-2022.
3AC sent $32mm to Tai Ping Shen, a Cayman Islands business owned by Su Zhu and Davies' partner, Kelly Kaili Chen (who knows what is going on here).
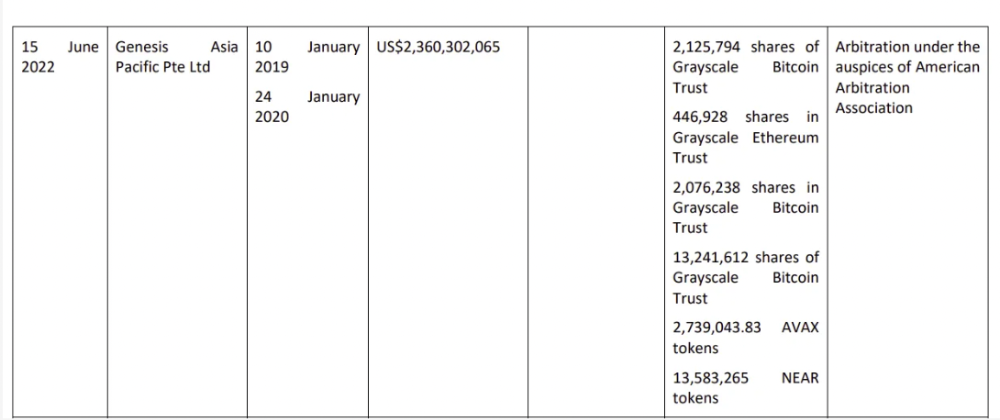
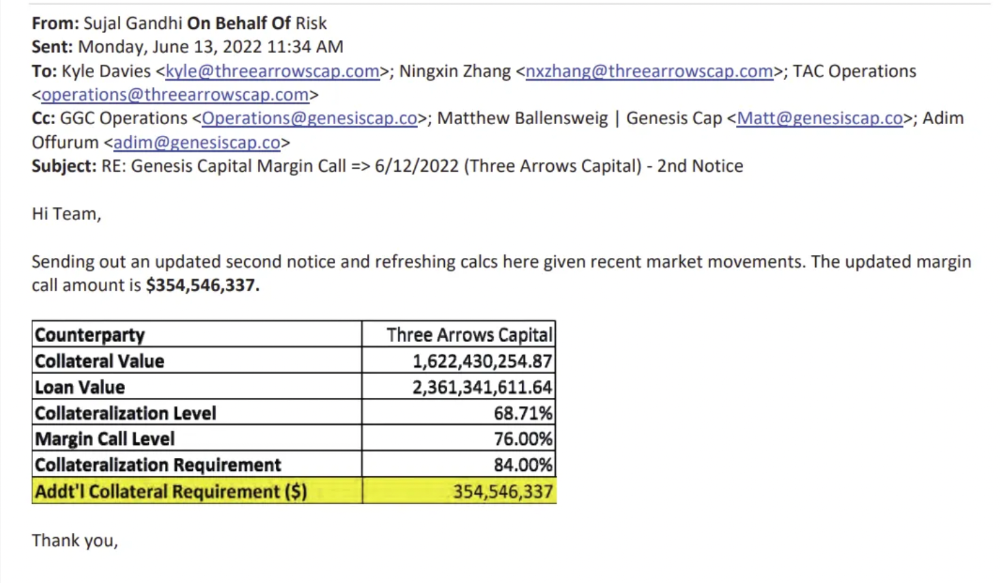
3AC had borrowed over $3.5bn in notional principle, with Genesis ($2.4bn) and Voyager ($650mm) having the most exposure.
Genesis demanded $355mm in further collateral in June.
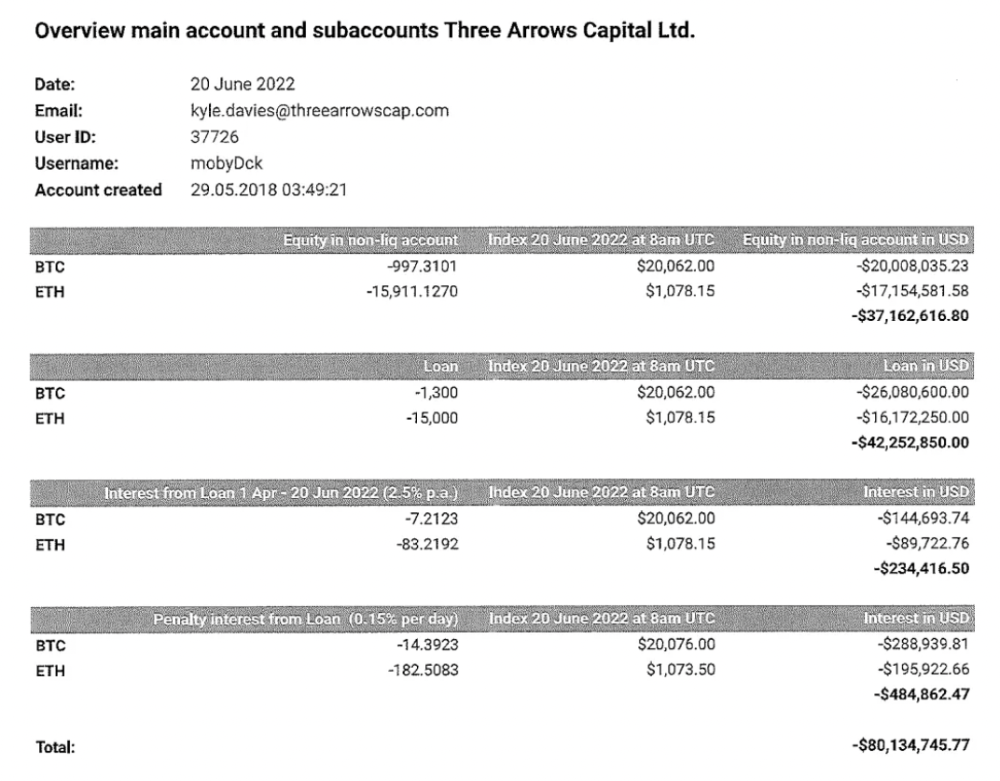
Deribit (another 3AC investment) called for $80 million in mid-June.
Even in mid-June, the corporation was trying to borrow more money to stay afloat. They approached Genesis for another $125mm loan (to pay another lender) and HODLnauts for BTC & ETH loans.
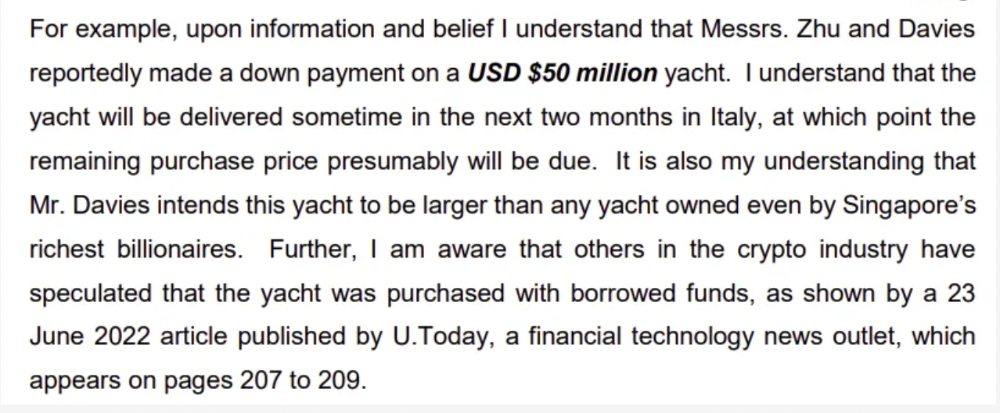
Pretty crazy. 3AC founders used borrowed money to buy a $50 million boat, according to the leak.
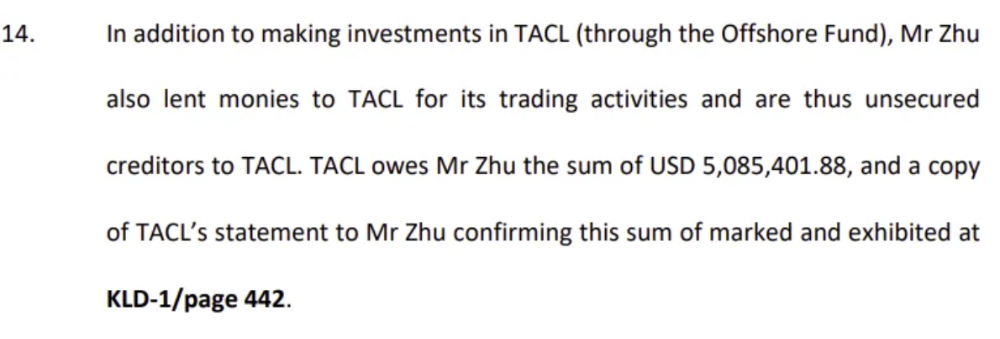
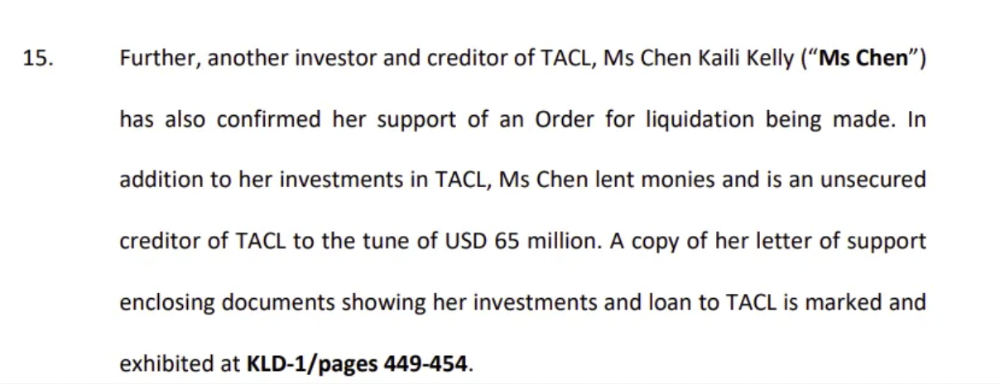
Su requesting for $5m + Chen Kaili Kelly asserting they loaned $65m unsecured to 3AC are identified as creditors.
Celsius:
This bankruptcy presentation shows the Celsius breakdown from March to July 14, 2022. From $22bn to $4bn, crypto assets plummeted from $14.6bn to $1.8bn (ouch). $16.5bn in user liabilities dropped to $4.72bn.
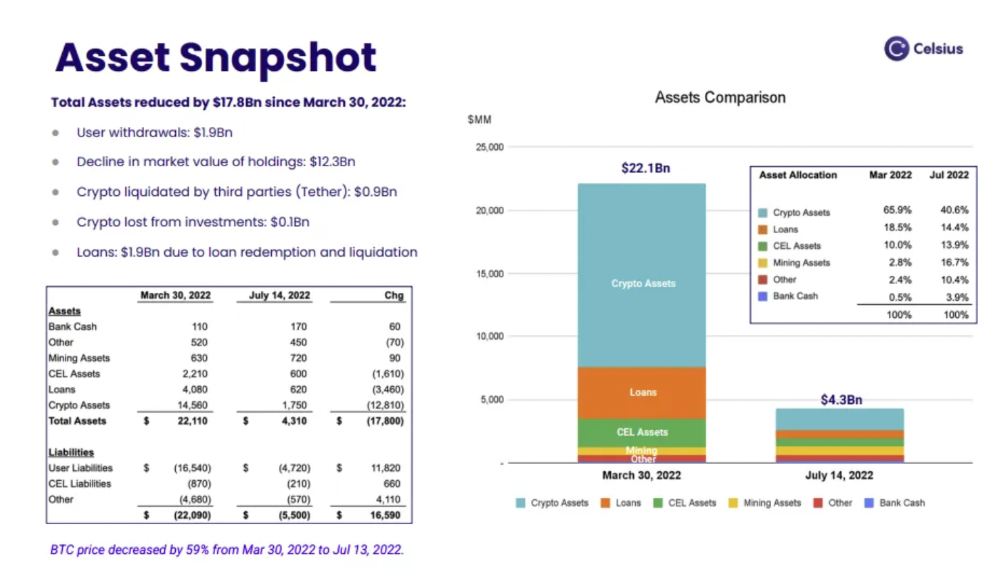
In my recent post, I examined if "forced selling" is over, with Celsius' crypto assets being a major overhang. In this presentation, it looks that Chapter 11 will provide clients the opportunity to accept cash at a discount or remain long crypto. Provided that a fresh source of money is unlikely to enter the Celsius situation, cash at a discount or crypto given to customers will likely remain a near-term market risk - cash at a discount will likely come from selling crypto assets, while customers who receive crypto could sell at any time. I'll share any Celsius updates I find.
Conclusion
Only Celsius and the Mt Gox BTC unlock remain as forced selling catalysts. While everything went through a "relief" pump, with ETH up 75% from the bottom and numerous alts multiples higher, there are still macro dangers to equities + risk assets. There's a lot of wealth waiting to be deployed in crypto ($153bn in stables), but fund managers are risk apprehensive (lower than 2008 levels).
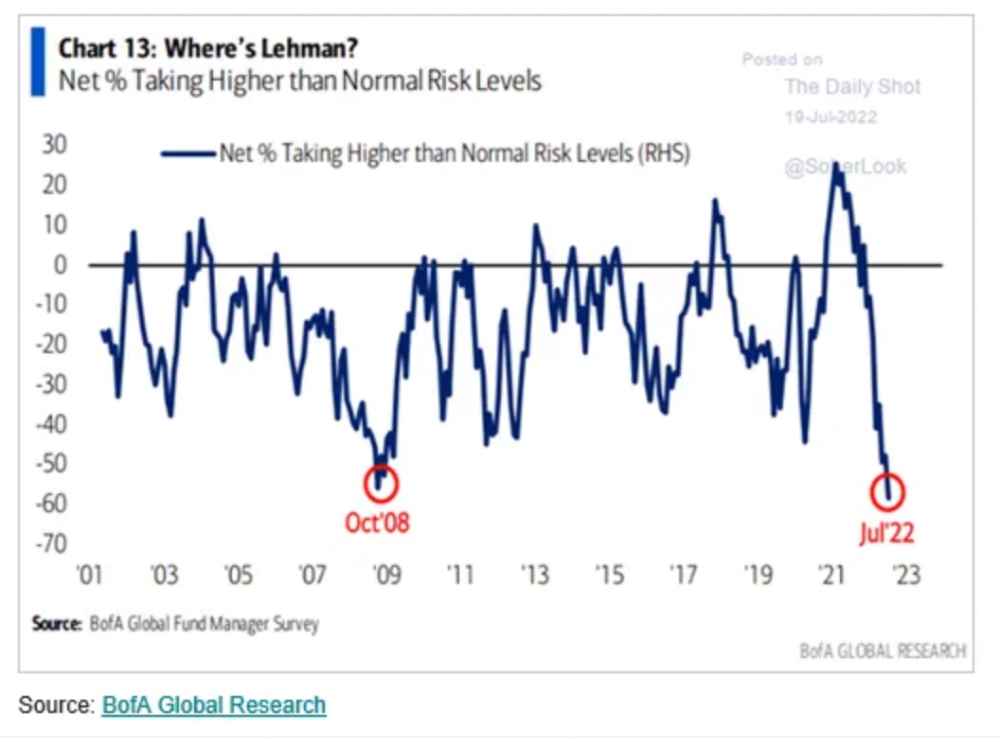
We're hopefully over crypto's "bottom," with peak anxiety and forced selling behind us, but we may chop around.
To see the full article, click here.

Alexandra Walker-Jones
3 years ago
These are the 15 foods you should eat daily and why.
Research on preventing disease, extending life, and caring for your body from the inside out

Grapefruit and pomegranates aren't on the list, so ignore that. Mostly, I enjoyed the visual, but those fruits are healthful, too.
15 (or 17 if you consider the photo) different foods a day sounds like a lot. If you're not used to it — it is.
These lists don't aim for perfection. Instead, use this article and the science below to eat more of these foods. If you can eat 5 foods one day and 5 the next, you're doing well. This list should be customized to your requirements and preferences.
“Every time you eat or drink, you are either feeding disease or fighting it” -Heather Morgan.
The 15 Foods That You Should Consume Daily and Why:
1. Dark/Red Berries
(blueberries, blackberries, acai, goji, cherries, strawberries, raspberries)
The 2010 Global Burden of Disease Study is the greatest definitive analysis of death and disease risk factors in history. They found the primary cause of both death, disability, and disease inside the United States was diet.
Not eating enough fruit, and specifically berries, was one of the best predictors of disease (1).
What's special about berries? It's their color! Berries have the most antioxidants of any fruit, second only to spices. The American Cancer Society found that those who ate the most berries were less likely to die of cardiovascular disease.
2. Beans
Soybeans, black beans, kidney beans, lentils, split peas, chickpeas.
Beans are one of the most important predictors of survival in older people, according to global research (2).
For every 20 grams (2 tablespoons) of beans consumed daily, the risk of death is reduced by 8%.
Soybeans and soy foods are high in phytoestrogen, which reduces breast and prostate cancer risks. Phytoestrogen blocks the receptors' access to true estrogen, mitigating the effects of weight gain, dairy (high in estrogen), and hormonal fluctuations (3).
3. Nuts
(almonds, walnuts, pecans, pistachios, Brazil nuts, cashews, hazelnuts, macadamia nuts)
Eating a handful of nuts every day reduces the risk of chronic diseases like heart disease and diabetes. Nuts also reduce oxidation, blood sugar, and LDL (bad) cholesterol, improving arterial function (4).
Despite their high-fat content, studies have linked daily nut consumption to a slimmer waistline and a lower risk of obesity (5).
4. Flaxseed
(milled flaxseed)
2013 research found that ground flaxseed had one of the strongest anti-hypertensive effects of any food. A few tablespoons (added to a smoothie or baked goods) lowered blood pressure and stroke risk 23 times more than daily aerobic exercise (6).
Flax shouldn't replace exercise, but its nutritional punch is worth adding to your diet.
5. Other seeds
(chia seeds, hemp seeds, pumpkin seeds, sesame seeds, fennel seeds)
Seeds are high in fiber and omega-3 fats and can be added to most dishes without being noticed.
When eaten with or after a meal, chia seeds moderate blood sugar and reduce inflammatory chemicals in the blood (7). Overall, a great daily addition.
6. Dates
Dates are one of the world's highest sugar foods, with 80% sugar by weight. Pure cake frosting is 60%, maple syrup is 66%, and cotton-candy jelly beans are 70%.
Despite their high sugar content, dates have a low glycemic index, meaning they don't affect blood sugar levels dramatically. They also improve triglyceride and antioxidant stress levels (8).
Dates are a great source of energy and contain high levels of dietary fiber and polyphenols, making 3-10 dates a great way to fight disease, support gut health with prebiotics, and satisfy a sweet tooth (9).
7. Cruciferous Veggies
(broccoli, Brussel sprouts, horseradish, kale, cauliflower, cabbage, boy choy, arugula, radishes, turnip greens)
Cruciferous vegetables contain an active ingredient that makes them disease-fighting powerhouses. Sulforaphane protects our brain, eyesight, against free radicals and environmental hazards, and treats and prevents cancer (10).
Unless you eat raw cruciferous vegetables daily, you won't get enough sulforaphane (and thus, its protective nutritional benefits). Cooking destroys the enzyme needed to create this super-compound.
If you chop broccoli, cauliflower, or turnip greens and let them sit for 45 minutes before cooking them, the enzyme will have had enough time to work its sulforaphane magic, allowing the vegetables to retain the same nutritional value as if eaten raw. Crazy, right? For more on this, see What Chopping Your Vegetables Has to Do with Fighting Cancer.
8. Whole grains
(barley, brown rice, quinoa, oats, millet, popcorn, whole-wheat pasta, wild rice)
Whole-grains are one of the healthiest ways to consume your daily carbs and help maintain healthy gut flora.
This happens when fibre is broken down in the colon and starts a chain reaction, releasing beneficial substances into the bloodstream and reducing the risk of Type 2 Diabetes and inflammation (11).
9. Spices
(turmeric, cumin, cinnamon, ginger, saffron, cloves, cardamom, chili powder, nutmeg, coriander)
7% of a person's cells will have DNA damage. This damage is caused by tiny breaks in our DNA caused by factors like free-radical exposure.
Free radicals cause mutations that damage lipids, proteins, and DNA, increasing the risk of disease and cancer. Free radicals are unavoidable because they result from cellular metabolism, but they can be avoided by consuming anti-oxidant and detoxifying foods.
Including spices and herbs like rosemary or ginger in our diet may cut DNA damage by 25%. Yes, this damage can be improved through diet. Turmeric worked better at a lower dose (just a pinch, daily). For maximum free-radical fighting (and anti-inflammatory) effectiveness, use 1.5 tablespoons of similar spices (12).
10. Leafy greens
(spinach, collard greens, lettuce, other salad greens, swiss chard)
Studies show that people who eat more leafy greens perform better on cognitive tests and slow brain aging by a year or two (13).
As we age, blood flow to the brain drops due to a decrease in nitric oxide, which prevents blood vessels from dilatation. Daily consumption of nitrate-rich vegetables like spinach and swiss chard may prevent dementia and Alzheimer's.
11. Fermented foods
(sauerkraut, tempeh, kombucha, plant-based kefir)
Miso, kimchi, and sauerkraut contain probiotics that support gut microbiome.
Probiotics balance the good and bad bacteria in our bodies and offer other benefits. Fermenting fruits and vegetables increases their antioxidant and vitamin content, preventing disease in multiple ways (14).
12. Sea vegetables
(seaweed, nori, dulse flakes)
A population study found that eating one sheet of nori seaweed per day may cut breast cancer risk by more than half (15).
Seaweed and sea vegetables may help moderate estrogen levels in the metabolism, reducing cancer and disease risk.
Sea vegetables make up 30% of the world's edible plants and contain unique phytonutrients. A teaspoon of these super sea-foods on your dinner will help fight disease from the inside out.
13. Water
I'm less concerned about whether you consider water food than whether you drink enough. If this list were ranked by what single item led to the best health outcomes, water would be first.
Research shows that people who drink 5 or more glasses of water per day have a 50% lower risk of dying from heart disease than those who drink 2 or less (16).
Drinking enough water boosts energy, improves skin, mental health, and digestion, and reduces the risk of various health issues, including obesity.
14. Tea
All tea consumption is linked to a lower risk of stroke, heart disease, and early death, with green tea leading for antioxidant content and immediate health benefits.
Green tea leaves may also be able to interfere with each stage of cancer formation, from the growth of the first mutated cell to the spread and progression of cancer in the body. Green tea is a quick and easy way to support your long-term and short-term health (17).
15. Supplemental B12 vitamin
B12, or cobalamin, is a vitamin responsible for cell metabolism. Not getting enough B12 can have serious consequences.
Historically, eating vegetables from untreated soil helped humans maintain their vitamin B12 levels. Due to modern sanitization, our farming soil lacks B12.
B12 is often cited as a problem only for vegetarians and vegans (as animals we eat are given B12 supplements before slaughter), but recent studies have found that plant-based eaters have lower B12 deficiency rates than any other diet (18).
Article Sources:

Ben "The Hosk" Hosking
3 years ago
The Yellow Cat Test Is Typically Failed by Software Developers.
Believe what you see, what people say

It’s sad that we never get trained to leave assumptions behind. - Sebastian Thrun
Many problems in software development are not because of code but because developers create the wrong software. This isn't rare because software is emergent and most individuals only realize what they want after it's built.
Inquisitive developers who pass the yellow cat test can improve the process.
Carpenters measure twice and cut the wood once. Developers are rarely so careful.
The Yellow Cat Test
Game of Thrones made dragons cool again, so I am reading The Game of Thrones book.
The yellow cat exam is from Syrio Forel, Arya Stark's fencing instructor.
Syrio tells Arya he'll strike left when fencing. He hits her after she dodges left. Arya says “you lied”. Syrio says his words lied, but his eyes and arm told the truth.
Arya learns how Syrio became Bravos' first sword.
“On the day I am speaking of, the first sword was newly dead, and the Sealord sent for me. Many bravos had come to him, and as many had been sent away, none could say why. When I came into his presence, he was seated, and in his lap was a fat yellow cat. He told me that one of his captains had brought the beast to him, from an island beyond the sunrise. ‘Have you ever seen her like?’ he asked of me.
“And to him I said, ‘Each night in the alleys of Braavos I see a thousand like him,’ and the Sealord laughed, and that day I was named the first sword.”
Arya screwed up her face. “I don’t understand.”
Syrio clicked his teeth together. “The cat was an ordinary cat, no more. The others expected a fabulous beast, so that is what they saw. How large it was, they said. It was no larger than any other cat, only fat from indolence, for the Sealord fed it from his own table. What curious small ears, they said. Its ears had been chewed away in kitten fights. And it was plainly a tomcat, yet the Sealord said ‘her,’ and that is what the others saw. Are you hearing?” Reddit discussion.
Development teams should not believe what they are told.
We created an appointment booking system. We thought it was an appointment-booking system. Later, we realized the software's purpose was to book the right people for appointments and discourage the unneeded ones.
The first 3 months of the project had half-correct requirements and software understanding.
Open your eyes
“Open your eyes is all that is needed. The heart lies and the head plays tricks with us, but the eyes see true. Look with your eyes, hear with your ears. Taste with your mouth. Smell with your nose. Feel with your skin. Then comes the thinking afterwards, and in that way, knowing the truth” Syrio Ferel
We must see what exists, not what individuals tell the development team or how developers think the software should work. Initial criteria cover 50/70% and change.
Developers build assumptions problems by assuming how software should work. Developers must quickly explain assumptions.
When a development team's assumptions are inaccurate, they must alter the code, DevOps, documentation, and tests.
It’s always faster and easier to fix requirements before code is written.
First-draft requirements can be based on old software. Development teams must grasp corporate goals and consider needs from many angles.
Testers help rethink requirements. They look at how software requirements shouldn't operate.
Technical features and benefits might misdirect software projects.
The initiatives that focused on technological possibilities developed hard-to-use software that needed extensive rewriting following user testing.
Software development
High-level criteria are different from detailed ones.
The interpretation of words determines their meaning.
Presentations are lofty, upbeat, and prejudiced.
People's perceptions may be unclear, incorrect, or just based on one perspective (half the story)
Developers can be misled by requirements, circumstances, people, plans, diagrams, designs, documentation, and many other things.
Developers receive misinformation, misunderstandings, and wrong assumptions. The development team must avoid building software with erroneous specifications.
Once code and software are written, the development team changes and fixes them.
Developers create software with incomplete information, they need to fill in the blanks to create the complete picture.
Conclusion
Yellow cats are often inaccurate when communicating requirements.
Before writing code, clarify requirements, assumptions, etc.
Everyone will pressure the development team to generate code rapidly, but this will slow down development.
Code changes are harder than requirements.