


StableGains lost $42M in Anchor Protocol.
StableGains lost millions of dollars in customer funds in Anchor Protocol without telling its users. The Anchor Protocol offered depositors 19-20% APY before its parent ecosystem, Terra LUNA, lost tens of billions of dollars in market capitalization as LUNA fell below $0.01 and its stablecoin (UST) collapsed.
A Terra Research Forum member raised the alarm. StableGains changed its homepage and Terms and Conditions to reflect how it mitigates risk, a tacit admission that it should have done so from the start.
StableGains raised $600,000 in YCombinator's W22 batch. Moonfire, Broom Ventures, and Goodwater Capital invested $3 million more.
StableGains' 15% yield product attracted $42 million in deposits. StableGains kept most of its deposits in Anchor's UST pool earning 19-20% APY, kept one-quarter of the interest as a management fee, and then gave customers their promised 15% APY. It lost almost all customer funds when UST melted down. It changed withdrawal times, hurting customers.
- StableGains said de-pegging was unlikely. According to its website, 1 UST can be bought and sold for $1 of LUNA. LUNA became worthless, and Terra shut down its blockchain.
- It promised to diversify assets across several stablecoins to reduce the risk of one losing its $1 peg, but instead kept almost all of them in one basket.
- StableGains promised withdrawals in three business days, even if a stablecoin needed time to regain its peg. StableGains uses Coinbase for deposits and withdrawals, and customers receive the exact amount of USDC requested.
StableGains scrubs its website squeaky clean
StableGains later edited its website to say it only uses the "most trusted and tested stablecoins" and extended withdrawal times from three days to indefinite time "in extreme cases."
Previously, USDC, TerraUST (UST), and Dai were used (DAI). StableGains changed UST-related website content after the meltdown. It also removed most references to DAI.
Customers noticed a new clause in the Terms and Conditions denying StableGains liability for withdrawal losses. This new clause would have required customers to agree not to sue before withdrawing funds, avoiding a class-action lawsuit.
Customers must sign a waiver to receive a refund.
Erickson Kramer & Osborne law firm has asked StableGains to preserve all internal documents on customer accounts, marketing, and TerraUSD communications. The firm has not yet filed a lawsuit.
Thousands of StableGains customers lost an estimated $42 million.
Celsius Network customers also affected
CEL used Terra LUNA's Anchor Protocol. Celsius users lost money in the crypto market crash and UST meltdown. Many held CEL and LUNA as yielding deposits.
CEO Alex Mashinsky accused "unknown malefactors" of targeting Celsius Network without evidence. Celsius has not publicly investigated this claim as of this article's publication.
CEL fell before UST de-pegged. On June 2, 2021, it reached $8.01. May 19's close: $0.82.
When some Celsius Network users threatened to leave over token losses, Mashinsky replied, "Leave if you don't think I'm sincere and working harder than you, seven days a week."
Celsius Network withdrew $500 million from Anchor Protocol, but smaller holders had trouble.
Read original article here
More on Web3 & Crypto

Jonathan Vanian
4 years ago
What is Terra? Your guide to the hot cryptocurrency
With cryptocurrencies like Bitcoin, Ether, and Dogecoin gyrating in value over the past few months, many people are looking at so-called stablecoins like Terra to invest in because of their more predictable prices.
Terraform Labs, which oversees the Terra cryptocurrency project, has benefited from its rising popularity. The company said recently that investors like Arrington Capital, Lightspeed Venture Partners, and Pantera Capital have pledged $150 million to help it incubate various crypto projects that are connected to Terra.
Terraform Labs and its partners have built apps that operate on the company’s blockchain technology that helps keep a permanent and shared record of the firm’s crypto-related financial transactions.
Here’s what you need to know about Terra and the company behind it.
What is Terra?
Terra is a blockchain project developed by Terraform Labs that powers the startup’s cryptocurrencies and financial apps. These cryptocurrencies include the Terra U.S. Dollar, or UST, that is pegged to the U.S. dollar through an algorithm.
Terra is a stablecoin that is intended to reduce the volatility endemic to cryptocurrencies like Bitcoin. Some stablecoins, like Tether, are pegged to more conventional currencies, like the U.S. dollar, through cash and cash equivalents as opposed to an algorithm and associated reserve token.
To mint new UST tokens, a percentage of another digital token and reserve asset, Luna, is “burned.” If the demand for UST rises with more people using the currency, more Luna will be automatically burned and diverted to a community pool. That balancing act is supposed to help stabilize the price, to a degree.
“Luna directly benefits from the economic growth of the Terra economy, and it suffers from contractions of the Terra coin,” Terraform Labs CEO Do Kwon said.
Each time someone buys something—like an ice cream—using UST, that transaction generates a fee, similar to a credit card transaction. That fee is then distributed to people who own Luna tokens, similar to a stock dividend.
Who leads Terra?
The South Korean firm Terraform Labs was founded in 2018 by Daniel Shin and Kwon, who is now the company’s CEO. Kwon is a 29-year-old former Microsoft employee; Shin now heads the Chai online payment service, a Terra partner. Kwon said many Koreans have used the Chai service to buy goods like movie tickets using Terra cryptocurrency.
Terraform Labs does not make money from transactions using its crypto and instead relies on outside funding to operate, Kwon said. It has raised $57 million in funding from investors like HashKey Digital Asset Group, Divergence Digital Currency Fund, and Huobi Capital, according to deal-tracking service PitchBook. The amount raised is in addition to the latest $150 million funding commitment announced on July 16.
What are Terra’s plans?
Terraform Labs plans to use Terra’s blockchain and its associated cryptocurrencies—including one pegged to the Korean won—to create a digital financial system independent of major banks and fintech-app makers. So far, its main source of growth has been in Korea, where people have bought goods at stores, like coffee, using the Chai payment app that’s built on Terra’s blockchain. Kwon said the company’s associated Mirror trading app is experiencing growth in China and Thailand.
Meanwhile, Kwon said Terraform Labs would use its latest $150 million in funding to invest in groups that build financial apps on Terra’s blockchain. He likened the scouting and investing in other groups as akin to a “Y Combinator demo day type of situation,” a reference to the popular startup pitch event organized by early-stage investor Y Combinator.
The combination of all these Terra-specific financial apps shows that Terraform Labs is “almost creating a kind of bank,” said Ryan Watkins, a senior research analyst at cryptocurrency consultancy Messari.
In addition to cryptocurrencies, Terraform Labs has a number of other projects including the Anchor app, a high-yield savings account for holders of the group’s digital coins. Meanwhile, people can use the firm’s associated Mirror app to create synthetic financial assets that mimic more conventional ones, like “tokenized” representations of corporate stocks. These synthetic assets are supposed to be helpful to people like “a small retail trader in Thailand” who can more easily buy shares and “get some exposure to the upside” of stocks that they otherwise wouldn’t have been able to obtain, Kwon said. But some critics have said the U.S. Securities and Exchange Commission may eventually crack down on synthetic stocks, which are currently unregulated.
What do critics say?
Terra still has a long way to go to catch up to bigger cryptocurrency projects like Ethereum.
Most financial transactions involving Terra-related cryptocurrencies have originated in Korea, where its founders are based. Although Terra is becoming more popular in Korea thanks to rising interest in its partner Chai, it’s too early to say whether Terra-related currencies will gain traction in other countries.
Terra’s blockchain runs on a “limited number of nodes,” said Messari’s Watkins, referring to the computers that help keep the system running. That helps reduce latency that may otherwise slow processing of financial transactions, he said.
But the tradeoff is that Terra is less “decentralized” than other blockchain platforms like Ethereum, which is powered by thousands of interconnected computing nodes worldwide. That could make Terra less appealing to some blockchain purists.

Vivek Singh
4 years ago
A Warm Welcome to Web3 and the Future of the Internet
Let's take a look back at the internet's history and see where we're going — and why.
Tim Berners Lee had a problem. He was at CERN, the world's largest particle physics factory, at the time. The institute's stated goal was to study the simplest particles with the most sophisticated scientific instruments. The institute completed the LEP Tunnel in 1988, a 27 kilometer ring. This was Europe's largest civil engineering project (to study smaller particles — electrons).
The problem Tim Berners Lee found was information loss, not particle physics. CERN employed a thousand people in 1989. Due to team size and complexity, people often struggled to recall past project information. While these obstacles could be overcome, high turnover was nearly impossible. Berners Lee addressed the issue in a proposal titled ‘Information Management'.
When a typical stay is two years, data is constantly lost. The introduction of new people takes a lot of time from them and others before they understand what is going on. An emergency situation may require a detective investigation to recover technical details of past projects. Often, the data is recorded but cannot be found. — Information Management: A Proposal
He had an idea. Create an information management system that allowed users to access data in a decentralized manner using a new technology called ‘hypertext'.
To quote Berners Lee, his proposal was “vague but exciting...”. The paper eventually evolved into the internet we know today. Here are three popular W3C standards used by billions of people today:
(credit: CERN)
HTML (Hypertext Markup)
A web formatting language.
URI (Unique Resource Identifier)
Each web resource has its own “address”. Known as ‘a URL'.
HTTP (Hypertext Transfer Protocol)
Retrieves linked resources from across the web.
These technologies underpin all computer work. They were the seeds of our quest to reorganize information, a task as fruitful as particle physics.
Tim Berners-Lee would probably think the three decades from 1989 to 2018 were eventful. He'd be amazed by the billions, the inspiring, the novel. Unlocking innovation at CERN through ‘Information Management'.
The fictional character would probably need a drink, walk, and a few deep breaths to fully grasp the internet's impact. He'd be surprised to see a few big names in the mix.
Then he'd say, "Something's wrong here."
We should review the web's history before going there. Was it a success after Berners Lee made it public? Web1 and Web2: What is it about what we are doing now that so many believe we need a new one, web3?
Per Outlier Ventures' Jamie Burke:
Web 1.0 was read-only.
Web 2.0 was the writable
Web 3.0 is a direct-write web.
Let's explore.
Web1: The Read-Only Web
Web1 was the digital age. We put our books, research, and lives ‘online'. The web made information retrieval easier than any filing cabinet ever. Massive amounts of data were stored online. Encyclopedias, medical records, and entire libraries were put away into floppy disks and hard drives.
In 2015, the web had around 305,500,000,000 pages of content (280 million copies of Atlas Shrugged).
Initially, one didn't expect to contribute much to this database. Web1 was an online version of the real world, but not yet a new way of using the invention.
One gets the impression that the web has been underutilized by historians if all we can say about it is that it has become a giant global fax machine. — Daniel Cohen, The Web's Second Decade (2004)
That doesn't mean developers weren't building. The web was being advanced by great minds. Web2 was born as technology advanced.
Web2: Read-Write Web
Remember when you clicked something on a website and the whole page refreshed? Is it too early to call the mid-2000s ‘the good old days'?
Browsers improved gradually, then suddenly. AJAX calls augmented CGI scripts, and applications began sending data back and forth without disrupting the entire web page. One button to ‘digg' a post (see below). Web experiences blossomed.
In 2006, Digg was the most active ‘Web 2.0' site. (Photo: Ethereum Foundation Taylor Gerring)
Interaction was the focus of new applications. Posting, upvoting, hearting, pinning, tweeting, liking, commenting, and clapping became a lexicon of their own. It exploded in 2004. Easy ways to ‘write' on the internet grew, and continue to grow.
Facebook became a Web2 icon, where users created trillions of rows of data. Google and Amazon moved from Web1 to Web2 by better understanding users and building products and services that met their needs.
Business models based on Software-as-a-Service and then managing consumer data within them for a fee have exploded.
Web2 Emerging Issues
Unbelievably, an intriguing dilemma arose. When creating this read-write web, a non-trivial question skirted underneath the covers. Who owns it all?
You have no control over [Web 2] online SaaS. People didn't realize this because SaaS was so new. People have realized this is the real issue in recent years.
Even if these organizations have good intentions, their incentive is not on the users' side.
“You are not their customer, therefore you are their product,” they say. With Laura Shin, Vitalik Buterin, Unchained
A good plot line emerges. Many amazing, world-changing software products quietly lost users' data control.
For example: Facebook owns much of your social graph data. Even if you hate Facebook, you can't leave without giving up that data. There is no ‘export' or ‘exit'. The platform owns ownership.
While many companies can pull data on you, you cannot do so.
On the surface, this isn't an issue. These companies use my data better than I do! A complex group of stakeholders, each with their own goals. One is maximizing shareholder value for public companies. Tim Berners-Lee (and others) dislike the incentives created.
“Show me the incentive and I will show you the outcome.” — Berkshire Hathaway's CEO
It's easy to see what the read-write web has allowed in retrospect. We've been given the keys to create content instead of just consume it. On Facebook and Twitter, anyone with a laptop and internet can participate. But the engagement isn't ours. Platforms own themselves.
Web3: The ‘Unmediated’ Read-Write Web
Tim Berners Lee proposed a decade ago that ‘linked data' could solve the internet's data problem.
However, until recently, the same principles that allowed the Web of documents to thrive were not applied to data...
The Web of Data also allows for new domain-specific applications. Unlike Web 2.0 mashups, Linked Data applications work with an unbound global data space. As new data sources appear on the Web, they can provide more complete answers.
At around the same time as linked data research began, Satoshi Nakamoto created Bitcoin. After ten years, it appears that Berners Lee's ideas ‘link' spiritually with cryptocurrencies.
What should Web 3 do?
Here are some quick predictions for the web's future.
Users' data:
Users own information and provide it to corporations, businesses, or services that will benefit them.
Defying censorship:
No government, company, or institution should control your access to information (1, 2, 3)
Connect users and platforms:
Create symbiotic rather than competitive relationships between users and platform creators.
Open networks:
“First, the cryptonetwork-participant contract is enforced in open source code. Their voices and exits are used to keep them in check.” Dixon, Chris (4)
Global interactivity:
Transacting value, information, or assets with anyone with internet access, anywhere, at low cost
Self-determination:
Giving you the ability to own, see, and understand your entire digital identity.
Not pull, push:
‘Push' your data to trusted sources instead of ‘pulling' it from others.
Where Does This Leave Us?
Change incentives, change the world. Nick Babalola
People believe web3 can help build a better, fairer system. This is not the same as equal pay or outcomes, but more equal opportunity.
It should be noted that some of these advantages have been discussed previously. Will the changes work? Will they make a difference? These unanswered questions are technical, economic, political, and philosophical. Unintended consequences are likely.
We hope Web3 is a more democratic web. And we think incentives help the user. If there’s one thing that’s on our side, it’s that open has always beaten closed, given a long enough timescale.
We are at the start.

Koji Mochizuki
4 years ago
How to Launch an NFT Project by Yourself
Creating 10,000 auto-generated artworks, deploying a smart contract to the Ethereum / Polygon blockchain, setting up some tools, etc.
There is so much to do from launching to running an NFT project. Creating parts for artworks, generating 10,000 unique artworks and metadata, creating a smart contract and deploying it to a blockchain network, creating a website, creating a Twitter account, setting up a Discord server, setting up an OpenSea collection. In addition, you need to have MetaMask installed in your browser and have some ETH / MATIC. Did you get tired of doing all this? Don’t worry, once you know what you need to do, all you have to do is do it one by one.
To be honest, it’s best to run an NFT project in a team of three or more, including artists, developers, and marketers. However, depending on your motivation, you can do it by yourself. Some people might come later to offer help with your project. The most important thing is to take a step as soon as possible.
Creating Parts for Artworks
There are lots of free/paid software for drawing, but after all, I think Adobe Illustrator or Photoshop is the best. The images of Skulls In Love are a composite of 48x48 pixel parts created using Photoshop.
The most important thing in creating parts for generative art is to repeatedly test what your artworks will look like after each layer has been combined. The generated artworks should not be too unnatural.
How Many Parts Should You Create?
Are you wondering how many parts you should create to avoid duplication as much as possible when generating your artworks? My friend Stephane, a developer, has created a great tool to help with that.
Generating 10,000 Unique Artworks and Metadata
I highly recommend using the HashLips Art Engine to generate your artworks and metadata. Perhaps there is no better artworks generation tool at the moment.
GitHub: https://github.com/HashLips/hashlips_art_engine
YouTube:
Storing Artworks and Metadata
Ideally, the generated artworks and metadata should be stored on-chain, but if you want to store them off-chain, you should use IPFS. Do not store in centralized storage. This is because data will be lost if the server goes down or if the company goes down. On the other hand, IPFS is a more secure way to find data because it utilizes a distributed, decentralized system.
Storing to IPFS is easy with Pinata, NFT.Storage, and so on. The Skulls In Love uses Pinata. It’s very easy to use, just upload the folder containing your artworks.
Creating and Deploying a Smart Contract
You don’t have to create a smart contract from scratch. There are many great NFT projects, many of which publish their contract source code on Etherscan / PolygonScan. You can choose the contract you like and reuse it. Of course, that requires some knowledge of Solidity, but it depends on your efforts. If you don’t know which contract to choose, use the HashLips smart contract. It’s very simple, but it has almost all the functions you need.
GitHub: https://github.com/HashLips/hashlips_nft_contract
Note: Later on, you may want to change the cost value. You can change it on Remix or Etherscan / PolygonScan. But in this case, enter the Wei value instead of the Ether value. For example, if you want to sell for 1 MATIC, you have to enter “1000000000000000000”. If you set this value to “1”, you will have a nightmare. I recommend using Simple Unit Converter as a tool to calculate the Wei value.
Creating a Website
The website here is not just a static site to showcase your project, it’s a so-called dApp that allows you to access your smart contract and mint NFTs. In fact, this level of dApp is not too difficult for anyone who has ever created a website. Because the ethers.js / web3.js libraries make it easy to interact with your smart contract. There’s also no problem connecting wallets, as MetaMask has great documentation.
The Skulls In Love uses a simple, fast, and modern dApp that I built from scratch using Next.js. It is published on GitHub, so feel free to use it.
Why do people mint NFTs on a website?
Ethereum’s gas fees are high, so if you mint all your NFTs, there will be a huge initial cost. So it makes sense to get the buyers to help with the gas fees for minting.
What about Polygon? Polygon’s gas fees are super cheap, so even if you mint 10,000 NFTs, it’s not a big deal. But we don’t do that. Since NFT projects are a kind of game, it involves the fun of not knowing what will come out after minting.
Creating a Twitter Account
I highly recommend creating a Twitter account. Twitter is an indispensable tool for announcing giveaways and reaching more people. It’s better to announce your project and your artworks little by little, 1–2 weeks before launching your project.
Creating and Setting Up a Discord Server
I highly recommend creating a Discord server as well as a Twitter account. The Discord server is a community and its home. Fans of your NFT project will want to join your community and interact with many other members. So, carefully create each channel on your Discord server to make it a cozy place for your community members.
If you are unfamiliar with Discord, you may be particularly confused by the following:
What bots should I use?
How should I set roles and permissions?
But don’t worry. There are lots of great YouTube videos and blog posts about these.
It’s also a good idea to join the Discord servers of some NFT projects and see how they’re made. Our Discord server is so simple that even beginners will find it easy to understand. Please join us and see it!
Note: First, create a test account and a test server to make sure your bots and permissions work properly. It is better to verify the behavior on the test server before setting up your production server.
UPDATED: As your Discord server grows, you cannot manage it on your own. In this case, you will be hiring several moderators, but choose carefully before hiring. And don’t give them important role permissions right after hiring. Initially, the same permissions as other members are sufficient. After a while, you can add permissions as needed, such as kicking/banning, using the “@every” tag, and adding roles. Again, don’t immediately give significant permissions to your Mod role. Your server can be messed up by fake moderators.
Setting Up Your OpenSea Collection
Before you start selling your NFTs, you need to reserve some for airdrops, giveaways, staff, and more. It’s up to you whether it’s 100, 500, or how many.
After minting some of your NFTs, your account and collection should have been created in OpenSea. Go to OpenSea, connect to your wallet, and set up your collection. Just set your logo, banner image, description, links, royalties, and more. It’s not that difficult.
Promoting Your Project
After all, promotion is the most important thing. In fact, almost every successful NFT project spends a lot of time and effort on it.
In addition to Twitter and Discord, it’s even better to use Instagram, Reddit, and Medium. Also, register your project in NFTCalendar and DISBOARD
DISBOARD is the public Discord server listing community.
About Promoters
You’ll probably get lots of contacts from promoters on your Discord, Twitter, Instagram, and more. But most of them are scams, so don’t pay right away. If you have a promoter that looks attractive to you, be sure to check the promoter’s social media accounts or website to see who he/she is. They basically charge in dollars. The amount they charge isn’t cheap, but promoters with lots of followers may have some temporary effect on your project. Some promoters accept 50% prepaid and 50% postpaid. If you can afford it, it might be worth a try. I never ask them, though.
When Should the Promotion Activities Start?
You may be worried that if you promote your project before it starts, someone will copy your project (artworks). It is true that some projects have actually suffered such damage. I don’t have a clear answer to this question right now, but:
- Do not publish all the information about your project too early
- The information should be released little by little
- Creating artworks that no one can easily copy
I think these are important.
If anyone has a good idea, please share it!
About Giveaways
When hosting giveaways, you’ll probably use multiple social media platforms. You may want to grow your Discord server faster. But if joining the Discord server is included in the giveaway requirements, some people hate it. I recommend holding giveaways for each platform. On Twitter and Reddit, you should just add the words “Discord members-only giveaway is being held now! Please join us if you like!”.
If you want to easily pick a giveaway winner in your browser, I recommend Twitter Picker.
Precautions for Distributing Free NFTs
If you want to increase your Twitter followers and Discord members, you can actually get a lot of people by holding events such as giveaways and invite contests. However, distributing many free NFTs at once can be dangerous. Some people who want free NFTs, as soon as they get a free one, sell it at a very low price on marketplaces such as OpenSea. They don’t care about your project and are only thinking about replacing their own “free” NFTs with Ethereum. The lower the floor price of your NFTs, the lower the value of your NFTs (project). Try to think of ways to get people to “buy” your NFTs as much as possible.
Ethereum vs. Polygon
Even though Ethereum has high gas fees, NFT projects on the Ethereum network are still mainstream and popular. On the other hand, Polygon has very low gas fees and fast transaction processing, but NFT projects on the Polygon network are not very popular.
Why? There are several reasons, but the biggest one is that it’s a lot of work to get MATIC (on Polygon blockchain, use MATIC instead of ETH) ready to use. Simply put, you need to bridge your tokens to the Polygon chain. So people need to do this first before minting your NFTs on your website. It may not be a big deal for those who are familiar with crypto and blockchain, but it may be complicated for those who are not. I hope that the tedious work will be simplified in the near future.
If you are confident that your NFTs will be purchased even if they are expensive, or if the total supply of your NFTs is low, you may choose Ethereum. If you just want to save money, you should choose Polygon. Keep in mind that gas fees are incurred not only when minting, but also when performing some of your smart contract functions and when transferring your NFTs.
If I were to launch a new NFT project, I would probably choose Ethereum or Solana.
Conclusion
Some people may want to start an NFT project to make money, but don’t forget to enjoy your own project. Several months ago, I was playing with creating generative art by imitating the CryptoPunks. I found out that auto-generated artworks would be more interesting than I had imagined, and since then I’ve been completely absorbed in generative art.
This is one of the Skulls In Love artworks:
This character wears a cowboy hat, black slim sunglasses, and a kimono. If anyone looks like this, I can’t help laughing!
The Skulls In Love NFTs can be minted for a small amount of MATIC on the official website. Please give it a try to see what kind of unique characters will appear 💀💖
Thank you for reading to the end. I hope this article will be helpful to those who want to launch an NFT project in the future ✨
You might also like

INTΞGRITY team
3 years ago
Terms of Service
Effective: August 31, 2022
These Terms of Service ("Terms") govern your access to and use of INTΞGRITY’s (or "we") websites, mobile applications, and other online products and services (collectively, the "Services"). By clicking your assent (e.g. "Continue," "Sign-in," or "Sign-up") or by utilizing our Services, you consent to these Terms, including the mandatory arbitration provision and class action waiver in the Resolving Disputes; Binding Arbitration Section.
Our Privacy Policy describes how we gather and utilize your information, while our Rules detail your duties when utilizing our Services. You agree to be bound by these Terms and our Rules by utilizing our Services. Please refer to our Privacy Statement for details on how we collect, utilize, disclose, and otherwise manage your information.
Please contact us at hello@int3grity.com if you have any queries regarding these Terms or our Services.
Account Details and Responsibilities
You are responsible for your use of the Services and any content you contribute, including compliance with all relevant laws. The Services may host content that is protected by the intellectual property rights of third parties. Please do not copy, post, download, or distribute content without permission.
You must adhere to our Rules when using the Services.
To use any or all of our services, you may need to register for an account. Contribute to the protection of your account. Protect your account's password, and maintain accurate account details. We advise you not to share your password with anyone else.
If you are accepting these Terms and using the Services on behalf of someone else (such as another person or entity), you confirm that you are allowed to do so, and the words "you" or "your" in these Terms refer to that other person or entity.
You must be at least 13 years old to access our services.
If you use the Services to access, collect, or otherwise utilize the personal information of other INTΞGRITY users ("Personal Information"), you agree to comply with all applicable laws. You also undertake not to sell any Personal Information, where "sell" has the meaning ascribed to it by relevant legislation.
For Personal Information you provide to us (as a Newsletter Editor, for example), you represent and warrant that you have lawfully collected the Personal Information and that you or a third party have provided all required notices and obtained all required consents prior to collecting the Personal Information. You further represent and warrant that INTΞGRITY’s use of such Personal Information in accordance with the purposes for which you provided the Personal Information will not violate, misappropriate, or infringe any rights of a third party (including intellectual property rights or privacy rights) or cause us to violate any applicable laws.
The Services' User Content
INTΞGRITY may monitor your conduct and material for compliance with these Terms and our Rules, and reserves the right to remove any content that violates these guidelines.
INTΞGRITY maintains the right to remove or disable content that is accused to violate the intellectual property rights of others, as well as to cancel the accounts of repeat infringers. We respond to notifications of alleged copyright violations if they comply with the law; please report such notices using our Copyright Policy.
Ownership and Rights
You maintain ownership of all content that you submit, upload, or display on or through the Services.
By submitting, posting, or displaying content on or through the Services, unless otherwise agreed in writing, you grant INTΞGRITY a nonexclusive, royalty-free, worldwide, fully paid, and sublicensable license to use, reproduce, modify, adapt, publish, translate, create derivative works from, distribute, publicly perform and display your content and any name, username or likeness provided in connection with your content in all media formats and distribution methods now known or later developed.
INTΞGRITY requires this license because you are the owner of your material, and INTΞGRITY cannot show it across its multiple platforms (mobile, online) without your consent.
This type of license is also required for content distribution throughout our Services. For example, you may publish a piece on INTΞGRITY. It is duplicated as versions on both our website and app, and distributed to many locations on INTΞGRITY, including the homepage and reading lists. A tweak could be that we display a fragment of your work as a preview (rather than the entire post), with attribution. An example of a derivative work might be a list of top authors or quotations on INTΞGRITY that includes chunks of your article, again with full attribution. This license solely applies to our Services and does not grant us permissions outside of our Services.
So long as you comply with these Terms, INTΞGRITY grants you a limited, non-exclusive, personal, and non-transferable license to access and utilize our Services.
Copyright, trademark, and other United States and international laws protect the Services. These Terms do not grant you any right, title, or interest in the Services, the material posted by other users on the Services, or INTΞGRITY’s trademarks, logos, or other brand characteristics.
In addition to the content you submit, post, or display on our Services, we appreciate your feedback, which may include your thoughts, ideas, and suggestions regarding our Services. This input may be used for any reason at our sole discretion and without obligation to you. We may treat your comments as non-confidential.
We reserve the right, at our sole discretion, to discontinue the Services or any of its features. In addition, we reserve the right to impose limits on use and storage, and to remove or restrict the distribution of content on the Services.
Termination
You are allowed to terminate your use of our services at any time. We have the right to stop or cancel your use of the Services with or without notice.
Moving and Processing Information
To enable us to deliver our Services, you accept that we may handle, transfer, and retain information about you in the United States and other countries, where you may not enjoy the same rights and protections as you do under local law.
Indemnification
To the maximum extent permitted by applicable law, you will indemnify, defend, and hold harmless INTΞGRITY, and our officers, directors, agents, partners, and employees (collectively, the "INTΞGRITY Parties"), from and against any losses, liabilities, claims, demands, damages, expenses or costs ("Claims") arising out of or relating to your violation, misappropriation, or infringement of any rights of another (including intellectual property rights or privacy rights). You undertake to promptly notify INTΞGRITY Parties of any third-party Claims, to assist INTΞGRITY Parties in fighting such Claims, and to pay any fees, charges, and expenses connected with defending such Claims (including attorneys' fees). You further agree that, at INTΞGRITY’s sole discretion, the INTΞGRITY Parties will govern the defense or settlement of any third-party Claims.
Disclaimers — Services Provided "As Is"
INTΞGRITY strives to provide you with excellent Services, but there are certain things we cannot guarantee. Utilization of our services is at your own risk. You acknowledge that our Services and any content uploaded or shared by users on the Services are given "as is" and "as available" without explicit or implied warranties of any kind, including warranties of merchantability, fitness for a particular purpose, title, and non-infringement. In addition, INTΞGRITY does not represent or promise that our Services are accurate, comprehensive, dependable, up-to-date, or error-free. No advice or information gained from INTΞGRITY or via the Services shall create any warranty or representation unless expressly set forth in this section. INTΞGRITY may provide information on third-party products, services, activities, or events, or we may permit third parties to make their material and information accessible via our Services (collectively, "Third-Party Content"). We neither control nor endorse any Third-Party Content, nor do we make any claims or warranties about it. Accessing and utilizing Third-Party Content is at your own risk. The disclaimers in this section may not apply to you if they are prohibited in your location.
Limitation of Liability
We do not exclude or limit our obligation to you where it would be unlawful to do so; this includes any liability for the gross negligence, fraud, or willful misconduct of INTΞGRITY or the other INTΞGRITY Parties in providing the Services. In jurisdictions where the foregoing exclusions are not permitted, our liability to you is limited to losses and damages that are reasonably foreseeable as a result of our failure to exercise reasonable care and skill or breach of contract with you. This paragraph does not impact consumer rights that cannot be waived or limited by contract.
In jurisdictions that permit liability exclusions or limits, INTΞGRITY and INTΞGRITY Parties will not be liable for:
(a) Any indirect, consequential, exemplary, incidental, punitive, or extraordinary damages, or any loss of use, data, or profits, based on any legal theory, even if INTΞGRITY or the other INTΞGRITY Parties were advised of the potential of such damages.
(b) Except for the types of liability we cannot limit by law (as described in this section), we limit the total liability of INTΞGRITY and the other INTΞGRITY Parties for any claim arising out of or related to these Terms or our Services, regardless of the form of action, to $100.00 USD.
Arbitration; Resolution of Disputes
We intend to address your concerns without filing a formal lawsuit. Before making a claim against INTΞGRITY, you agree to contact us and attempt to resolve the dispute informally by emailing hello@int3grity.com or by sending certified mail to INTΞGRITY, P.O. JOY, 479 Jessie St, San Francisco, CA 94103. The notice must (a) contain your name, address, email address, and telephone number; (b) identify the nature and grounds of the claim; and (c) detail the relief requested. Our notice to you will be sent to the email address linked with your online account and will contain the information specified in the preceding section. Any party may commence a formal procedure if we are unable to reach a resolution within thirty (30) days of the date of any notice.
Please read the following section carefully because it compels you to arbitrate certain claims and disputes with INTΞGRITY and limits the method in which you can seek redress from us, unless you opt out of arbitration by following the steps provided below. This arbitration provision does not permit class or representative lawsuits or arbitrations. In addition, arbitration prohibits you from filing a lawsuit or having a jury trial.
(a) Absence of Representative Actions You and INTΞGRITY agree that any dispute arising out of or relating to these Terms or our Services is personal to you and INTΞGRITY and will be resolved entirely via individual action, and not by class arbitration, class action, or other representative procedure.
(b) Dispute Arbitration. Except for small claims disputes in which you or INTΞGRITY seeks to bring an individual action in small claims court located in the county where you reside and disputes in which you or INTΞGRITY seeks injunctive or other equitable relief for the alleged infringement or misappropriation of intellectual property, you and INTΞGRITY waive your rights to a jury trial and to have any other dispute arising out of or relating to these Terms or our Services, including claims related to privity of contract, decided by a jury. All Disputes submitted to JAMS shall be decided by confidential, binding arbitration before a single arbitrator. If you are a consumer, you may choose to have the arbitration in your county of residence. A "consumer" is a person who uses the Services for personal, family, or household purposes for the purposes of this provision. You and INTΞGRITY agree that Disputes shall be resolved using the JAMS Streamlined Arbitration Rules and Procedures ("JAMS Rules"). The latest version of the JAMS Rules is accessible on the JAMS website and is incorporated herein by reference. Either you accept and agree that you have read and comprehended the JAMS Rules or you forfeit your right to read the JAMS Rules and any claim that the JAMS Rules are unreasonable or should not apply for any reason.
(c) You and INTΞGRITY agree that these Terms affect interstate commerce and that the enforceability of this provision is subject to the Federal Arbitration Act, 9 U.S.C. 1 et seq. (the "FAA"), to the maximum extent permissible by applicable law. As limited by the FAA, these Terms, and the JAMS Rules, the arbitrator will have sole authority to make all procedural and substantive judgments regarding any Dispute, and to grant any remedy that would otherwise be available in court, including the authority to determine arbitrability. The arbitrator may only conduct an individual arbitration and may not consolidate the claims of more than one party, preside over any sort of class or representative procedure, or preside over any proceeding involving more than one party.
d) The arbitration will permit the discovery or exchange of nonconfidential information pertinent to the Dispute. The arbitrator, INTΞGRITY, and you will maintain the confidentiality of all arbitration proceedings, judgments, and awards, as well as any information gathered, prepared, or presented for the purposes of the arbitration or relating to the Dispute(s) therein. Unless the law specifies otherwise, the arbitrator will have the right to make decisions that protect confidentiality. The duty of confidentiality does not apply where disclosure is required to prepare for or conduct the arbitration hearing on the merits, in connection with a court application for a preliminary remedy, in connection with a judicial challenge to an arbitration award or its enforcement, or where disclosure is otherwise required by law or judicial decision.
e) You and INTΞGRITY agree that for any arbitration you begin, you will pay the filing fee (up to $250 if you are a consumer) and INTΞGRITY will pay the remaining JAMS fees and costs. INTΞGRITY will pay all JAMS fees and costs for any and all arbitrations it initiates. You and INTΞGRITY agree that the state and federal courts of California and the United States located in San Francisco have exclusive jurisdiction over any appeals and the implementation of an arbitration award.
(f) Any Dispute must be filed within one year after the relevant claim arose; otherwise, the Dispute is permanently barred, meaning that neither you nor INTΞGRITY will be able to assert the claim.
(g) You have the right to opt-out of binding arbitration within 30 days of the date you initially accepted the terms of this section by sending an email to hello@int3grity.com. For the opt-out notification to be effective, it must include your full name and address and clearly explain your intent to opt out of binding arbitration. By declining binding arbitration, you consent to the resolution of Disputes in accordance with "Governing Law and Venue" below.
(h) If any portion of this section is found to be unenforceable or unlawful for any reason: (1) the unenforceable or unlawful provision shall be severed from these Terms; (2) the severance of the unenforceable or unlawful provision shall have no effect whatsoever on the remainder of this section or the parties' ability to compel arbitration of any remaining claims on an individual basis pursuant to this section; and (3) to the extent that any claims must therefore proceed on an individual basis, the parties agree to arbitrate those claims on an individual basis. In addition, if it is determined that any portion of this section prohibits an individual claim seeking public injunctive relief, that provision will be null and void to the extent that such relief may be sought outside of arbitration, and the balance of this section will be enforceable.
Statute and Location
These Terms and any dispute that may arise between you and INTΞGRITY are governed by California law, excluding its conflict of law provisions. Any issue between the parties that is not arbitrable or cannot be heard in small claims court will be determined by the state or federal courts of California and the United States, sitting in San Francisco, California.
Some nations have regulations that require agreements to be controlled by the consumer's country's laws. These statutes are not overridden by this paragraph.
Amendments
Periodically, we may make modifications to these Terms. If we make modifications, we will notify you by sending an email to the address connected with your account, providing an in-product message, or amending the date at the top of these Terms. Unless we specify otherwise in our notification, the modified Terms will take effect immediately, and your continued use of our Services after we issue such notice indicates your acceptance of the changes. If you do not accept the updated Terms, you must cease using our services.
Severability
If any section or portion of a provision of these Terms is determined to be unlawful, void, or unenforceable, that provision or part of the provision shall be deemed severable from these Terms and shall not affect the validity and enforceability of the other terms.
Miscellaneous INTΞGRITY’s omission to assert or enforce any right or term of these Terms is not a waiver of such right or provision. These Terms and the terms and policies specified in the Other Terms and Policies that May Apply to You Section constitute the complete agreement between the parties pertaining to the subject matter hereof and supersede all prior agreements, statements, and understandings between the parties. The section headings in these Terms are for convenience only and have no legal or contractual significance. The use of the word "including" shall be taken to mean "including without limitation." Unless otherwise specified, these Terms are intended solely for the benefit of the parties and are not intended to confer third-party beneficiary rights on any other person or entity. You consent to the use of electronic means for our communications and transactions.

Isaiah McCall
3 years ago
There is a new global currency emerging, but it is not bitcoin.
America should avoid BRICS

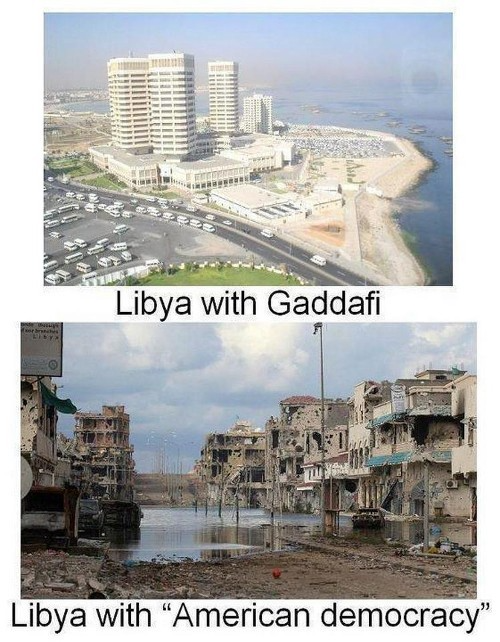
Vladimir Putin has watched videos of Muammar Gaddafi's CIA-backed demise.
Gaddafi...
Thief.
Did you know Gaddafi wanted a gold-backed dinar for Africa? Because he considered our global financial system was a Ponzi scheme, he wanted to discontinue trading oil in US dollars.
Or, Gaddafi's Libya enjoyed Africa's highest quality of living before becoming freed. Pictured:
Vladimir Putin is a nasty guy, but he had his reasons for not mentioning NATO assisting Ukraine in resisting US imperialism. Nobody tells you. Sure.
The US dollar's corruption post-2008, debasement by quantitative easing, and lack of value are key factors. BRICS will replace the dollar.
BRICS aren't bricks.
Economy-related.
Brazil, Russia, India, China, and South Africa have cooperated for 14 years to fight U.S. hegemony with a new international currency: BRICS.
BRICS is mostly comical. Now. Saudi Arabia, the second-largest oil hegemon, wants to join.
So what?
The New World Currency is BRICS
Russia was kicked out of G8 for its aggressiveness in Crimea in 2014.
It's now G7.
No biggie, said Putin, he said, and I quote, “Bon appetite.”
He was prepared. China, India, and Brazil lead the New World Order.
Together, they constitute 40% of the world's population and, according to the IMF, 50% of the world's GDP by 2030.
Here’s what the BRICS president Marcos Prado Troyjo had to say earlier this year about no longer needing the US dollar: “We have implemented the mechanism of mutual settlements in rubles and rupees, and there is no need for our countries to use the dollar in mutual settlements. And today a similar mechanism of mutual settlements in rubles and yuan is being developed by China.”
Ick. That's D.C. and NYC warmongers licking their chops for WW3 nasty.
Here's a lovely picture of BRICS to relax you:

If Saudi Arabia joins BRICS, as President Mohammed Bin Salman has expressed interest, a majority of the Middle East will have joined forces to construct a new world order not based on the US currency.
I'm not sure of the new acronym.
SBRICSS? CIRBSS? CRIBSS?
The Reason America Is Harvesting What It Sowed
BRICS began 14 years ago.
14 years ago, what occurred? Concentrate. It involved CDOs, bad subprime mortgages, and Wall Street quants crunching numbers.
2008 recession
When two nations trade, they do so in US dollars, not Euros or gold.
What happened when 2008, an avoidable crisis caused by US banks' cupidity and ignorance, what happened?
Everyone WORLDWIDE felt the pain.
Mostly due to corporate America's avarice.
This should have been a warning that China and Russia had enough of our bs. Like when France sent a battleship to America after Nixon scrapped the gold standard. The US was warned to shape up or be dethroned (or at least try).
Nixon improved in 1971. Kinda. Invented PetroDollar.
Another BS system that unfairly favors America and possibly pushed Russia, China, and Saudi Arabia into BRICS.
The PetroDollar forces oil-exporting nations to trade in US dollars and invest in US Treasury bonds. Brilliant. Genius evil.
Our misdeeds are:
In conflicts that are not its concern, the USA uses the global reserve currency as a weapon.
Targeted nations abandon the dollar, and rightfully so, as do nations that depend on them for trade in vital resources.
The dollar's position as the world's reserve currency is in jeopardy, which could have disastrous economic effects.
Although we have actually sown our own doom, we appear astonished. According to the Bible, whomever sows to appease his sinful nature will reap destruction from that nature whereas whoever sows to appease the Spirit will reap eternal life from the Spirit.
Americans, even our leaders, lack caution and delayed pleasure. When our unsustainable systems fail, we double down. Bailouts of the banks in 2008 were myopic, puerile, and another nail in America's hegemony.
America has screwed everyone.
We're unpopular.
The BRICS's future
It's happened before.
Saddam Hussein sold oil in Euros in 2000, and the US invaded Iraq a month later. The media has devalued the word conspiracy. The Iraq conspiracy.
There were no WMDs, but NYT journalists like Judy Miller drove Americans into a warmongering frenzy because Saddam would ruin the PetroDollar. Does anyone recall that this war spawned ISIS?
I think America has done good for the world. You can make a convincing case that we're many people's villain.
Learn more in Confessions of an Economic Hitman, The Devil's Chessboard, or Tyranny of the Federal Reserve. Or ignore it. That's easier.
We, America, should extend an olive branch, ask for forgiveness, and learn from our faults, as the Tao Te Ching advises. Unlikely. Our population is apathetic and stupid, and our government is corrupt.
Argentina, Iran, Egypt, and Turkey have also indicated interest in joining BRICS. They're also considering making it gold-backed, making it a new world reserve currency.
You should pay attention.
Thanks for reading!

Sam Hickmann
3 years ago
Donor-Advised Fund Tax Benefits (DAF)
Giving through a donor-advised fund can be tax-efficient. Using a donor-advised fund can reduce your tax liability while increasing your charitable impact.
Grow Your Donations Tax-Free.
Your DAF's charitable dollars can be invested before being distributed. Your DAF balance can grow with the market. This increases grantmaking funds. The assets of the DAF belong to the charitable sponsor, so you will not be taxed on any growth.
Avoid a Windfall Tax Year.
DAFs can help reduce tax burdens after a windfall like an inheritance, business sale, or strong market returns. Contributions to your DAF are immediately tax deductible, lowering your taxable income. With DAFs, you can effectively pre-fund years of giving with assets from a single high-income event.
Make a contribution to reduce or eliminate capital gains.
One of the most common ways to fund a DAF is by gifting publicly traded securities. Securities held for more than a year can be donated at fair market value and are not subject to capital gains tax. If a donor liquidates assets and then donates the proceeds to their DAF, capital gains tax reduces the amount available for philanthropy. Gifts of appreciated securities, mutual funds, real estate, and other assets are immediately tax deductible up to 30% of Adjusted gross income (AGI), with a five-year carry-forward for gifts that exceed AGI limits.
Using Appreciated Stock as a Gift
Donating appreciated stock directly to a DAF rather than liquidating it and donating the proceeds reduces philanthropists' tax liability by eliminating capital gains tax and lowering marginal income tax.
In the example below, a donor has $100,000 in long-term appreciated stock with a cost basis of $10,000:
Using a DAF would allow this donor to give more to charity while paying less taxes. This strategy often allows donors to give more than 20% more to their favorite causes.
For illustration purposes, this hypothetical example assumes a 35% income tax rate. All realized gains are subject to the federal long-term capital gains tax of 20% and the 3.8% Medicare surtax. No other state taxes are considered.
The information provided here is general and educational in nature. It is not intended to be, nor should it be construed as, legal or tax advice. NPT does not provide legal or tax advice. Furthermore, the content provided here is related to taxation at the federal level only. NPT strongly encourages you to consult with your tax advisor or attorney before making charitable contributions.