


Coinbase's web3 app
Use popular Ethereum dapps with Coinbase’s new dapp wallet and browser
Tl;dr: This post highlights the ability to access web3 directly from your Coinbase app using our new dapp wallet and browser.
Decentralized autonomous organizations (DAOs) and decentralized finance (DeFi) have gained popularity in the last year (DAOs). The total value locked (TVL) of DeFi investments on the Ethereum blockchain has grown to over $110B USD, while NFTs sales have grown to over $30B USD in the last 12 months (LTM). New innovative real-world applications are emerging every day.
Today, a small group of Coinbase app users can access Ethereum-based dapps. Buying NFTs on Coinbase NFT and OpenSea, trading on Uniswap and Sushiswap, and borrowing and lending on Curve and Compound are examples.
Our new dapp wallet and dapp browser enable you to access and explore web3 directly from your Coinbase app.
Web3 in the Coinbase app
Users can now access dapps without a recovery phrase. This innovative dapp wallet experience uses Multi-Party Computation (MPC) technology to secure your on-chain wallet. This wallet's design allows you and Coinbase to share the 'key.' If you lose access to your device, the key to your dapp wallet is still safe and Coinbase can help recover it.
Set up your new dapp wallet by clicking the "Browser" tab in the Android app's navigation bar. Once set up, the Coinbase app's new dapp browser lets you search, discover, and use Ethereum-based dapps.
Looking forward
We want to enable everyone to seamlessly and safely participate in web3, and today’s launch is another step on that journey. We're rolling out the new dapp wallet and browser in the US on Android first to a small subset of users and plan to expand soon. Stay tuned!
More on Web3 & Crypto

Jonathan Vanian
4 years ago
What is Terra? Your guide to the hot cryptocurrency
With cryptocurrencies like Bitcoin, Ether, and Dogecoin gyrating in value over the past few months, many people are looking at so-called stablecoins like Terra to invest in because of their more predictable prices.
Terraform Labs, which oversees the Terra cryptocurrency project, has benefited from its rising popularity. The company said recently that investors like Arrington Capital, Lightspeed Venture Partners, and Pantera Capital have pledged $150 million to help it incubate various crypto projects that are connected to Terra.
Terraform Labs and its partners have built apps that operate on the company’s blockchain technology that helps keep a permanent and shared record of the firm’s crypto-related financial transactions.
Here’s what you need to know about Terra and the company behind it.
What is Terra?
Terra is a blockchain project developed by Terraform Labs that powers the startup’s cryptocurrencies and financial apps. These cryptocurrencies include the Terra U.S. Dollar, or UST, that is pegged to the U.S. dollar through an algorithm.
Terra is a stablecoin that is intended to reduce the volatility endemic to cryptocurrencies like Bitcoin. Some stablecoins, like Tether, are pegged to more conventional currencies, like the U.S. dollar, through cash and cash equivalents as opposed to an algorithm and associated reserve token.
To mint new UST tokens, a percentage of another digital token and reserve asset, Luna, is “burned.” If the demand for UST rises with more people using the currency, more Luna will be automatically burned and diverted to a community pool. That balancing act is supposed to help stabilize the price, to a degree.
“Luna directly benefits from the economic growth of the Terra economy, and it suffers from contractions of the Terra coin,” Terraform Labs CEO Do Kwon said.
Each time someone buys something—like an ice cream—using UST, that transaction generates a fee, similar to a credit card transaction. That fee is then distributed to people who own Luna tokens, similar to a stock dividend.
Who leads Terra?
The South Korean firm Terraform Labs was founded in 2018 by Daniel Shin and Kwon, who is now the company’s CEO. Kwon is a 29-year-old former Microsoft employee; Shin now heads the Chai online payment service, a Terra partner. Kwon said many Koreans have used the Chai service to buy goods like movie tickets using Terra cryptocurrency.
Terraform Labs does not make money from transactions using its crypto and instead relies on outside funding to operate, Kwon said. It has raised $57 million in funding from investors like HashKey Digital Asset Group, Divergence Digital Currency Fund, and Huobi Capital, according to deal-tracking service PitchBook. The amount raised is in addition to the latest $150 million funding commitment announced on July 16.
What are Terra’s plans?
Terraform Labs plans to use Terra’s blockchain and its associated cryptocurrencies—including one pegged to the Korean won—to create a digital financial system independent of major banks and fintech-app makers. So far, its main source of growth has been in Korea, where people have bought goods at stores, like coffee, using the Chai payment app that’s built on Terra’s blockchain. Kwon said the company’s associated Mirror trading app is experiencing growth in China and Thailand.
Meanwhile, Kwon said Terraform Labs would use its latest $150 million in funding to invest in groups that build financial apps on Terra’s blockchain. He likened the scouting and investing in other groups as akin to a “Y Combinator demo day type of situation,” a reference to the popular startup pitch event organized by early-stage investor Y Combinator.
The combination of all these Terra-specific financial apps shows that Terraform Labs is “almost creating a kind of bank,” said Ryan Watkins, a senior research analyst at cryptocurrency consultancy Messari.
In addition to cryptocurrencies, Terraform Labs has a number of other projects including the Anchor app, a high-yield savings account for holders of the group’s digital coins. Meanwhile, people can use the firm’s associated Mirror app to create synthetic financial assets that mimic more conventional ones, like “tokenized” representations of corporate stocks. These synthetic assets are supposed to be helpful to people like “a small retail trader in Thailand” who can more easily buy shares and “get some exposure to the upside” of stocks that they otherwise wouldn’t have been able to obtain, Kwon said. But some critics have said the U.S. Securities and Exchange Commission may eventually crack down on synthetic stocks, which are currently unregulated.
What do critics say?
Terra still has a long way to go to catch up to bigger cryptocurrency projects like Ethereum.
Most financial transactions involving Terra-related cryptocurrencies have originated in Korea, where its founders are based. Although Terra is becoming more popular in Korea thanks to rising interest in its partner Chai, it’s too early to say whether Terra-related currencies will gain traction in other countries.
Terra’s blockchain runs on a “limited number of nodes,” said Messari’s Watkins, referring to the computers that help keep the system running. That helps reduce latency that may otherwise slow processing of financial transactions, he said.
But the tradeoff is that Terra is less “decentralized” than other blockchain platforms like Ethereum, which is powered by thousands of interconnected computing nodes worldwide. That could make Terra less appealing to some blockchain purists.

Nabil Alouani
3 years ago
Why Cryptocurrency Is Not Dead Despite the FTX Scam
A fraud, free-market, antifragility tale

Crypto's only rival is public opinion.
In less than a week, mainstream media, bloggers, and TikTokers turned on FTX's founder.
While some were surprised, almost everyone with a keyboard and a Twitter account predicted the FTX collapse. These financial oracles should have warned the 1.2 million people Sam Bankman-Fried duped.
After happening, unexpected events seem obvious to our brains. It's a bug and a feature because it helps us cope with disasters and makes our reasoning suck.
Nobody predicted the FTX debacle. Bloomberg? Politicians. Non-famous. No cryptologists. Who?
When FTX imploded, taking billions of dollars with it, an outrage bomb went off, and the resulting shockwave threatens the crypto market's existence.
As someone who lost more than $78,000 in a crypto scam in 2020, I can only understand people’s reactions. When the dust settles and rationality returns, we'll realize this is a natural occurrence in every free market.
What specifically occurred with FTX? (Skip if you are aware.)
FTX is a cryptocurrency exchange where customers can trade with cash. It reached #3 in less than two years as the fastest-growing platform of its kind.
FTX's performance helped make SBF the crypto poster boy. Other reasons include his altruistic public image, his support for the Democrats, and his company Alameda Research.
Alameda Research made a fortune arbitraging Bitcoin.
Arbitrage trading uses small price differences between two markets to make money. Bitcoin costs $20k in Japan and $21k in the US. Alameda Research did that for months, making $1 million per day.
Later, as its capital grew, Alameda expanded its trading activities and began investing in other companies.
Let's now discuss FTX.
SBF's diabolic master plan began when he used FTX-created FTT coins to inflate his trading company's balance sheets. He used inflated Alameda numbers to secure bank loans.
SBF used money he printed himself as collateral to borrow billions for capital. Coindesk exposed him in a report.
One of FTX's early investors tweeted that he planned to sell his FTT coins over the next few months. This would be a minor event if the investor wasn't Binance CEO Changpeng Zhao (CZ).
The crypto space saw a red WARNING sign when CZ cut ties with FTX. Everyone with an FTX account and a brain withdrew money. Two events followed. FTT fell from $20 to $4 in less than 72 hours, and FTX couldn't meet withdrawal requests, spreading panic.
SBF reassured FTX users on Twitter. Good assets.
He lied.
SBF falsely claimed FTX had a liquidity crunch. At the time of his initial claims, FTX owed about $8 billion to its customers. Liquidity shortages are usually minor. To get cash, sell assets. In the case of FTX, the main asset was printed FTT coins.
Sam wouldn't get out of trouble even if he slashed the discount (from $20 to $4) and sold every FTT. He'd flood the crypto market with his homemade coins, causing the price to crash.
SBF was trapped. He approached Binance about a buyout, which seemed good until Binance looked at FTX's books.
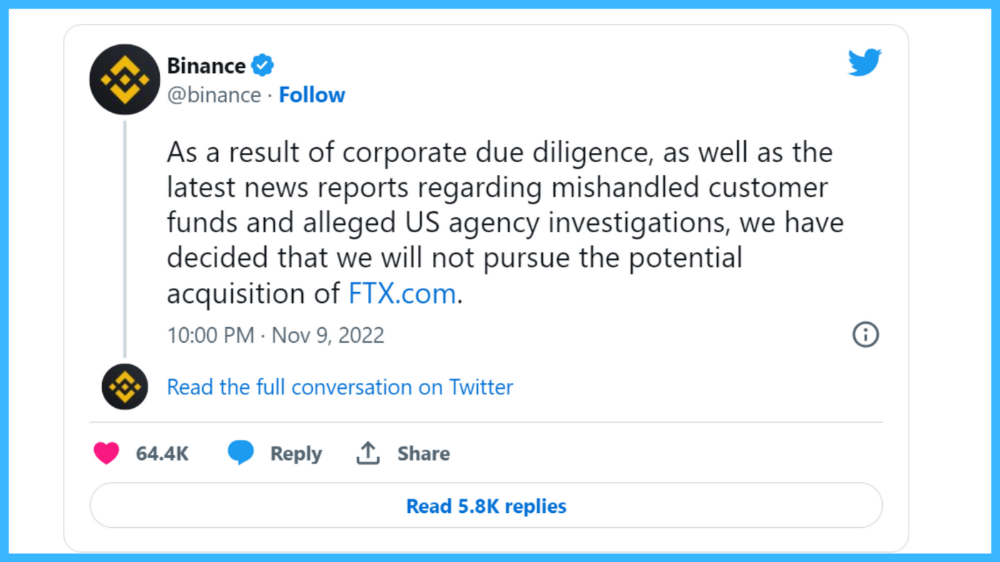
Binance's tweet ended SBF, and he had to apologize, resign as CEO, and file for bankruptcy.
Bloomberg estimated Sam's net worth to be zero by the end of that week. 0!
But that's not all. Twitter investigations exposed fraud at FTX and Alameda Research. SBF used customer funds to trade and invest in other companies.
Thanks to the Twitter indie reporters who made the mainstream press look amateurish. Some Twitter detectives didn't sleep for 30 hours to find answers. Others added to existing threads. Memes were hilarious.
One question kept repeating in my bald head as I watched the Blue Bird. Sam, WTF?
Then I understood.
SBF wanted that FTX becomes a bank.
Think about this. FTX seems healthy a few weeks ago. You buy 2 bitcoins using FTX. You'd expect the platform to take your dollars and debit your wallet, right?
No. They give I-Owe-Yous.
FTX records owing you 2 bitcoins in its internal ledger but doesn't credit your account. Given SBF's tricks, I'd bet on nothing.
What happens if they don't credit my account with 2 bitcoins? Your money goes into FTX's capital, where SBF and his friends invest in marketing, political endorsements, and buying other companies.
Over its two-year existence, FTX invested in 130 companies. Once they make a profit on their purchases, they'll pay you and keep the rest.
One detail makes their strategy dumb. If all FTX customers withdraw at once, everything collapses.
Financially savvy people think FTX's collapse resembles a bank run, and they're right. SBF designed FTX to operate like a bank.
You expect your bank to open a drawer with your name and put $1,000 in it when you deposit $1,000. They deposit $100 in your drawer and create an I-Owe-You for $900. What happens to $900?
Let's sum it up: It's boring and headache-inducing.
When you deposit money in a bank, they can keep 10% and lend the rest. Fractional Reserve Banking is a popular method. Fractional reserves operate within and across banks.
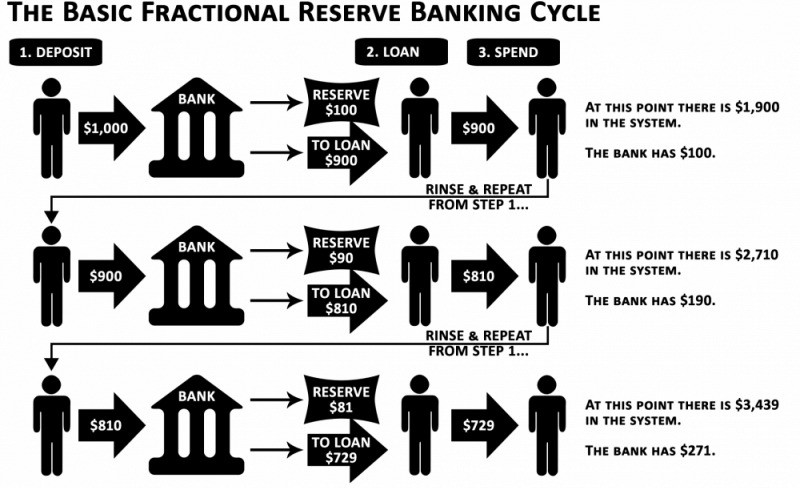
Fractional reserve banking generates $10,000 for every $1,000 deposited. People will pay off their debt plus interest.
As long as banks work together and the economy grows, their model works well.
SBF tried to replicate the system but forgot two details. First, traditional banks need verifiable collateral like real estate, jewelry, art, stocks, and bonds, not digital coupons. Traditional banks developed a liquidity buffer. The Federal Reserve (or Central Bank) injects massive cash into troubled banks.
Massive cash injections come from taxpayers. You and I pay for bankers' mistakes and annual bonuses. Yes, you may think banking is rigged. It's rigged, but it's the best financial game in 150 years. We accept its flaws, including bailouts for too-big-to-fail companies.
Anyway.
SBF wanted Binance's bailout. Binance said no, which was good for the crypto market.
Free markets are resilient.
Nassim Nicholas Taleb coined the term antifragility.
“Some things benefit from shocks; they thrive and grow when exposed to volatility, randomness, disorder, and stressors and love adventure, risk, and uncertainty. Yet, in spite of the ubiquity of the phenomenon, there is no word for the exact opposite of fragile. Let us call it antifragile. Antifragility is beyond resilience or robustness. The resilient resists shocks and stays the same; the antifragile gets better.”
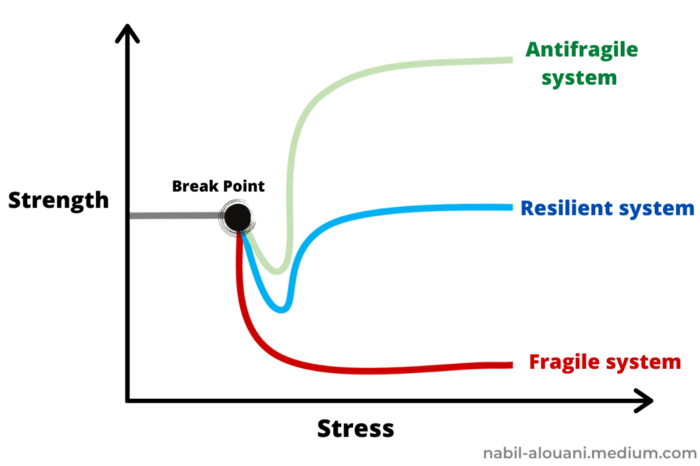
The easiest way to understand how antifragile systems behave is to compare them with other types of systems.
Glass is like a fragile system. It snaps when shocked.
Similar to rubber, a resilient system. After a stressful episode, it bounces back.
A system that is antifragile is similar to a muscle. As it is torn in the gym, it gets stronger.
Time-changed things are antifragile. Culture, tech innovation, restaurants, revolutions, book sales, cuisine, economic success, and even muscle shape. These systems benefit from shocks and randomness in different ways, but they all pay a price for antifragility.
Same goes for the free market and financial institutions. Taleb's book uses restaurants as an example and ends with a reference to the 2008 crash.
“Restaurants are fragile. They compete with each other. But the collective of local restaurants is antifragile for that very reason. Had restaurants been individually robust, hence immortal, the overall business would be either stagnant or weak and would deliver nothing better than cafeteria food — and I mean Soviet-style cafeteria food. Further, it [the overall business] would be marred with systemic shortages, with once in a while a complete crisis and government bailout.”
Imagine the same thing with banks.
Independent banks would compete to offer the best services. If one of these banks fails, it will disappear. Customers and investors will suffer, but the market will recover from the dead banks' mistakes.
This idea underpins a free market. Bitcoin and other cryptocurrencies say this when criticizing traditional banking.
The traditional banking system's components never die. When a bank fails, the Federal Reserve steps in with a big taxpayer-funded check. This hinders bank evolution. If you don't let banking cells die and be replaced, your financial system won't be antifragile.
The interdependence of banks (centralization) means that one bank's mistake can sink the entire fleet, which brings us to SBF's ultimate travesty with FTX.
FTX has left the cryptocurrency gene pool.
FTX should be decentralized and independent. The super-star scammer invested in more than 130 crypto companies and linked them, creating a fragile banking-like structure. FTX seemed to say, "We exist because centralized banks are bad." But we'll be good, unlike the centralized banking system.
FTX saved several companies, including BlockFi and Voyager Digital.
FTX wanted to be a crypto bank conglomerate and Federal Reserve. SBF wanted to monopolize crypto markets. FTX wanted to be in bed with as many powerful people as possible, so SBF seduced politicians and celebrities.
Worst? People who saw SBF's plan flaws praised him. Experts, newspapers, and crypto fans praised FTX. When billions pour in, it's hard to realize FTX was acting against its nature.
Then, they act shocked when they realize FTX's fall triggered a domino effect. Some say the damage could wipe out the crypto market, but that's wrong.
Cell death is different from body death.
FTX is out of the game despite its size. Unfit, it fell victim to market natural selection.
Next?
The challengers keep coming. The crypto economy will improve with each failure.
Free markets are antifragile because their fragile parts compete, fostering evolution. With constructive feedback, evolution benefits customers and investors.
FTX shows that customers don't like being scammed, so the crypto market's health depends on them. Charlatans and con artists are eliminated quickly or slowly.
Crypto isn't immune to collapse. Cryptocurrencies can go extinct like biological species. Antifragility isn't immortality. A few more decades of evolution may be enough for humans to figure out how to best handle money, whether it's bitcoin, traditional banking, gold, or something else.
Keep your BS detector on. Start by being skeptical of this article's finance-related claims. Even if you think you understand finance, join the conversation.
We build a better future through dialogue. So listen, ask, and share. When you think you can't find common ground with the opposing view, remember:
Sam Bankman-Fried lied.

Onchain Wizard
3 years ago
Three Arrows Capital & Celsius Updates
I read 1k+ page 3AC liquidation documentation so you don't have to. Also sharing revised Celsius recovery plans.
3AC's liquidation documents:
Someone disclosed 3AC liquidation records in the BVI courts recently. I'll discuss the leak's timeline and other highlights.
Three Arrows Capital began trading traditional currencies in emerging markets in 2012. They switched to equities and crypto, then purely crypto in 2018.
By 2020, the firm had $703mm in net assets and $1.8bn in loans (these guys really like debt).
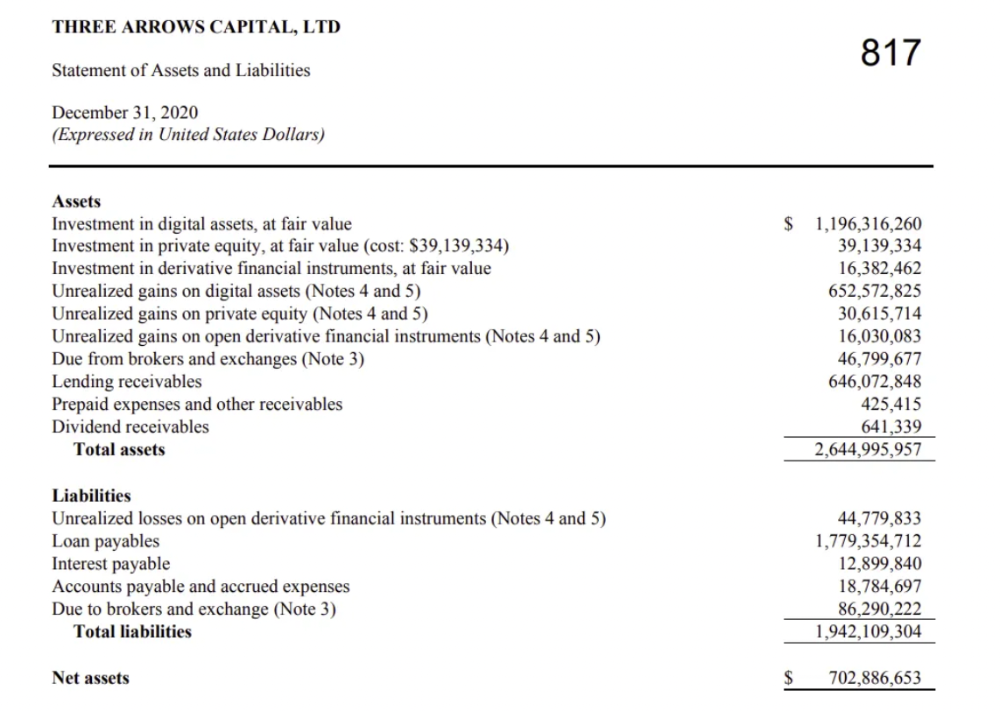
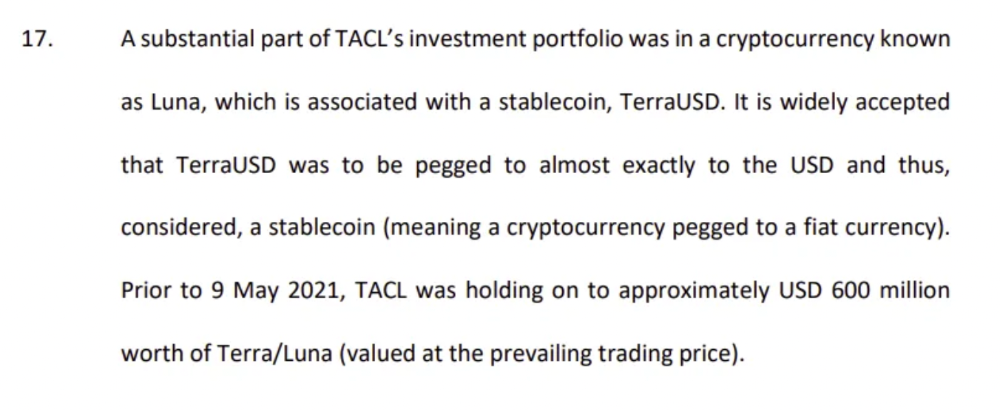
The firm's net assets under control reached $3bn in April 2022, according to the filings. 3AC had $600mm of LUNA/UST exposure before May 9th 2022, which put them over.
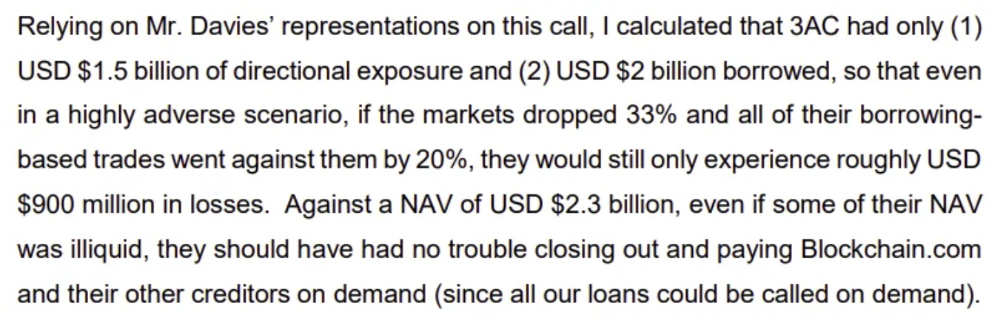
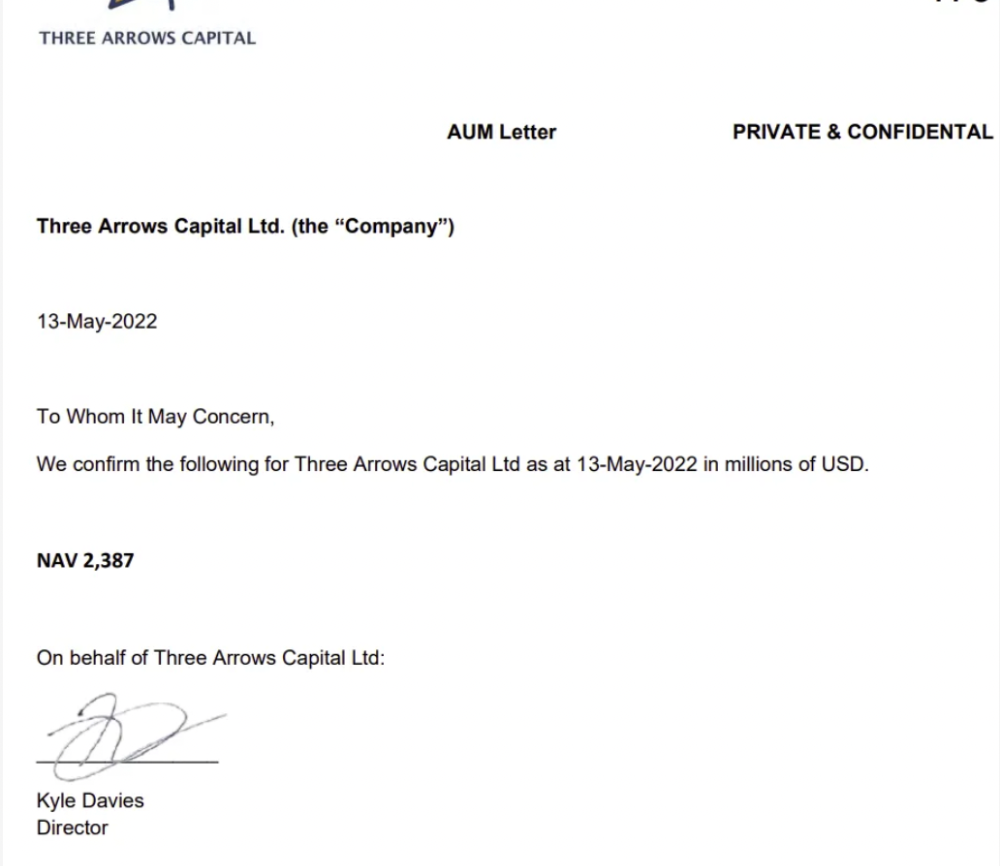
LUNA and UST go to zero quickly (I wrote about the mechanics of the blowup here). Kyle Davies, 3AC co-founder, told Blockchain.com on May 13 that they have $2.4bn in assets and $2.3bn NAV vs. $2bn in borrowings. As BTC and ETH plunged 33% and 50%, the company became insolvent by mid-2022.
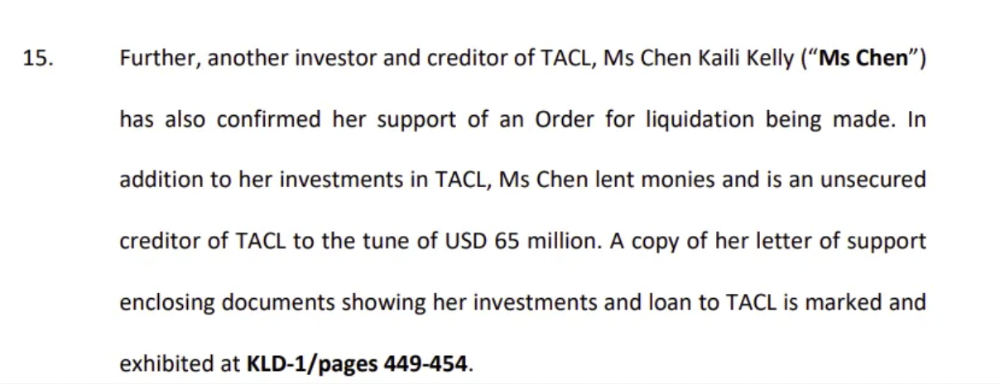
3AC sent $32mm to Tai Ping Shen, a Cayman Islands business owned by Su Zhu and Davies' partner, Kelly Kaili Chen (who knows what is going on here).
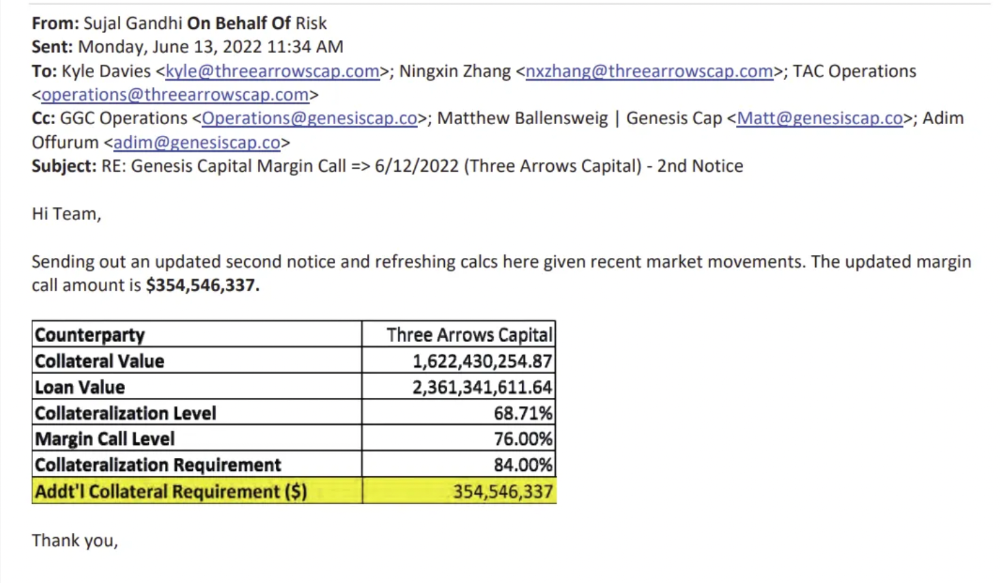
3AC had borrowed over $3.5bn in notional principle, with Genesis ($2.4bn) and Voyager ($650mm) having the most exposure.
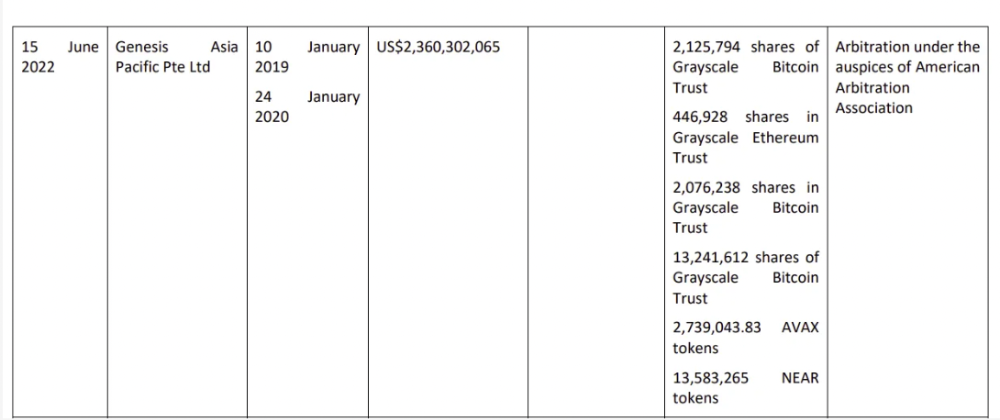
Genesis demanded $355mm in further collateral in June.
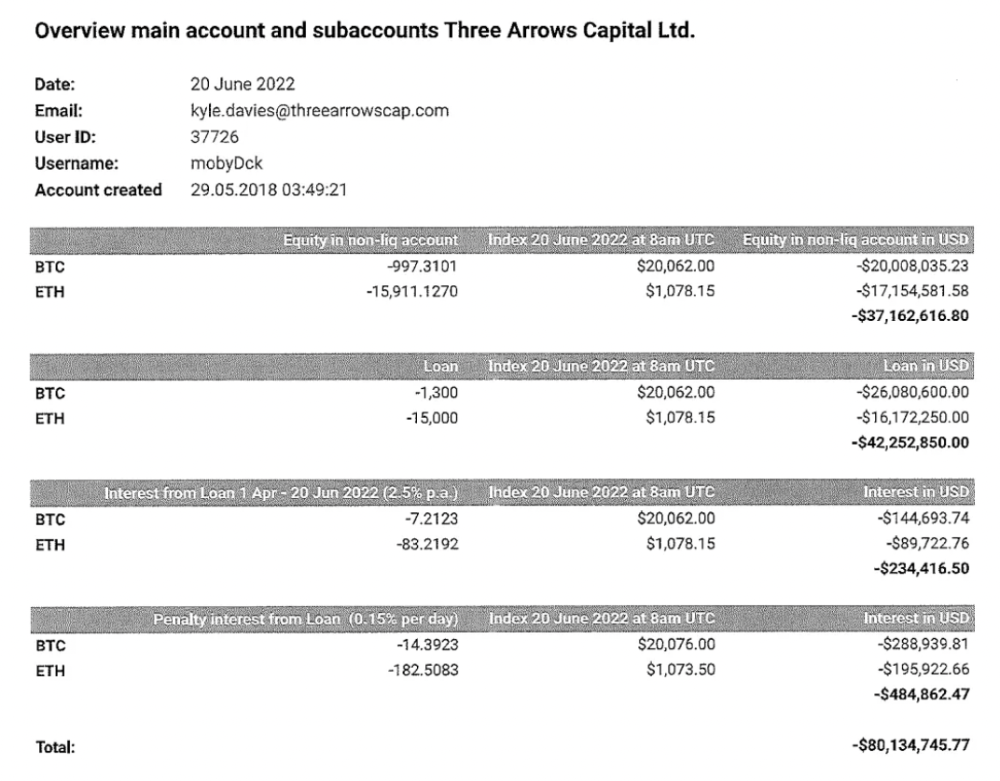
Deribit (another 3AC investment) called for $80 million in mid-June.
Even in mid-June, the corporation was trying to borrow more money to stay afloat. They approached Genesis for another $125mm loan (to pay another lender) and HODLnauts for BTC & ETH loans.
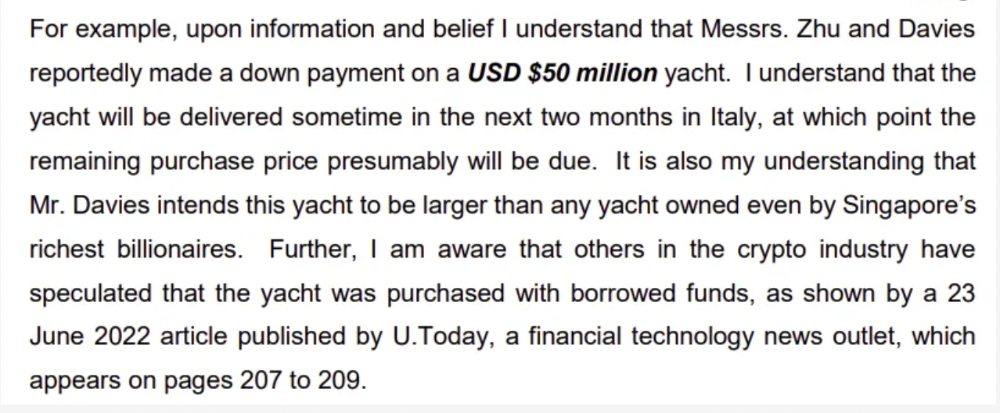
Pretty crazy. 3AC founders used borrowed money to buy a $50 million boat, according to the leak.
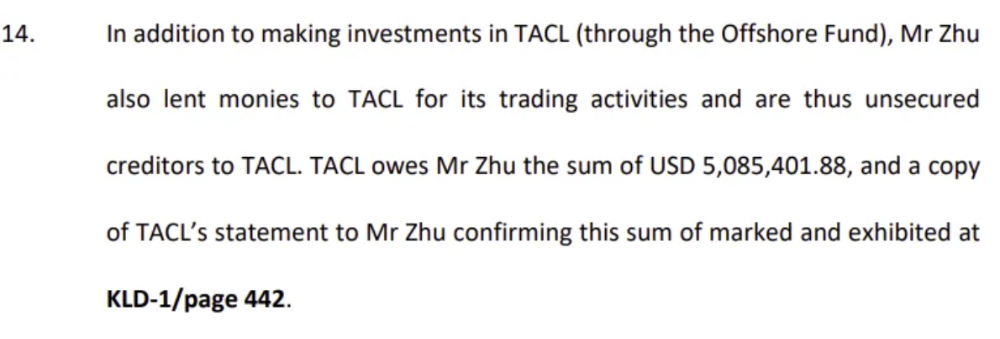
Su requesting for $5m + Chen Kaili Kelly asserting they loaned $65m unsecured to 3AC are identified as creditors.
Celsius:
This bankruptcy presentation shows the Celsius breakdown from March to July 14, 2022. From $22bn to $4bn, crypto assets plummeted from $14.6bn to $1.8bn (ouch). $16.5bn in user liabilities dropped to $4.72bn.
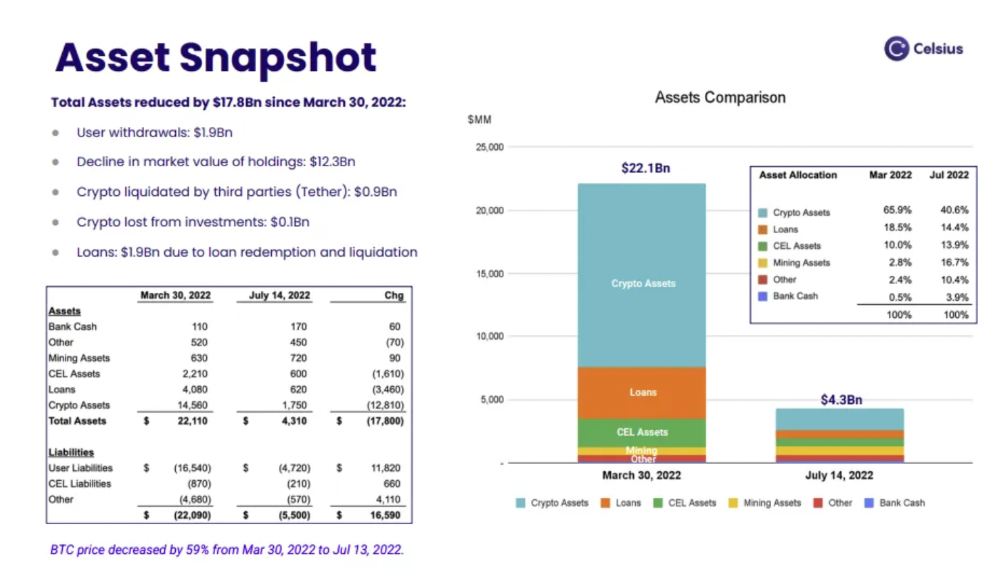
In my recent post, I examined if "forced selling" is over, with Celsius' crypto assets being a major overhang. In this presentation, it looks that Chapter 11 will provide clients the opportunity to accept cash at a discount or remain long crypto. Provided that a fresh source of money is unlikely to enter the Celsius situation, cash at a discount or crypto given to customers will likely remain a near-term market risk - cash at a discount will likely come from selling crypto assets, while customers who receive crypto could sell at any time. I'll share any Celsius updates I find.
Conclusion
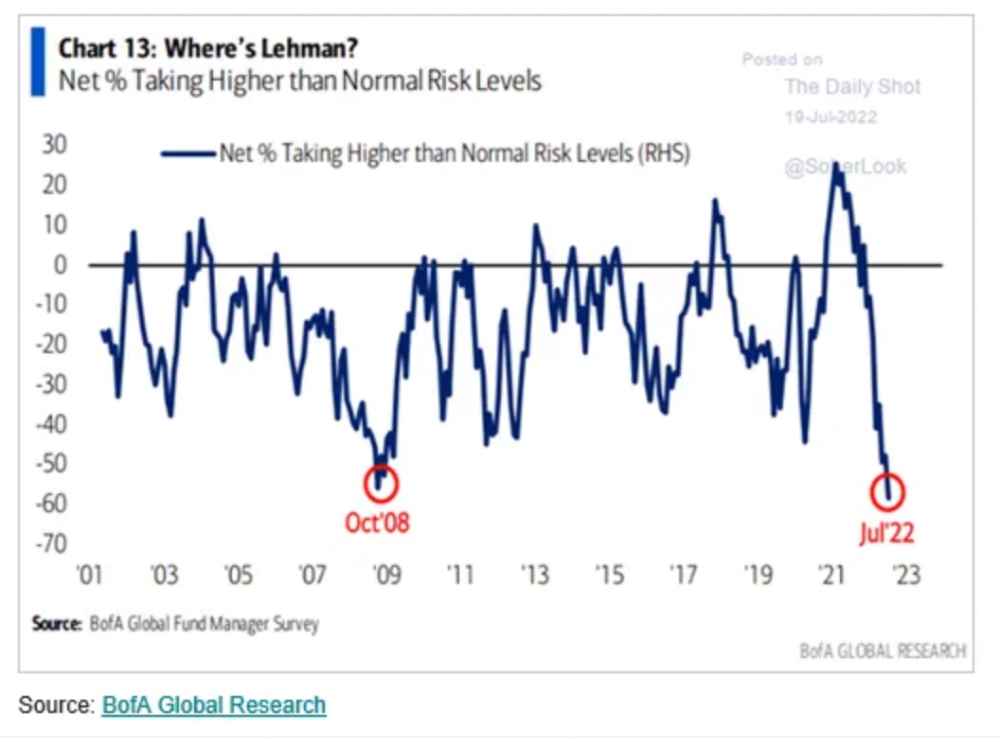
Only Celsius and the Mt Gox BTC unlock remain as forced selling catalysts. While everything went through a "relief" pump, with ETH up 75% from the bottom and numerous alts multiples higher, there are still macro dangers to equities + risk assets. There's a lot of wealth waiting to be deployed in crypto ($153bn in stables), but fund managers are risk apprehensive (lower than 2008 levels).
We're hopefully over crypto's "bottom," with peak anxiety and forced selling behind us, but we may chop around.
To see the full article, click here.
You might also like
Gill Pratt
3 years ago
War's Human Cost
War's Human Cost
I didn't start crying until I was outside a McDonald's in an Olempin, Poland rest area on highway S17.
Children pick toys at a refugee center, Olempin, Poland, March 4, 2022.
Refugee children, mostly alone with their mothers, but occasionally with a gray-haired grandfather or non-Ukrainian father, were coaxed into picking a toy from boxes provided by a kind-hearted company and volunteers.
I went to Warsaw to continue my research on my family's history during the Holocaust. In light of the ongoing Ukrainian conflict, I asked former colleagues in the US Department of Defense and Intelligence Community if it was safe to travel there. They said yes, as Poland was a NATO member.
I stayed in a hotel in the Warsaw Ghetto, where 90% of my mother's family was murdered in the Holocaust. Across the street was the first Warsaw Judenrat. It was two blocks away from the apartment building my mother's family had owned and lived in, now dilapidated and empty.
Building of my great-grandfather, December 2021.
A mass grave of thousands of rocks for those killed in the Warsaw Ghetto, I didn't cry when I touched its cold walls.
Warsaw Jewish Cemetery, 200,000–300,000 graves.
Mass grave, Warsaw Jewish Cemetery.
My mother's family had two homes, one in Warszawa and the rural one was a forest and sawmill complex in Western Ukraine. For the past half-year, a local Ukrainian historian had been helping me discover faint traces of her family’s life there — in fact, he had found some people still alive who remembered the sawmill and that it belonged to my mother’s grandfather. The historian was good at his job, and we had become close.
My historian friend, December 2021, talking to a Ukrainian.
With war raging, my second trip to Warsaw took on a different mission. To see his daughter and one-year-old grandson, I drove east instead of to Ukraine. They had crossed the border shortly after the war began, leaving men behind, and were now staying with a friend on Poland's eastern border.
I entered after walking up to the house and settling with the dog. The grandson greeted me with a huge smile and the Ukrainian word for “daddy,” “Tato!” But it was clear he was awaiting his real father's arrival, and any man he met would be so tentatively named.
After a few moments, the boy realized I was only a stranger. He had musical talent, like his mother and grandfather, both piano teachers, as he danced to YouTube videos of American children's songs dubbed in Ukrainian, picking the ones he liked and crying when he didn't.
Songs chosen by my historian friend's grandson, March 4, 2022
He had enough music and began crying regardless of the song. His mother picked him up and started nursing him, saying she was worried about him. She had no idea where she would live or how she would survive outside Ukraine. She showed me her father's family history of losses in the Holocaust, which matched my own research.
After an hour of drinking tea and trying to speak of hope, I left for the 3.5-hour drive west to Warsaw.
It was unlike my drive east. It was reminiscent of the household goods-filled carts pulled by horses and people fleeing war 80 years ago.
Jewish refugees relocating, USHMM Holocaust Encyclopaedia, 1939.
The carefully chosen trinkets by children to distract them from awareness of what is really happening and the anxiety of what lies ahead, made me cry despite all my research on the Holocaust. There is no way for them to communicate with their mothers, who are worried, absent, and without their fathers.
It's easy to see war as a contest of nations' armies, weapons, and land. The most costly aspect of war is its psychological toll. My father screamed in his sleep from nightmares of his own adolescent trauma in Warsaw 80 years ago.
Survivor father studying engineering, 1961.
In the airport, I waited to return home while Ukrainian public address systems announced refugee assistance. Like at McDonald's, many mothers were alone with their children, waiting for a flight to distant relatives.
That's when I had my worst trip experience.
A woman near me, clearly a refugee, answered her phone, cried out, and began wailing.
The human cost of war descended like a hammer, and I realized that while I was going home, she never would

Mia Gradelski
3 years ago
Six Things Best-With-Money People Do Follow

I shouldn't generalize, yet this is true.
Spending is simpler than earning.
Prove me wrong, but with home debt at $145k in 2020 and individual debt at $67k, people don't have their priorities straight.
Where does this loan originate?
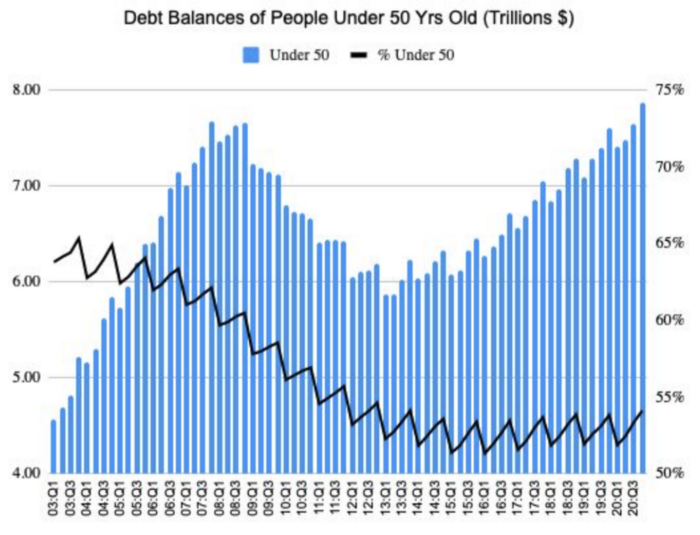
Under-50 Americans owed $7.86 trillion in Q4 20T. That's more than the US's 3-trillion-dollar deficit.
Here’s a breakdown:
🏡 Mortgages/Home Equity Loans = $5.28 trillion (67%)
🎓 Student Loans = $1.20 trillion (15%)
🚗 Auto Loans = $0.80 trillion (10%)
💳 Credit Cards = $0.37 trillion (5%)
🏥 Other/Medical = $0.20 trillion (3%)
Images.google.com
At least the Fed and government can explain themselves with their debt balance which includes:
-Providing stimulus packages 2x for Covid relief
-Stabilizing the economy
-Reducing inflation and unemployment
-Providing for the military, education and farmers
No American should have this much debt.
Don’t get me wrong. Debt isn’t all the same. Yes, it’s a negative number but it carries different purposes which may not be all bad.
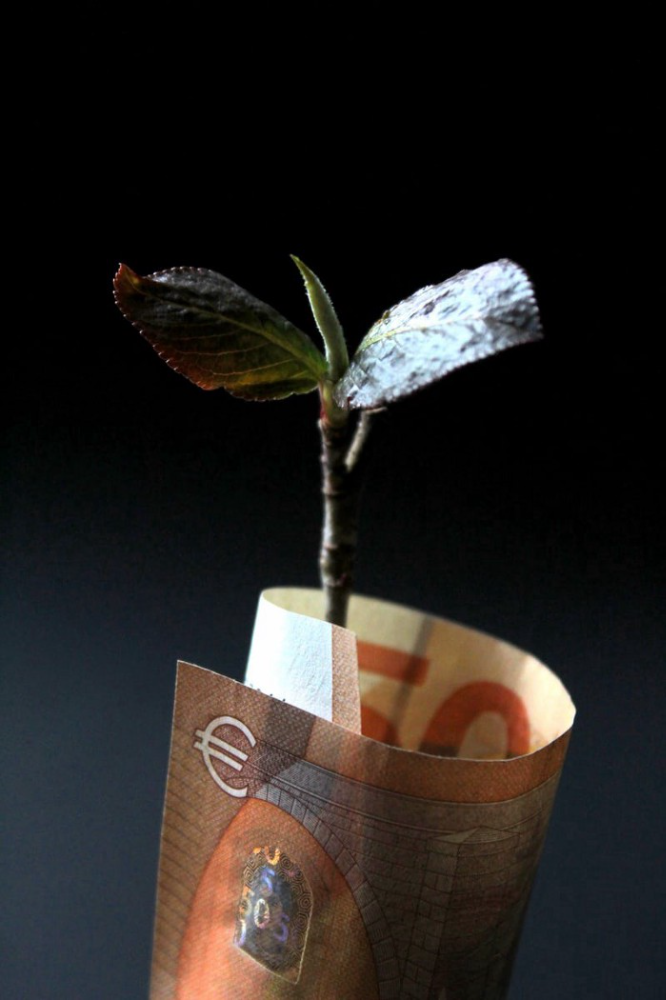
Good debt: Use those funds in hopes of them appreciating as an investment in the future
-Student loans
-Business loan
-Mortgage, home equity loan
-Experiences
Paying cash for a home is wasteful. Just if the home is exceptionally uncommon, only 1 in a million on the market, and has an incredible bargain with numerous bidders seeking higher prices should you do so.
To impress the vendor, pay cash so they can sell it quickly. Most people can't afford most properties outright. Only 15% of U.S. homebuyers can afford their home. Zillow reports that only 37% of homes are mortgage-free.
People have clearly overreached.
Ignore appearances.
5% down can buy a 10-bedroom mansion.
Not paying in cash isn't necessarily a negative thing given property prices have increased by 30% since 2008, and throughout the epidemic, we've seen work-from-homers resort to the midwest, avoiding pricey coastal cities like NYC and San Francisco.
By no means do I think NYC is dead, nothing will replace this beautiful city that never sleeps, and now is the perfect time to rent or buy when everything is below average value for people who always wanted to come but never could. Once social distance ends, cities will recover. 24/7 sardine-packed subways prove New York isn't designed for isolation.
When buying a home, pay 20% cash and the balance with a mortgage. A mortgage must be incorporated into other costs such as maintenance, brokerage fees, property taxes, etc. If you're stuck on why a home isn't right for you, read here. A mortgage must be paid until the term date. Whether its a 10 year or 30 year fixed mortgage, depending on interest rates, especially now as the 10-year yield is inching towards 1.25%, it's better to refinance in a lower interest rate environment and pay off your debt as well since the Fed will be inching interest rates up following the 10-year eventually to stabilize the economy, but I believe that won't be until after Covid and when businesses like luxury, air travel, and tourism will get bashed.
Bad debt: I guess the contrary must be true. There is no way to profit from the loan in the future, therefore it is just money down the drain.
-Luxury goods
-Credit card debt
-Fancy junk
-Vacations, weddings, parties, etc.
Credit cards and school loans are the two largest risks to the financial security of those under 50 since banks love to compound interest to affect your credit score and make it tougher to take out more loans, not that you should with that much debt anyhow. With a low credit score and heavy debt, banks take advantage of you because you need aid to pay more for their services. Paying back debt is the challenge for most.
Choose Not Chosen
As a financial literacy advocate and blogger, I prefer not to brag, but I will now. I know what to buy and what to avoid. My parents educated me to live a frugal, minimalist stealth wealth lifestyle by choice, not because we had to.
That's the lesson.
The poorest person who shows off with bling is trying to seem rich.
Rich people know garbage is a bad investment. Investing in education is one of the best long-term investments. With information, you can do anything.
Good with money shun some items out of respect and appreciation for what they have.

Less is more.
Instead of copying the Joneses, use what you have. They may look cheerful and stylish in their 20k ft home, yet they may be as broke as OJ Simpson in his 20-bedroom mansion.
Let's look at what appears good to follow and maintain your wealth.
#1: Quality comes before quantity
Being frugal doesn't entail being cheap and cruel. Rich individuals care about relationships and treating others correctly, not impressing them. You don't have to be rich to be good with money, although most are since they don't live the fantasy lifestyle.
Underspending is appreciating what you have.
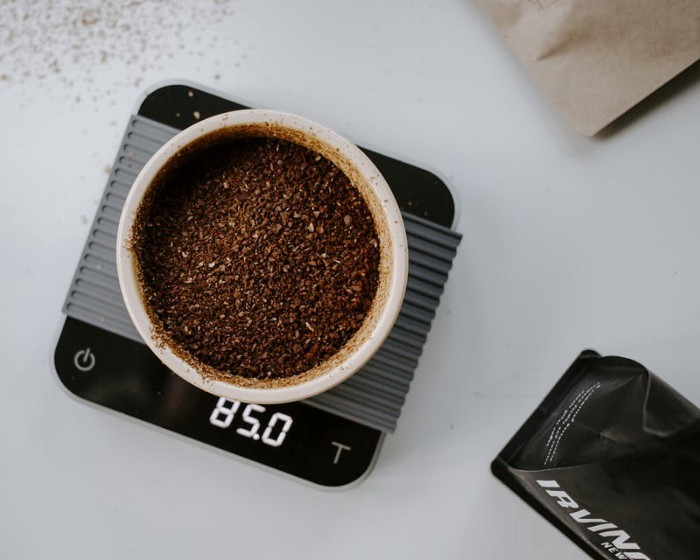
Many people believe organic food is the same as washing chemical-laden produce. Hopefully. Organic, vegan, fresh vegetables from upstate may be more expensive in the short term, but they will help you live longer and save you money in the long run.
Consider. You'll save thousands a month eating McDonalds 3x a day instead of fresh seafood, veggies, and organic fruit, but your life will be shortened. If you want to save money and die early, go ahead, but I assume we all want to break the world record for longest person living and would rather spend less. Plus, elderly people get tax breaks, medicare, pensions, 401ks, etc. You're living for free, therefore eating fast food forever is a terrible decision.
With a few longer years, you may make hundreds or millions more in the stock market, spend more time with family, and just live.
Folks, health is wealth.
Consider the future benefit, not simply the cash sign. Cheapness is useless.
Same with stuff. Don't stock your closet with fast-fashion you can't wear for years. Buying inexpensive goods that will fail tomorrow is stupid.
Investing isn't only in stocks. You're living. Consume less.
#2: If you cannot afford it twice, you cannot afford it once
I learned this from my dad in 6th grade. I've been lucky to travel, experience things, go to a great university, and conduct many experiments that others without a stable, decent lifestyle can afford.
I didn't live this way because of my parents' paycheck or financial knowledge.
Saving and choosing caused it.
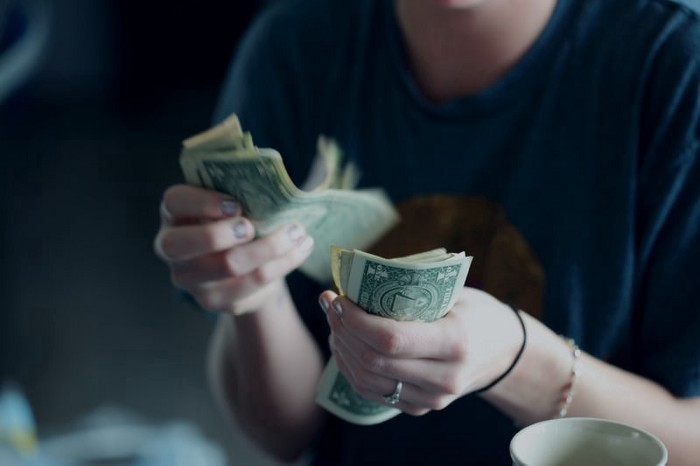
I always bring cash when I shop. I ditch Apple Pay and credit cards since I can spend all I want on even if my account bounces.
Banks are nasty. When you lose it, they profit.
Cash hinders banks' profits. Carrying a big, hefty wallet with cash is lame and annoying, but it's the best method to only spend what you need. Not for vacation, but for tiny daily expenses.
Physical currency lets you know how much you have for lunch or a taxi.
It's physical, thus losing it prevents debt.
If you can't afford it, it will harm more than help.
#3: You really can purchase happiness with money.
If used correctly, yes.
Happiness and satisfaction differ.
It won't bring you fulfillment because you must work hard on your own to help others, but you can travel and meet individuals you wouldn't otherwise meet.
You can meet your future co-worker or strike a deal while waiting an hour in first class for takeoff, or you can meet renowned people at a networking brunch.
Seen a pattern here?
Your time and money are best spent on connections. Not automobiles or firearms. That’s just stuff. It doesn’t make you a better person.
Be different if you've earned less. Instead of trying to win the lotto or become an NFL star for your first big salary, network online for free.
Be resourceful. Sign up for LinkedIn, post regularly, and leave unengaged posts up because that shows power.
Consistency is beneficial.
I did that for a few months and met amazing people who helped me get jobs. Money doesn't create jobs, it creates opportunities.
Resist social media and scammers that peddle false hopes.
Choose wisely.

#4: Avoid gushing over titles and purchasing trash.
As Insider’s Hillary Hoffower reports, “Showing off wealth is no longer the way to signify having wealth. In the US particularly, the top 1% have been spending less on material goods since 2007.”
I checked my closet. No brand comes to mind. I've never worn a brand's logo and rotate 6 white shirts daily. I have my priorities and don't waste money or effort on clothing that won't fit me in a year.
Unless it's your full-time work, clothing shouldn't be part of our mornings.
Lifestyle of stealth wealth. You're so fulfilled that seeming homeless won't hurt your self-esteem.
That's self-assurance.
Extroverts aren't required.
That's irrelevant.
Showing off won't win you friends.
They'll like your personality.

#5: Time is the most valuable commodity.
Being rich doesn't entail working 24/7 M-F.
They work when they are ready to work.
Waking up at 5 a.m. won't make you a millionaire, but it will inculcate diligence and tenacity in you.
You have a busy day yet want to exercise. You can skip the workout or wake up at 4am instead of 6am to do it.
Emotion-driven lazy bums stay in bed.
Those that are accountable keep their promises because they know breaking one will destroy their week.
Since 7th grade, I've worked out at 5am for myself, not to impress others. It gives me greater energy to contribute to others, especially on weekends and holidays.
It's a habit that I have in my life.
Find something that you take seriously and makes you a better person.
As someone who is close to becoming a millionaire and has encountered them throughout my life, I can share with you a few important differences that have shaped who we are as a society based on the weekends:
-Read
-Sleep
-Best time to work with no distractions
-Eat together
-Take walks and be in nature
-Gratitude
-Major family time
-Plan out weeks
-Go grocery shopping because health = wealth
#6. Perspective is Important
Timing the markets will slow down your career. Professors preach scarcity, not abundance. Why should school teach success? They give us bad advice.
If you trust in abundance and luck by attempting and experimenting, growth will come effortlessly. Passion isn't a term that just appears. Mistakes and fresh people help. You can get money. If you don't think it's worth it, you won't.
You don’t have to be wealthy to be good at money, but most are for these reasons. Rich is a mindset, wealth is power. Prioritize your resources. Invest in yourself, knowing the toughest part is starting.
Thanks for reading!
Matthew Royse
3 years ago
These 10 phrases are unprofessional at work.
Successful workers don't talk this way.

"I know it's unprofessional, but I can't stop." — Author Sandy Hall
Do you realize your unprofessionalism? Do you care? Self-awareness?
Everyone can improve their unprofessionalism. Some workplace phrases and words shouldn't be said.
People often say out loud what they're thinking. They show insecurity, incompetence, and disrespect.
"Think before you speak," goes the saying.
Some of these phrases are "okay" in certain situations, but you'll lose colleagues' respect if you use them often.
Your word choice. Your tone. Your intentions. They matter.
Choose your words carefully to build work relationships and earn peer respect. You should build positive relationships with coworkers and clients.
These 10 phrases are unprofessional.
1. That Meeting Really Sucked
Wow! Were you there? You should be responsible if you attended. You can influence every conversation.
Alternatives
Improve the meeting instead of complaining afterward. Make it more meaningful and productive.
2. Not Sure if You Saw My Last Email
Referencing a previous email irritates people. Email follow-up can be difficult. Most people get tons of emails a day, so it may have been buried, forgotten, or low priority.
Alternatives
It's okay to follow up, but be direct, short, and let the recipient "save face"
3. Any Phrase About Sex, Politics, and Religion
Discussing sex, politics, and religion at work is foolish. If you discuss these topics, you could face harassment lawsuits.
Alternatives
Keep quiet about these contentious issues. Don't touch them.
4. I Know What I’m Talking About
Adding this won't persuade others. Research, facts, and topic mastery are key to persuasion. If you're knowledgeable, you don't need to say this.
Alternatives
Please don’t say it at all. Justify your knowledge.
5. Per Our Conversation
This phrase sounds like legal language. You seem to be documenting something legally. Cold, stern, and distant. "As discussed" sounds inauthentic.
Alternatives
It was great talking with you earlier; here's what I said.
6. Curse-Word Phrases
Swearing at work is unprofessional. You never know who's listening, so be careful. A child may be at work or on a Zoom or Teams call. Workplace cursing is unacceptable.
Alternatives
Avoid adult-only words.
7. I Hope This Email Finds You Well
This is a unique way to wish someone well. This phrase isn't as sincere as the traditional one. When you talk about the email, you're impersonal.
Alternatives
Genuinely care for others.
8. I Am Really Stressed
Happy, strong, stress-managing coworkers are valued. Manage your own stress. Exercise, sleep, and eat better.
Alternatives
Everyone has stress, so manage it. Don't talk about your stress.
9. I Have Too Much to Do
You seem incompetent. People think you can't say "no" or have poor time management. If you use this phrase, you're telling others you may need to change careers.
Alternatives
Don't complain about your workload; just manage it.
10. Bad Closing Salutations
"Warmly," "best," "regards," and "warm wishes" are common email closings. This conclusion sounds impersonal. Why use "warmly" for finance's payment status?
Alternatives
Personalize the closing greeting to the message and recipient. Use "see you tomorrow" or "talk soon" as closings.
Bringing It All Together
These 10 phrases are unprofessional at work. That meeting sucked, not sure if you saw my last email, and sex, politics, and religion phrases.
Also, "I know what I'm talking about" and any curse words. Also, avoid phrases like I hope this email finds you well, I'm stressed, and I have too much to do.
Successful workers communicate positively and foster professionalism. Don't waste chances to build strong work relationships by being unprofessional.
“Unprofessionalism damages the business reputation and tarnishes the trust of society.” — Pearl Zhu, an American author
This post is a summary. Read full article here