


More on Science

Bob Service
3 years ago
Did volcanic 'glasses' play a role in igniting early life?
Quenched lava may have aided in the formation of long RNA strands required by primitive life.
It took a long time for life to emerge. Microbes were present 3.7 billion years ago, just a few hundred million years after the 4.5-billion-year-old Earth had cooled enough to sustain biochemistry, according to fossils, and many scientists believe RNA was the genetic material for these first species. RNA, while not as complicated as DNA, would be difficult to forge into the lengthy strands required to transmit genetic information, raising the question of how it may have originated spontaneously.
Researchers may now have a solution. They demonstrate how basaltic glasses assist individual RNA letters, also known as nucleoside triphosphates, join into strands up to 200 letters long in lab studies. The glasses are formed when lava is quenched in air or water, or when melted rock generated by asteroid strikes cools rapidly, and they would have been plentiful in the early Earth's fire and brimstone.
The outcome has caused a schism among top origin-of-life scholars. "This appears to be a great story that finally explains how nucleoside triphosphates react with each other to create RNA strands," says Thomas Carell, a scientist at Munich's Ludwig Maximilians University. However, Harvard University's Jack Szostak, an RNA expert, says he won't believe the results until the study team thoroughly describes the RNA strands.
Researchers interested in the origins of life like the idea of a primordial "RNA universe" since the molecule can perform two different functions that are essential for life. It's made up of four chemical letters, just like DNA, and can carry genetic information. RNA, like proteins, can catalyze chemical reactions that are necessary for life.
However, RNA can cause headaches. No one has yet discovered a set of plausible primordial conditions that would cause hundreds of RNA letters—each of which is a complicated molecule—to join together into strands long enough to support the intricate chemistry required to kick-start evolution.
Basaltic glasses may have played a role, according to Stephen Mojzsis, a geologist at the University of Colorado, Boulder. They're high in metals like magnesium and iron, which help to trigger a variety of chemical reactions. "Basaltic glass was omnipresent on Earth at the time," he adds.
He provided the Foundation for Applied Molecular Evolution samples of five different basalt glasses. Each sample was ground into a fine powder, sanitized, and combined with a solution of nucleoside triphosphates by molecular biologist Elisa Biondi and her colleagues. The RNA letters were unable to link up without the presence of glass powder. However, when the molecules were mixed with the glass particles, they formed long strands of hundreds of letters, according to the researchers, who published their findings in Astrobiology this week. There was no need for heat or light. Biondi explains, "All we had to do was wait." After only a day, little RNA strands produced, yet the strands continued to grow for months. Jan Paek, a molecular biologist at Firebird Biomolecular Sciences, says, "The beauty of this approach is its simplicity." "Mix the components together, wait a few days, and look for RNA."
Nonetheless, the findings pose a slew of problems. One of the questions is how nucleoside triphosphates came to be in the first place. Recent study by Biondi's colleague Steven Benner suggests that the same basaltic glasses may have aided in the creation and stabilization of individual RNA letters.
The form of the lengthy RNA strands, according to Szostak, is a significant challenge. Enzymes in modern cells ensure that most RNAs form long linear chains. RNA letters, on the other hand, can bind in complicated branching sequences. Szostak wants the researchers to reveal what kind of RNA was produced by the basaltic glasses. "It irritates me that the authors made an intriguing initial finding but then chose to follow the hype rather than the research," Szostak says.
Biondi acknowledges that her team's experiment almost probably results in some RNA branching. She does acknowledge, however, that some branched RNAs are seen in species today, and that analogous structures may have existed before the origin of life. Other studies carried out by the study also confirmed the presence of lengthy strands with connections, indicating that they are most likely linear. "It's a healthy argument," says Dieter Braun, a Ludwig Maximilian University origin-of-life chemist. "It will set off the next series of tests."

Laura Sanders
3 years ago
Xenobots, tiny living machines, can duplicate themselves.
Strange and complex behavior of frog cell blobs
A xenobot “parent,” shaped like a hungry Pac-Man (shown in red false color), created an “offspring” xenobot (green sphere) by gathering loose frog cells in its opening.
Tiny “living machines” made of frog cells can make copies of themselves. This newly discovered renewal mechanism may help create self-renewing biological machines.
According to Kirstin Petersen, an electrical and computer engineer at Cornell University who studies groups of robots, “this is an extremely exciting breakthrough.” She says self-replicating robots are a big step toward human-free systems.
Researchers described the behavior of xenobots earlier this year (SN: 3/31/21). Small clumps of skin stem cells from frog embryos knitted themselves into small spheres and started moving. Cilia, or cellular extensions, powered the xenobots around their lab dishes.
The findings are published in the Proceedings of the National Academy of Sciences on Dec. 7. The xenobots can gather loose frog cells into spheres, which then form xenobots.
The researchers call this type of movement-induced reproduction kinematic self-replication. The study's coauthor, Douglas Blackiston of Tufts University in Medford, Massachusetts, and Harvard University, says this is typical. For example, sexual reproduction requires parental sperm and egg cells. Sometimes cells split or budded off from a parent.
“This is unique,” Blackiston says. These xenobots “find loose parts in the environment and cobble them together.” This second generation of xenobots can move like their parents, Blackiston says.
The researchers discovered that spheroid xenobots could only produce one more generation before dying out. The original xenobots' shape was predicted by an artificial intelligence program, allowing for four generations of replication.
A C shape, like an openmouthed Pac-Man, was predicted to be a more efficient progenitor. When improved xenobots were let loose in a dish, they began scooping up loose cells into their gaping “mouths,” forming more sphere-shaped bots (see image below). As many as 50 cells clumped together in the opening of a parent to form a mobile offspring. A xenobot is made up of 4,000–6,000 frog cells.
Petersen likes the Xenobots' small size. “The fact that they were able to do this at such a small scale just makes it even better,” she says. Miniature xenobots could sculpt tissues for implantation or deliver therapeutics inside the body.
Beyond the xenobots' potential jobs, the research advances an important science, says study coauthor and Tufts developmental biologist Michael Levin. The science of anticipating and controlling the outcomes of complex systems, he says.
“No one could have predicted this,” Levin says. “They regularly surprise us.” Researchers can use xenobots to test the unexpected. “This is about advancing the science of being less surprised,” Levin says.
Jack Burns
3 years ago
Here's what to expect from NASA Artemis 1 and why it's significant.
NASA's Artemis 1 mission will help return people to the Moon after a half-century break. The mission is a shakedown cruise for NASA's Space Launch System and Orion Crew Capsule.
The spaceship will visit the Moon, deploy satellites, and enter orbit. NASA wants to practice operating the spacecraft, test the conditions people will face on the Moon, and ensure a safe return to Earth.
We asked Jack Burns, a space scientist at the University of Colorado Boulder and former member of NASA's Presidential Transition Team, to describe the mission, explain what the Artemis program promises for space exploration, and reflect on how the space program has changed in the half-century since humans last set foot on the moon.
What distinguishes Artemis 1 from other rockets?
Artemis 1 is the Space Launch System's first launch. NASA calls this a "heavy-lift" vehicle. It will be more powerful than Apollo's Saturn V, which transported people to the Moon in the 1960s and 1970s.
It's a new sort of rocket system with two strap-on solid rocket boosters from the space shuttle. It's a mix of the shuttle and Saturn V.
The Orion Crew Capsule will be tested extensively. It'll spend a month in the high-radiation Moon environment. It will also test the heat shield, which protects the capsule and its occupants at 25,000 mph. The heat shield must work well because this is the fastest capsule descent since Apollo.
This mission will also carry miniature Moon-orbiting satellites. These will undertake vital precursor science, including as examining further into permanently shadowed craters where scientists suspect there is water and measuring the radiation environment to see long-term human consequences.
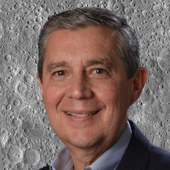
Artemis 1 will launch, fly to the Moon, place satellites, orbit it, return to Earth, and splash down in the ocean. NASA.
What's Artemis's goal? What launches are next?
The mission is a first step toward Artemis 3, which will lead to the first human Moon missions since 1972. Artemis 1 is unmanned.
Artemis 2 will have astronauts a few years later. Like Apollo 8, it will be an orbital mission that circles the Moon and returns. The astronauts will orbit the Moon longer and test everything with a crew.
Eventually, Artemis 3 will meet with the SpaceX Starship on the Moon's surface and transfer people. Orion will stay in orbit while the lunar Starship lands astronauts. They'll go to the Moon's south pole to investigate the water ice there.
Artemis is reminiscent of Apollo. What's changed in 50 years?
Kennedy wanted to beat the Soviets to the Moon with Apollo. The administration didn't care much about space flight or the Moon, but the goal would place America first in space and technology.
You live and die by the sword if you do that. When the U.S. reached the Moon, it was over. Russia lost. We planted flags and did science experiments. Richard Nixon canceled the program after Apollo 11 because the political goals were attained.
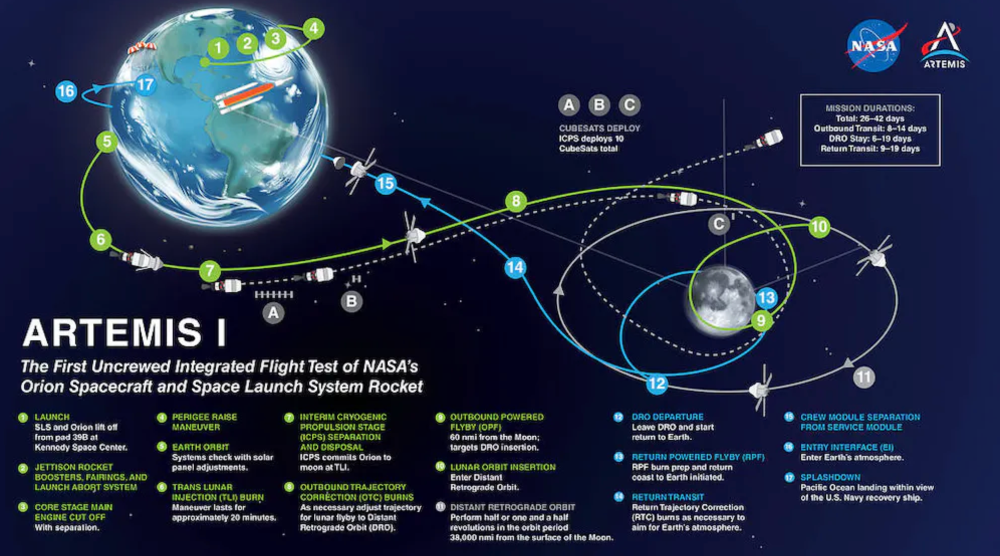
Large rocket with two boosters between two gates
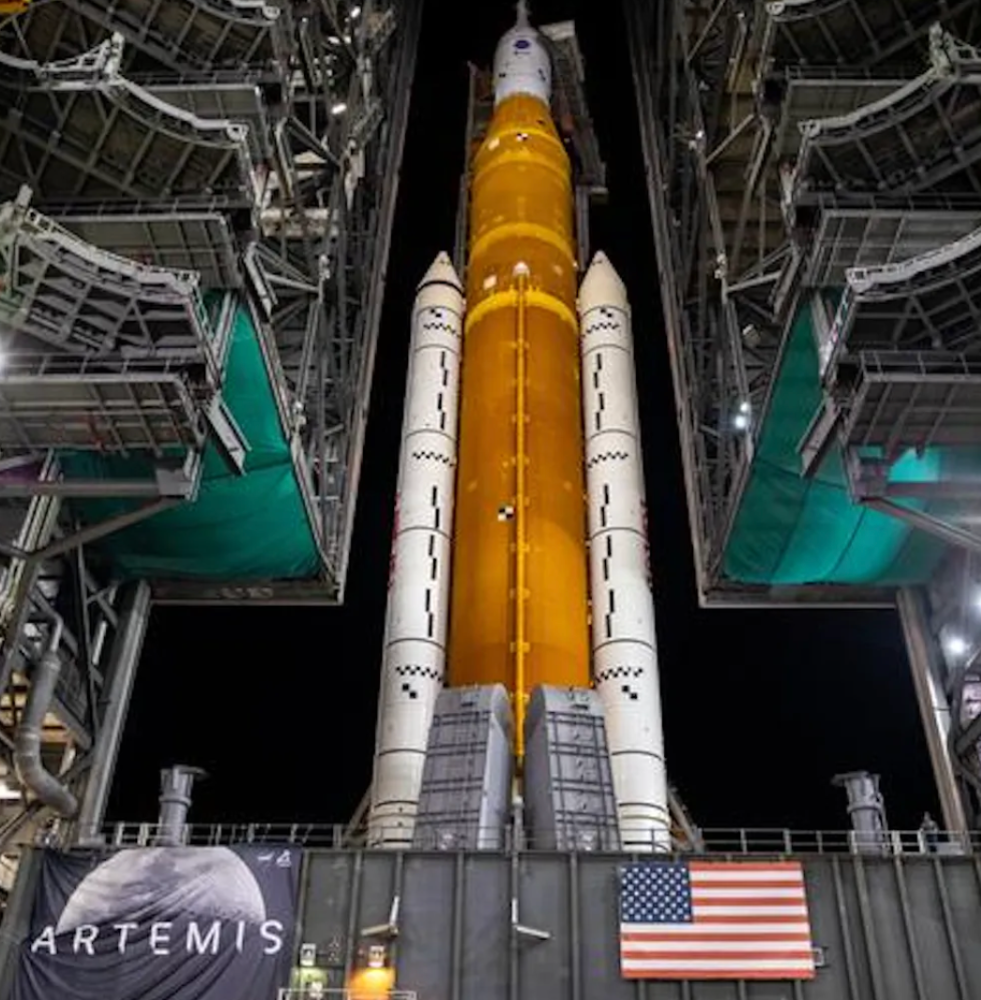
NASA's new Space Launch System is brought to a launchpad. NASA
50 years later... It's quite different. We're not trying to beat the Russians, Chinese, or anyone else, but to begin sustainable space exploration.
Artemis has many goals. It includes harnessing in-situ resources like water ice and lunar soil to make food, fuel, and building materials.
SpaceX is part of this first journey to the Moon's surface, therefore the initiative is also helping to develop a lunar and space economy. NASA doesn't own the Starship but is buying seats for astronauts. SpaceX will employ Starship to transport cargo, private astronauts, and foreign astronauts.
Fifty years of technology advancement has made getting to the Moon cheaper and more practical, and computer technology allows for more advanced tests. 50 years of technological progress have changed everything. Anyone with enough money can send a spacecraft to the Moon, but not humans.
Commercial Lunar Payload Services engages commercial companies to develop uncrewed Moon landers. We're sending a radio telescope to the Moon in January. Even 10 years ago, that was impossible.
Since humans last visited the Moon 50 years ago, technology has improved greatly.
What other changes does Artemis have in store?
The government says Artemis 3 will have at least one woman and likely a person of color.
I'm looking forward to seeing more diversity so young kids can say, "Hey, there's an astronaut that looks like me. I can do this. I can be part of the space program.”
You might also like

James White
3 years ago
Ray Dalio suggests reading these three books in 2022.
An inspiring reading list
I'm no billionaire or hedge-fund manager. My bank account doesn't have millions. Ray Dalio's love of reading motivates me to think differently.
Here are some books recommended by Ray Dalio. Each influenced me. Hope they'll help you.
Sapiens by Yuval Noah Harari
Page Count: 512
Rating on Goodreads: 4.39
My favorite nonfiction book.
Sapiens explores human evolution. It explains how Homo Sapiens developed from hunter-gatherers to a dominant species. Amazing!
Sapiens will teach you about human history. Yuval Noah Harari has a follow-up book on human evolution.
My favorite book quotes are:
The tendency for luxuries to turn into necessities and give rise to new obligations is one of history's few unbreakable laws.
Happiness is not dependent on material wealth, physical health, or even community. Instead, it depends on how closely subjective expectations and objective circumstances align.
The romantic comparison between today's industry, which obliterates the environment, and our forefathers, who coexisted well with nature, is unfounded. Homo sapiens held the record among all organisms for eradicating the most plant and animal species even before the Industrial Revolution. The unfortunate distinction of being the most lethal species in the history of life belongs to us.
The Power Of Habit by Charles Duhigg
Page Count: 375
Rating on Goodreads: 4.13
Great book: The Power Of Habit. It illustrates why habits are everything. The book explains how healthier habits can improve your life, career, and society.
The Power of Habit rocks. It's a great book on productivity. Its suggestions helped me build healthier behaviors (and drop bad ones).
Read ASAP!
My favorite book quotes are:
Change may not occur quickly or without difficulty. However, almost any behavior may be changed with enough time and effort.
People who exercise begin to eat better and produce more at work. They are less smokers and are more patient with friends and family. They claim to feel less anxious and use their credit cards less frequently. A fundamental habit that sparks broad change is exercise.
Habits are strong but also delicate. They may develop independently of our awareness or may be purposefully created. They frequently happen without our consent, but they can be altered by changing their constituent pieces. They have a much greater influence on how we live than we realize; in fact, they are so powerful that they cause our brains to adhere to them above all else, including common sense.
Tribe Of Mentors by Tim Ferriss
Page Count: 561
Rating on Goodreads: 4.06
Unusual book structure. It's worth reading if you want to learn from successful people.
The book is Q&A-style. Tim questions everyone. Each chapter features a different person's life-changing advice. In the book, Pressfield, Willink, Grylls, and Ravikant are interviewed.
Amazing!
My favorite book quotes are:
According to one's courage, life can either get smaller or bigger.
Don't engage in actions that you are aware are immoral. The reputation you have with yourself is all that constitutes self-esteem. Always be aware.
People mistakenly believe that focusing means accepting the task at hand. However, that is in no way what it represents. It entails rejecting the numerous other worthwhile suggestions that exist. You must choose wisely. Actually, I'm just as proud of the things we haven't accomplished as I am of what I have. Saying no to 1,000 things is what innovation is.

Percy Bolmér
3 years ago
Ethereum No Longer Consumes A Medium-Sized Country's Electricity To Run
The Merge cut Ethereum's energy use by 99.5%.

The Crypto community celebrated on September 15, 2022. This day, Ethereum Merged. The entire blockchain successfully merged with the Beacon chain, and it was so smooth you barely noticed.
Many have waited, dreaded, and longed for this day.
Some investors feared the network would break down, while others envisioned a seamless merging.
Speculators predict a successful Merge will lead investors to Ethereum. This could boost Ethereum's popularity.
What Has Changed Since The Merge
The merging transitions Ethereum mainnet from PoW to PoS.
PoW sends a mathematical riddle to computers worldwide (miners). First miner to solve puzzle updates blockchain and is rewarded.
The puzzles sent are power-intensive to solve, so mining requires a lot of electricity. It's sent to every miner competing to solve it, requiring duplicate computation.
PoS allows investors to stake their coins to validate a new transaction. Instead of validating a whole block, you validate a transaction and get the fees.
You can validate instead of mine. A validator stakes 32 Ethereum. After staking, the validator can validate future blocks.
Once a validator validates a block, it's sent to a randomly selected group of other validators. This group verifies that a validator is not malicious and doesn't validate fake blocks.
This way, only one computer needs to solve or validate the transaction, instead of all miners. The validated block must be approved by a small group of validators, causing duplicate computation.
PoS is more secure because validating fake blocks results in slashing. You lose your bet tokens. If a validator signs a bad block or double-signs conflicting blocks, their ETH is burned.
Theoretically, Ethereum has one block every 12 seconds, so a validator forging a block risks burning 1 Ethereum for 12 seconds of transactions. This makes mistakes expensive and risky.
What Impact Does This Have On Energy Use?
Cryptocurrency is a natural calamity, sucking electricity and eating away at the earth one transaction at a time.
Many don't know the environmental impact of cryptocurrencies, yet it's tremendous.
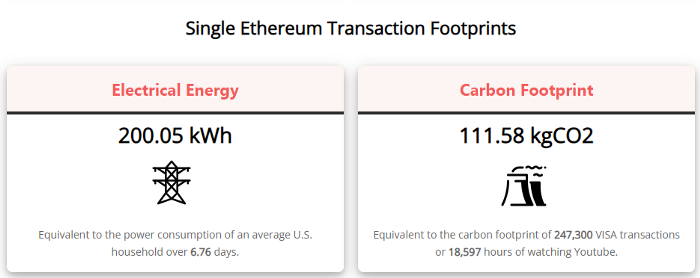
A single Ethereum transaction used to use 200 kWh and leave a large carbon imprint. This update reduces global energy use by 0.2%.
Ethereum will submit a challenge to one validator, and that validator will forward it to randomly selected other validators who accept it.
This reduces the needed computing power.
They expect a 99.5% reduction, therefore a single transaction should cost 1 kWh.
Carbon footprint is 0.58 kgCO2, or 1,235 VISA transactions.
This is a big Ethereum blockchain update.
I love cryptocurrency and Mother Earth.

Sam Hickmann
3 years ago
Nomad.xyz got exploited for $190M
Key Takeaways:
Another hack. This time was different. This is a doozy.
Why? Nomad got exploited for $190m. It was crypto's 5th-biggest hack. Ouch.
It wasn't hackers, but random folks. What happened:
A Nomad smart contract flaw was discovered. They couldn't drain the funds at once, so they tried numerous transactions. Rookie!
People noticed and copied the attack.
They just needed to discover a working transaction, substitute the other person's address with theirs, and run it.

In a two-and-a-half-hour attack, $190M was siphoned from Nomad Bridge.
Nomad is a novel approach to blockchain interoperability that leverages an optimistic mechanism to increase the security of cross-chain communication. — nomad.xyz
This hack was permissionless, therefore anyone could participate.
After the fatal blow, people fought over the scraps.
Cross-chain bridges remain a DeFi weakness and exploit target. When they collapse, it's typically total.
$190M...gobbled.

Unbacked assets are hurting Nomad-dependent chains. Moonbeam, EVMOS, and Milkomeda's TVLs dropped.
This incident is every-man-for-himself, although numerous whitehats exploited the issue...
But what triggered the feeding frenzy?
How did so many pick the bones?
After a normal upgrade in June, the bridge's Replica contract was initialized with a severe security issue. The 0x00 address was a trusted root, therefore all messages were valid by default.
After a botched first attempt (costing $350k in gas), the original attacker's exploit tx called process() without first 'proving' its validity.
The process() function executes all cross-chain messages and checks the merkle root of all messages (line 185).
The upgrade caused transactions with a'messages' value of 0 (invalid, according to old logic) to be read by default as 0x00, a trusted root, passing validation as 'proven'
Any process() calls were valid. In reality, a more sophisticated exploiter may have designed a contract to drain the whole bridge.
Copycat attackers simply copied/pasted the same process() function call using Etherscan, substituting their address.
The incident was a wild combination of crowdhacking, whitehat activities, and MEV-bot (Maximal Extractable Value) mayhem.
For example, 🍉🍉🍉. eth stole $4M from the bridge, but claims to be whitehat.

Others stood out for the wrong reasons. Repeat criminal Rari Capital (Artibrum) exploited over $3M in stablecoins, which moved to Tornado Cash.
The top three exploiters (with 95M between them) are:
$47M: 0x56D8B635A7C88Fd1104D23d632AF40c1C3Aac4e3
$40M: 0xBF293D5138a2a1BA407B43672643434C43827179
$8M: 0xB5C55f76f90Cc528B2609109Ca14d8d84593590E
Here's a list of all the exploiters:
The project conducted a Quantstamp audit in June; QSP-19 foreshadowed a similar problem.
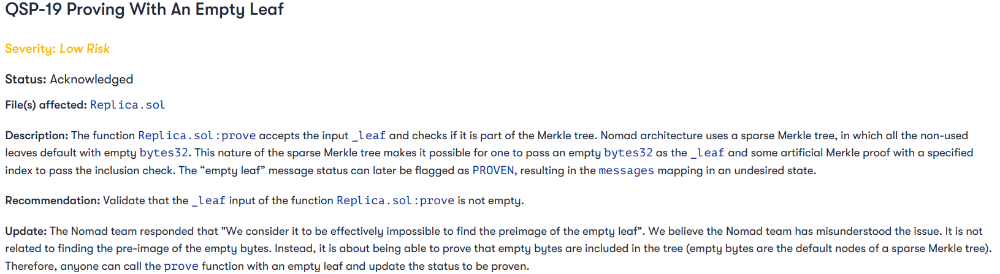
The auditor's comments that "We feel the Nomad team misinterpreted the issue" speak to a troubling attitude towards security that the project's "Long-Term Security" plan appears to confirm:

Concerns were raised about the team's response time to a live, public exploit; the team's official acknowledgement came three hours later.
"Removing the Replica contract as owner" stopped the exploit, but it was too late to preserve the cash.
Closed blockchain systems are only as strong as their weakest link.
The Harmony network is in turmoil after its bridge was attacked and lost $100M in late June.
What's next for Nomad's ecosystems?
Moonbeam's TVL is now $135M, EVMOS's is $3M, and Milkomeda's is $20M.
Loss of confidence may do more damage than $190M.
Cross-chain infrastructure is difficult to secure in a new, experimental sector. Bridge attacks can pollute an entire ecosystem or more.
Nomadic liquidity has no permanent home, so consumers will always migrate in pursuit of the "next big thing" and get stung when attentiveness wanes.
DeFi still has easy prey...
Sources: rekt.news & The Milk Road.