


More on Society & Culture

Kyle Planck
3 years ago
The chronicles of monkeypox.
or, how I spread monkeypox and got it myself.
This story contains nsfw (not safe for wife) stuff and shouldn't be read if you're under 18 or think I'm a newborn angel. After the opening, it's broken into three sections: a chronological explanation of my disease course, my ideas, and what I plan to do next.
Your journey awaits.
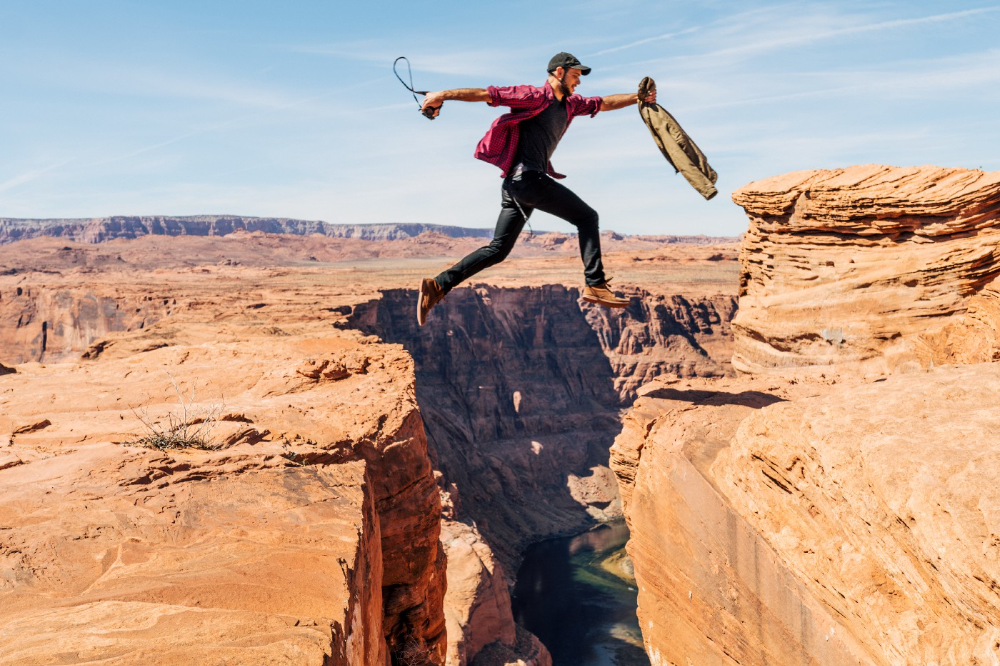
As early as mid-may, I was waltzing around the lab talking about monkeypox, a rare tropical disease with an inaccurate name. Monkeys are not its primary animal reservoir. It caused an outbreak among men who have sex with men across Europe, with unprecedented levels of person-to-person transmission. European health authorities speculated that the virus spread at raves and parties and was easily transferred through intimate, mainly sexual, contact. I had already read the nejm article about the first confirmed monkeypox patient in the u.s. and shared the photos on social media so people knew what to look for. The cdc information page only included 4 photographs of monkeypox lesions that looked like they were captured on a motorola razr.
I warned my ex-boyfriend about monkeypox. Monkeypox? responded.
Mom, I'm afraid about monkeypox. What's monkeypox?
My therapist is scared about monkeypox. What's monkeypox?
Was I alone? A few science gays on Twitter didn't make me feel overreacting.
This information got my gay head turning. The incubation period for the sickness is weeks. Many of my social media contacts are traveling to Europe this summer. What is pride? Travel, parties, and sex. Many people may become infected before attending these activities. Monkeypox will affect the lgbtq+ community.
Being right always stinks. My young scientist brain was right, though. Someone who saw this coming is one of the early victims. I'll talk about my feelings publicly, and trust me, I have many concerning what's occurring.
Part 1 is the specifics.
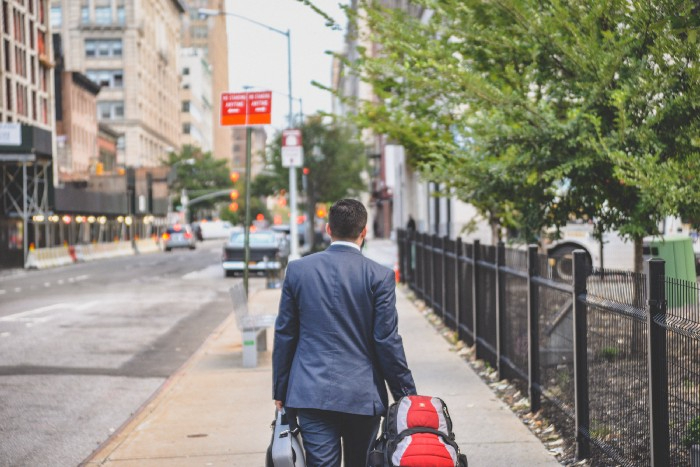
Wednesday nights are never smart but always entertaining. I didn't wake up until noon on june 23 and saw gay twitter blazing. Without warning, the nyc department of health announced a pop-up monkeypox immunization station in chelsea. Some days would be 11am-7pm. Walk-ins were welcome, however appointments were preferred. I tried to arrange an appointment after rubbing my eyes, but they were all taken. I got out of bed, washed my face, brushed my teeth, and put on short shorts because I wanted to get a walk-in dose and show off my legs. I got a 20-oz. cold brew on the way to the train and texted a chelsea-based acquaintance for help.
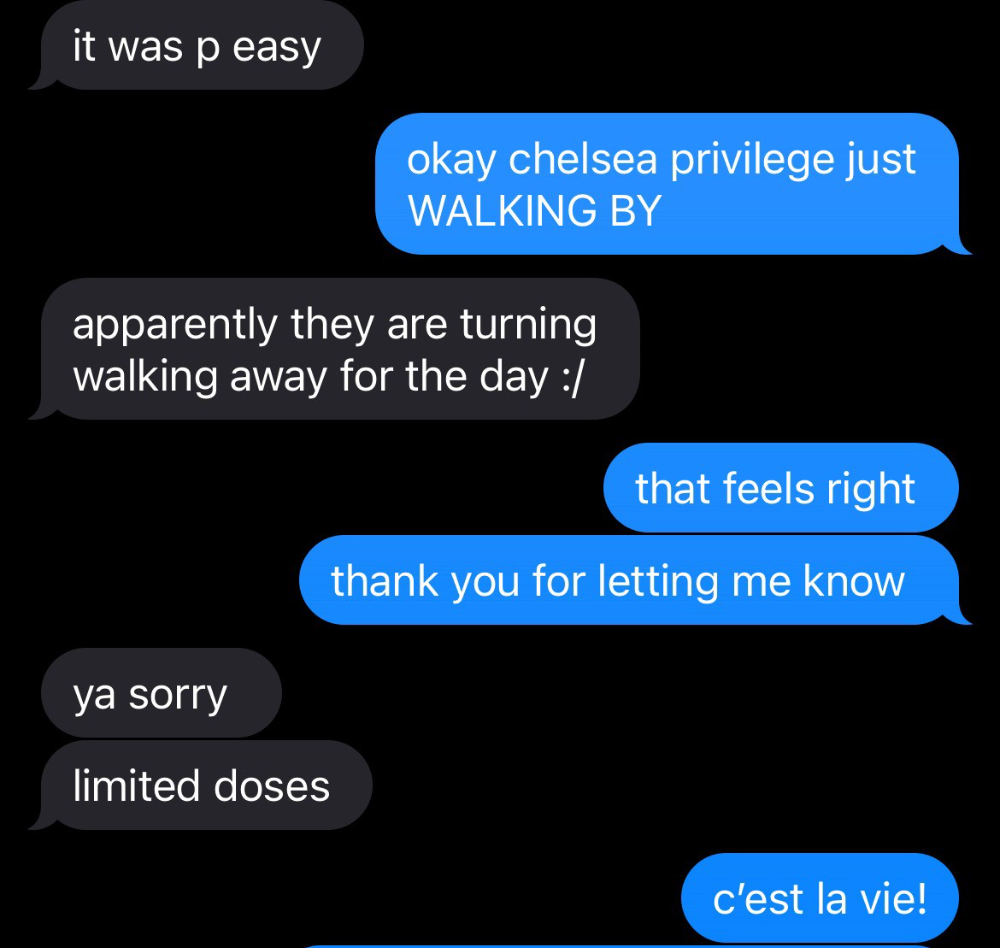
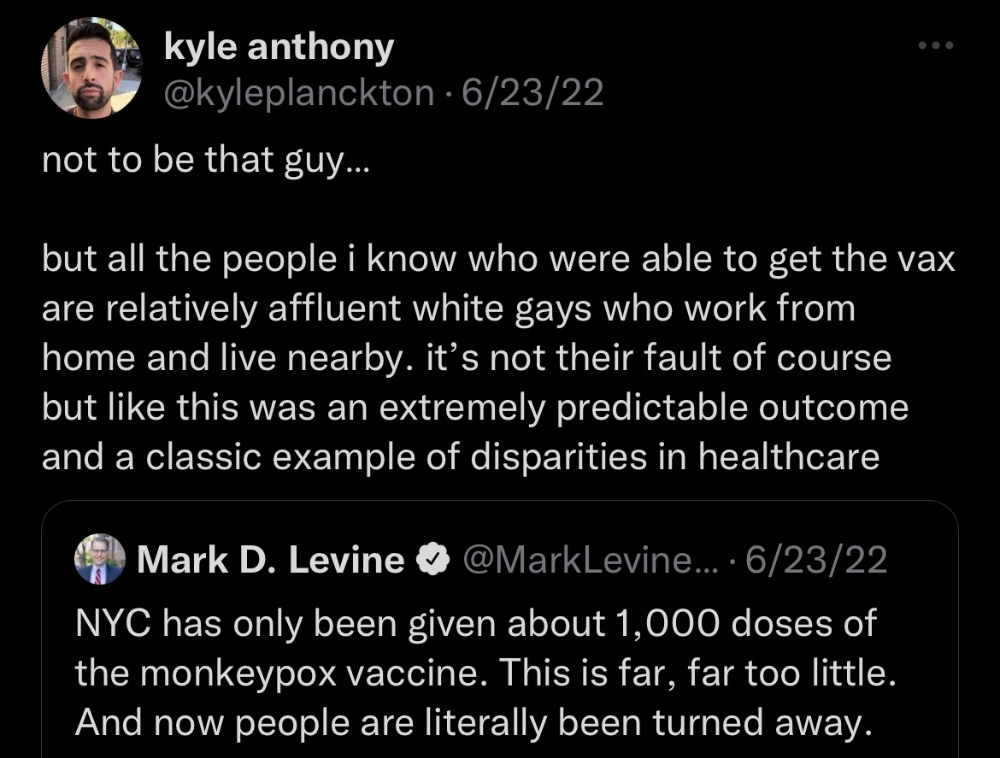
Clinic closed at 2pm. No more doses. Hundreds queued up. The government initially gave them only 1,000 dosages. For a city with 500,000 LGBT people, c'mon. What more could I do? I was upset by how things were handled. The evidence speaks for itself.
I decided to seek an appointment when additional doses were available and continued my weekend. I was celebrating nyc pride with pals. Fun! sex! *
On tuesday after that, I felt a little burn. This wasn't surprising because I'd been sexually active throughout the weekend, so I got a sti panel the next day. I expected to get results in a few days, take antibiotics, and move on.
Emerging germs had other intentions. Wednesday night, I felt sore, and thursday morning, I had a blazing temperature and had sweat through my bedding. I had fever, chills, and body-wide aches and pains for three days. I reached 102 degrees. I believed I had covid over pride weekend, but I tested negative for three days straight.
STDs don't induce fevers or other systemic symptoms. If lymphogranuloma venereum advances, it can cause flu-like symptoms and swollen lymph nodes. I was suspicious and desperate for answers, so I researched monkeypox on the cdc website (for healthcare professionals). Much of what I saw on screen about monkeypox prodrome matched my symptoms. Multiple-day fever, headache, muscle aches, chills, tiredness, enlarged lymph nodes. Pox were lacking.
I told my doctor my concerns pre-medically. I'm occasionally annoying.
On saturday night, my fever broke and I felt better. Still burning, I was optimistic till sunday, when I woke up with five red splotches on my arms and fingertips.
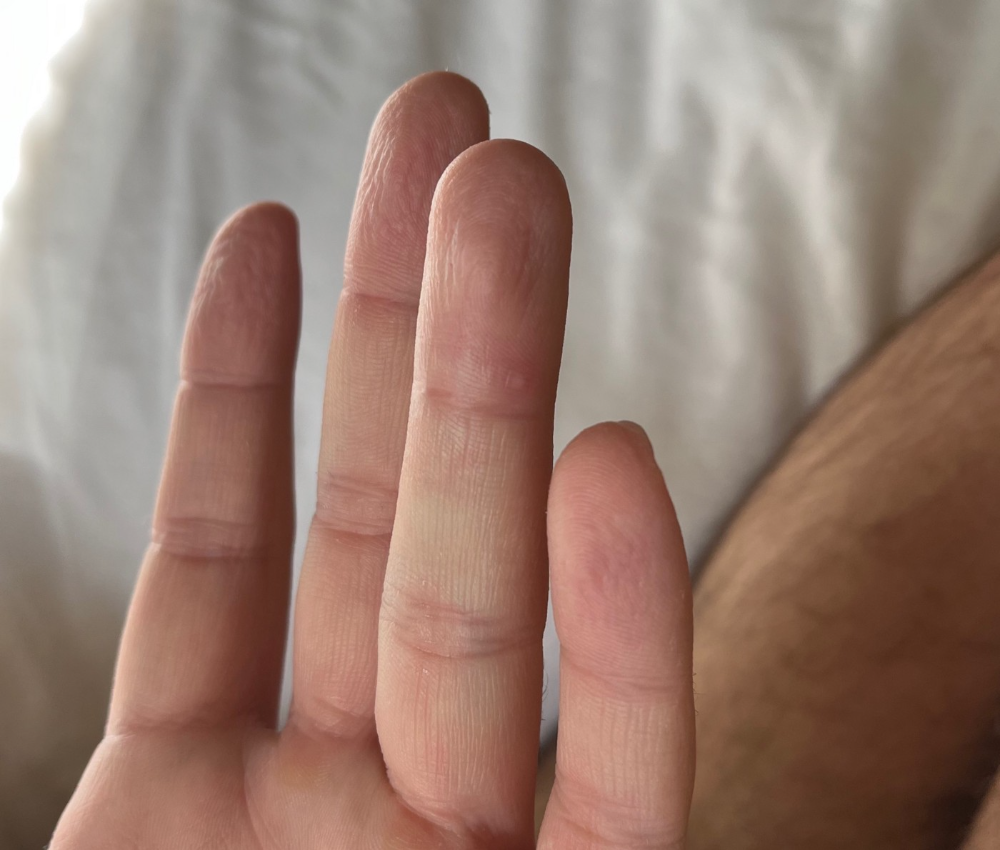
As spots formed, burning became pain. I observed as spots developed on my body throughout the day. I had more than a dozen by the end of the day, and the early spots were pustular. I had monkeypox, as feared.
Fourth of July weekend limited my options. I'm well-connected in my school's infectious disease academic community, so I texted a coworker for advice. He agreed it was likely monkeypox and scheduled me for testing on tuesday.
nyc health could only perform 10 monkeypox tests every day. Before doctors could take swabs and send them in, each test had to be approved by the department. Some commercial labs can now perform monkeypox testing, but the backlog is huge. I still don't have a positive orthopoxvirus test five days after my test. *My 12-day-old case may not be included in the official monkeypox tally. This outbreak is far wider than we first thought, therefore I'm attempting to spread the information and help contain it.
*Update, 7/11: I have orthopoxvirus.
I spent all day in the bathtub because of the agony. Warm lavender epsom salts helped me feel better. I can't stand lavender anymore. I brought my laptop into the bathroom and viewed everything everywhere at once (2022). If my ex and I hadn't recently broken up, I wouldn't have monkeypox. All of these things made me cry, and I sat in the bathtub on the 4th of July sobbing. I thought, Is this it? I felt like Bridesmaids' Kristen Wiig (2011). I'm a flop. From here, things can only improve.
Later that night, I wore a mask and went to my roof to see the fireworks. Even though I don't like fireworks, there was something wonderful about them this year: the colors, how they illuminated the black surfaces around me, and their transient beauty. Joyful moments rarely linger long in our life. We must enjoy them now.

Several roofs away, my neighbors gathered. Happy 4th! I heard a woman yell. Why is this godforsaken country so happy? Instead of being rude, I replied. I didn't tell them I had monkeypox. I thought that would kill the mood.
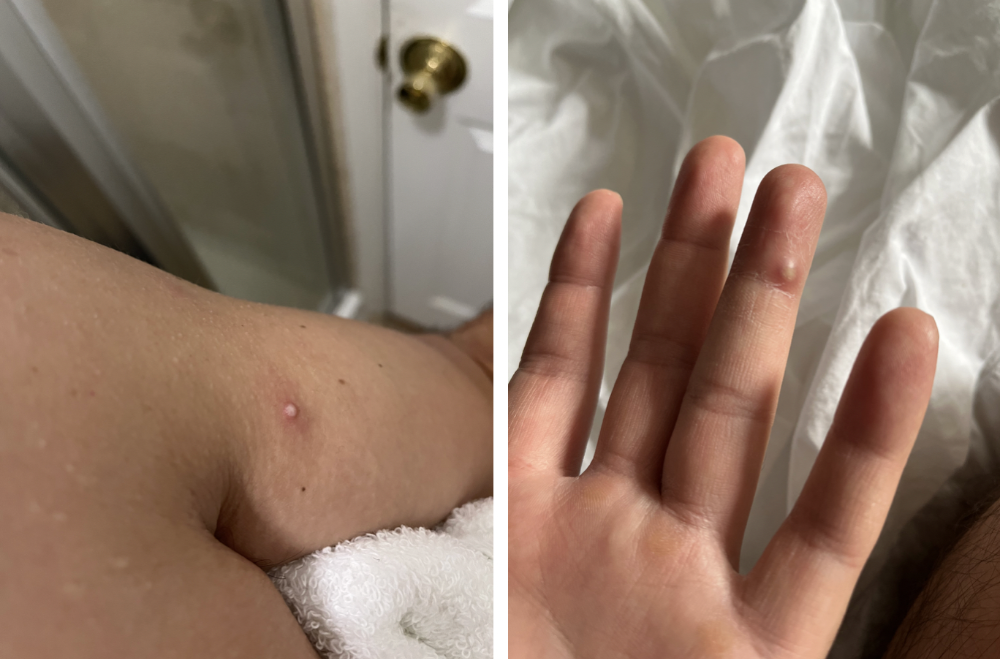
By the time I went to the hospital the next day to get my lesions swabbed, wearing long sleeves, pants, and a mask, they looked like this:
I had 30 lesions on my arms, hands, stomach, back, legs, buttcheeks, face, scalp, and right eyebrow. I had some in my mouth, gums, and throat. Current medical thought is that lesions on mucous membranes cause discomfort in sensitive places. Internal lesions are a new feature of this outbreak of monkeypox. Despite being unattractive, the other sores weren't unpleasant or bothersome.
I had a bacterial sti with the pox. Who knows if that would've created symptoms (often it doesn't), but different infections can happen at once. My care team remembered that having a sti doesn't exclude out monkeypox. doxycycline rocks!
The coworker who introduced me to testing also offered me his home. We share a restroom, and monkeypox can be spread through surfaces. (Being a dna virus gives it environmental hardiness that rna viruses like sars-cov-2 lack.) I disinfected our bathroom after every usage, but I was apprehensive. My friend's place has a guest room and second bathroom, so no cross-contamination. It was the ideal monkeypox isolation environment, so I accepted his offer and am writing this piece there. I don't know what I would have done without his hospitality and attention.
The next day, I started tecovirimat, or tpoxx, for 14 days. Smallpox has been eradicated worldwide since the 1980s but remains a bioterrorism concern. Tecovirimat has a unique, orthopoxvirus-specific method of action, which reduces side effects to headache and nausea. It hasn't been used in many people, therefore the cdc is encouraging patients who take it for monkeypox to track their disease and symptoms.

Tpoxx's oral absorption requires a fatty meal. The hospital ordered me to take the medication after a 600-calorie, 25-gram-fat meal every 12 hours. The coordinator joked, "Don't diet for the next two weeks." I wanted to get peanut butter delivered, but jif is recalling their supply due to salmonella. Please give pathogens a break. I got almond butter.
Tpoxx study enrollment was documented. After signing consent documents, my lesions were photographed and measured during a complete physical exam. I got bloodwork to assess my health. My medication delivery was precise; every step must be accounted for. I got a two-week supply and started taking it that night. I rewarded myself with McDonald's. I'd been hungry for a week. I was also prescribed ketorolac (aka toradol), a stronger ibuprofen, for my discomfort.
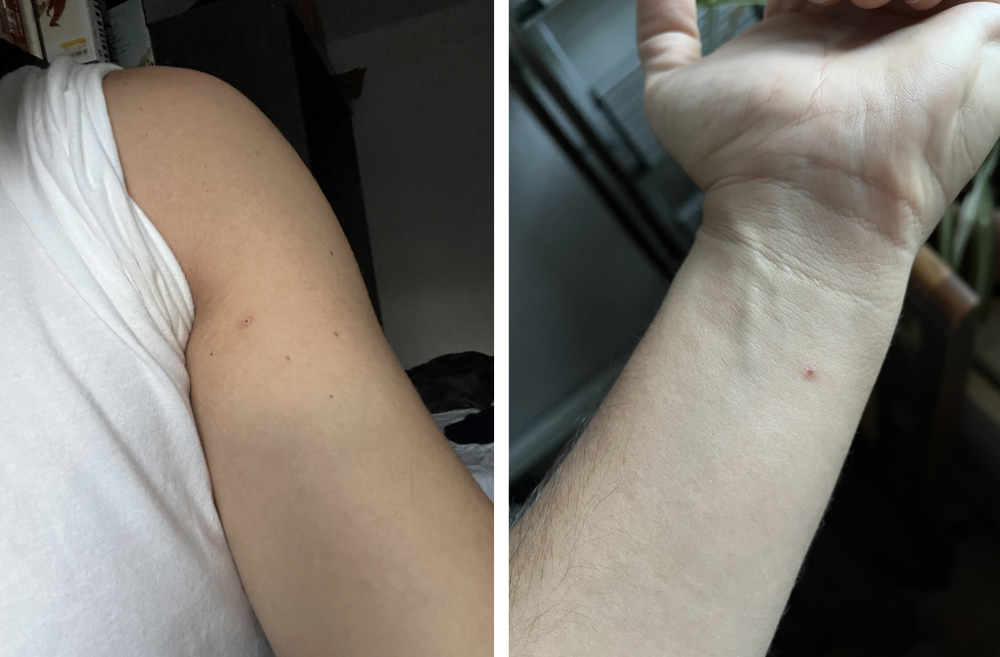
I thought tpoxx was a wonder medicine by day two of treatment. Early lesions looked like this.
however, They vanished. The three largest lesions on my back flattened and practically disappeared into my skin. Some pustular lesions were diminishing. Tpoxx+toradol has helped me sleep, focus, and feel human again. I'm down to twice-daily baths and feeling hungrier than ever in this illness. On day five of tpoxx, some of the lesions look like this:
I have a ways to go. We must believe I'll be contagious until the last of my patches scabs over, falls off, and sprouts new skin. There's no way to tell. After a week and a half of tremendous pain and psychological stress, any news is good news. I'm grateful for my slow but steady development.
Part 2 of the rant.
Being close to yet not in the medical world is interesting. It lets me know a lot about it without being persuaded by my involvement. Doctors identify and treat patients using a tool called differential diagnosis.
A doctor interviews a patient to learn about them and their symptoms. More is better. Doctors may ask, "Have you traveled recently?" sex life? Have pets? preferred streaming service? (No, really. (Hbomax is right.) After the inquisition, the doctor will complete a body exam ranging from looking in your eyes, ears, and throat to a thorough physical.
After collecting data, the doctor makes a mental (or physical) inventory of all the conceivable illnesses that could cause or explain the patient's symptoms. Differential diagnosis list. After establishing the differential, the clinician can eliminate options. The doctor will usually conduct nucleic acid tests on swab samples or bloodwork to learn more. This helps eliminate conditions from the differential or boosts a condition's likelihood. In an ideal circumstance, the doctor can eliminate all but one reason of your symptoms, leaving your formal diagnosis. Once diagnosed, treatment can begin. yay! Love medicine.
My symptoms two weeks ago did not suggest monkeypox. Fever, pains, weariness, and swollen lymph nodes are caused by several things. My scandalous symptoms weren't linked to common ones. My instance shows the importance of diversity and representation in healthcare. My doctor isn't gay, but he provides culturally sensitive care. I'd heard about monkeypox as a gay man in New York. I was hyper-aware of it and had heard of friends of friends who had contracted it the week before, even though the official case count in the US was 40. My physicians weren't concerned, but I was. How would it appear on his mental differential if it wasn't on his radar? Mental differential rhymes! I'll trademark it to prevent theft. differential!
I was in a rare position to recognize my condition and advocate for myself. I study infections. I'd spent months researching monkeypox. I work at a university where I rub shoulders with some of the country's greatest doctors. I'm a gay dude who follows nyc queer social networks online. All of these variables positioned me to think, "Maybe this is monkeypox," and to explain why.
This outbreak is another example of privilege at work. The brokenness of our healthcare system is once again exposed by the inequities produced by the vaccination rollout and the existence of people like myself who can pull strings owing to their line of work. I can't cure this situation on my own, but I can be a strong voice demanding the government do a better job addressing the outbreak and giving resources and advice to everyone I can.
lgbtqia+ community members' support has always impressed me in new york. The queer community has watched out for me and supported me in ways I never dreamed were possible.
Queer individuals are there for each other when societal structures fail. People went to the internet on the first day of the vaccine rollout to share appointment information and the vaccine clinic's message. Twitter timelines were more effective than marketing campaigns. Contrary to widespread anti-vaccine sentiment, the LGBT community was eager to protect themselves. Smallpox vaccination? sure. gimme. whether I'm safe. I credit the community's sex positivity. Many people are used to talking about STDs, so there's a reduced barrier to saying, "I think I have something, you should be on the watch too," and taking steps to protect our health.
Once I got monkeypox, I posted on Twitter and Instagram. Besides fueling my main character syndrome, I felt like I wasn't alone. My dc-based friend had monkeypox within hours. He told me about his experience and gave me ideas for managing the discomfort. I can't imagine life without him.
My buddy and colleague organized my medical care and let me remain in his home. His and his husband's friendliness and attention made a world of difference in my recovery. All of my friends and family who helped me, whether by venmo, doordash, or moral support, made me feel cared about. I don't deserve the amazing people in my life.
Finally, I think of everyone who commented on my social media posts regarding my trip. Friends from all sectors of my life and all sexualities have written me well wishes and complimented me for my vulnerability, but I feel the most gravitas from fellow lgbtq+ persons. They're learning to spot. They're learning where to go ill. They're learning self-advocacy. I'm another link in our network of caretaking. I've been cared for, therefore I want to do the same. Community and knowledge are powerful.
You're probably wondering where the diatribe is. You may believe he's gushing about his loved ones, and you'd be right. I say that just because the queer community can take care of itself doesn't mean we should.
Even when caused by the same pathogen, comparing health crises is risky. Aids is unlike covid-19 or monkeypox, yet all were caused by poorly understood viruses. The lgbtq+ community has a history of self-medicating. Queer people (and their supporters) have led the charge to protect themselves throughout history when the government refused. Surreal to experience this in real time.
First, vaccination access is a government failure. The strategic national stockpile contains tens of thousands of doses of jynneos, the newest fda-approved smallpox vaccine, and millions of doses of acam2000, an older vaccine for immunocompetent populations. Despite being a monkeypox hotspot and international crossroads, new york has only received 7,000 doses of the jynneos vaccine. Vaccine appointments are booked within minutes. It's showing Hunger Games, which bothers me.
Second, I think the government failed to recognize the severity of the european monkeypox outbreak. We saw abroad reports in may, but the first vaccines weren't available until june. Why was I a 26-year-old pharmacology grad student, able to see a monkeypox problem in europe but not the u.s. public health agency? Or was there too much bureaucracy and politicking, delaying action?
Lack of testing infrastructure for a known virus with vaccinations and therapies is appalling. More testing would have helped understand the problem's breadth. Many homosexual guys, including myself, didn't behave like monkeypox was a significant threat because there were only a dozen instances across the country. Our underestimating of the issue, spurred by a story of few infections, was huge.
Public health officials' response to infectious diseases frustrates me. A wait-and-see approach to infectious diseases is unsatisfactory. Before a sick person is recognized, they've exposed and maybe contaminated numerous others. Vaccinating susceptible populations before a disease becomes entrenched prevents disease. CDC might operate this way. When it was easier, they didn't control or prevent monkeypox. We'll learn when. Sometimes I fear never. Emerging viral infections are a menace in the era of climate change and globalization, and I fear our government will repeat the same mistakes. I don't work at the cdc, thus I have no idea what they do. As a scientist, a homosexual guy, and a citizen of this country, I feel confident declaring that the cdc has not done enough about monkeypox. Will they do enough about monkeypox? The strategic national stockpile can respond to a bioterrorism disaster in 12 hours. I'm skeptical following this outbreak.
It's simple to criticize the cdc, but they're not to blame. Underfunding public health services, especially the cdc, is another way our government fails to safeguard its citizens. I may gripe about the vaccination rollout all I want, but local health departments are doing their best with limited resources. They may not have enough workers to keep up with demand and run a contact-tracing program. Since my orthopoxvirus test is still negative, the doh hasn't asked about my close contacts. By then, my illness will be two weeks old, too long to do anything productive. Not their fault. They're functioning in a broken system that's underfunded for the work it does.
*Update, 7/11: I have orthopoxvirus.
Monkeypox is slow, so i've had time to contemplate. Now that I'm better, I'm angry. furious and sad I want to help. I wish to spare others my pain. This was preventable and solvable, I hope. HOW?
Third, the duty.
Family, especially selected family, helps each other. So many people have helped me throughout this difficult time. How can I give back? I have ideas.
1. Education. I've already started doing this by writing incredibly detailed posts on Instagram about my physical sickness and my thoughts on the entire scandal. via tweets. by producing this essay. I'll keep doing it even if people start to resent me! It's crucial! On my Instagram profile (@kyleplanckton), you may discover a story highlight with links to all of my bizarre yet educational posts.
2. Resources. I've forwarded the contact information for my institution's infectious diseases clinic to several folks who will hopefully be able to get tpoxx under the expanded use policy. Through my social networks, I've learned of similar institutions. I've also shared crowdsourced resources about symptom relief and vaccine appointment availability on social media. DM me or see my Instagram highlight for more.
3. Community action. During my illness, my friends' willingness to aid me has meant the most. It was nice to know I had folks on my side. One of my pals (thanks, kenny) snagged me a mcgriddle this morning when seamless canceled my order. This scenario has me thinking about methods to help people with monkeypox isolation. A two-week isolation period is financially damaging for many hourly workers. Certain governments required paid sick leave for covid-19 to allow employees to recover and prevent spread. No comparable program exists for monkeypox, and none seems to be planned shortly.
I want to aid monkeypox patients in severe financial conditions. I'm willing to pick up and bring groceries or fund meals/expenses for sick neighbors. I've seen several GoFundMe accounts, but I wish there was a centralized mechanism to link those in need with those who can help. Please contact me if you have expertise with mutual aid organizations. I hope we can start this shortly.
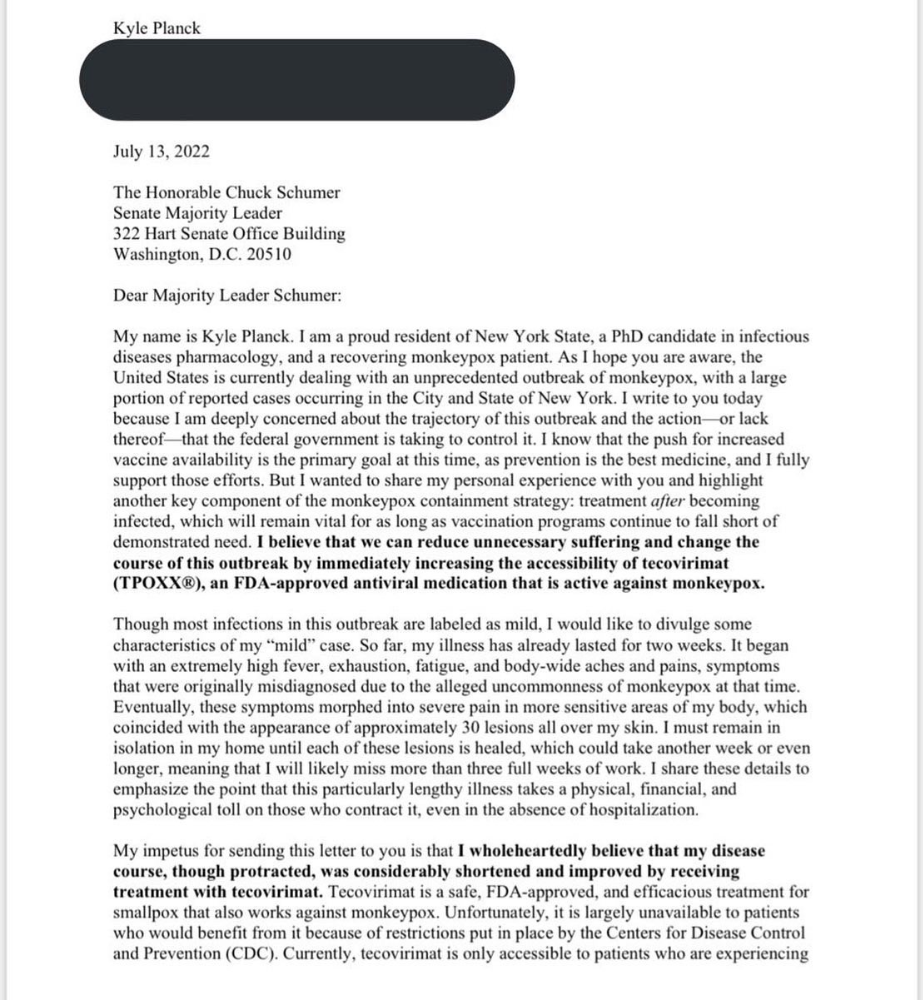
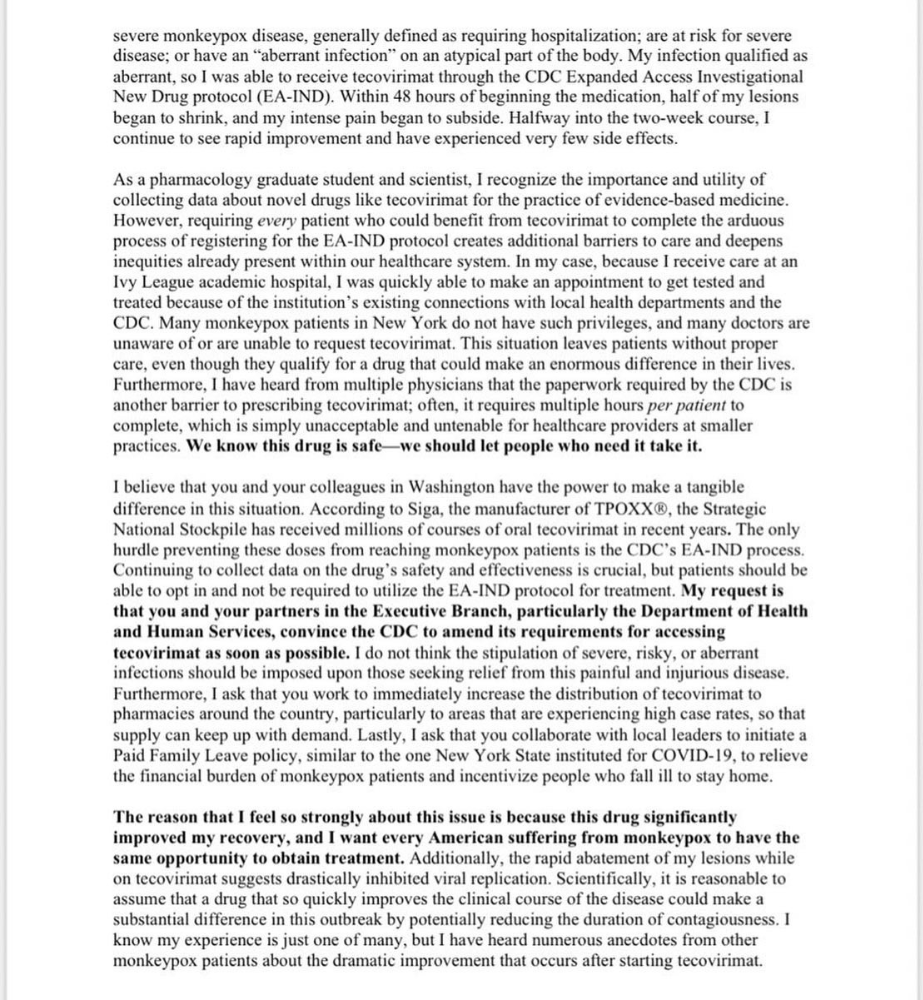
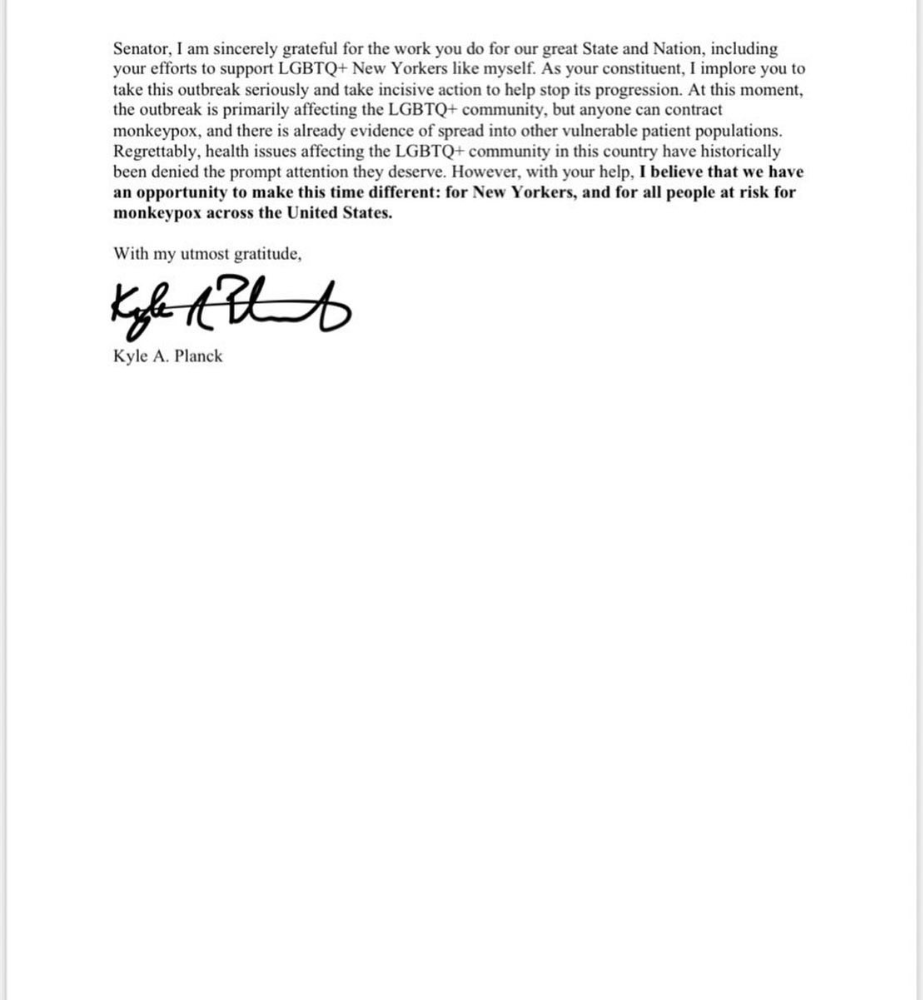
4. lobbying. Personal narratives are powerful. My narrative is only one, but I think it's compelling. Over the next day or so, i'll write to local, state, and federal officials about monkeypox. I wanted a vaccine but couldn't acquire one, and I feel tpoxx helped my disease. As a pharmacologist-in-training, I believe collecting data on a novel medicine is important, and there are ethical problems when making a drug with limited patient data broadly available. Many folks I know can't receive tpoxx due of red tape and a lack of contacts. People shouldn't have to go to an ivy league hospital to obtain the greatest care. Based on my experience and other people's tales, I believe tpoxx can drastically lessen monkeypox patients' pain and potentially curb transmission chains if administered early enough. This outbreak is manageable. It's not too late if we use all the instruments we have (diagnostic, vaccine, treatment).
*UPDATE 7/15: I submitted the following letter to Chuck Schumer and Kirsten Gillibrand. I've addressed identical letters to local, state, and federal officials, including the CDC and HHS.
I hope to join RESPND-MI, an LGBTQ+ community-led assessment of monkeypox symptoms and networks in NYC. Visit their website to learn more and give to this community-based charity.
How I got monkeypox is a mystery. I received it through a pride physical interaction, but i'm not sure which one. This outbreak will expand unless leaders act quickly. Until then, I'll keep educating and connecting people to care in my neighborhood.
Despite my misgivings, I see some optimism. Health department social media efforts are underway. During the outbreak, the CDC provided nonjudgmental suggestions for safer social and sexual activity. There's additional information regarding the disease course online, including how to request tpoxx for sufferers. These materials can help people advocate for themselves if they're sick. Importantly, homosexual guys are listening when they discuss about monkeypox online and irl. Learners They're serious.
The government has a terrible track record with lgtbq+ health issues, and they're not off to a good start this time. I hope this time will be better. If I can aid even one individual, I'll do so.
Thanks for reading, supporting me, and spreading awareness about the 2022 monkeypox outbreak. My dms are accessible if you want info, resources, queries, or to chat.
y'all well
kyle

Katharine Valentino
3 years ago
A Gun-toting Teacher Is Like a Cook With Rat Poison
Pink or blue AR-15s?
A teacher teaches; a gun kills. Killing isn't teaching. Killing is opposite of teaching.
Without 27 school shootings this year, we wouldn't be talking about arming teachers. Gun makers, distributors, and the NRA cause most school shootings. Gun makers, distributors, and the NRA wouldn't be huge business if weapons weren't profitable.
Guns, ammo, body armor, holsters, concealed carriers, bore sights, cleaner kits, spare magazines and speed loaders, gun safes, and ear protection are sold. And more guns.
And lots more profit.
Guns aren't bread. You eat a loaf of bread in a week or so and then must buy more. Bread makers will make money. Winchester 94.30–30 1899 Lever Action Rifle from 1894 still kills. (For safety, I won't link to the ad.) Gun makers don't object if you collect antique weapons, but they need you to buy the latest, in-style killing machine. The youngster who killed 19 students and 2 teachers at Robb Elementary School in Uvalde, Texas, used an AR-15. Better yet, two.
Salvador Ramos, the Robb Elementary shooter, is a "killing influencer" He pushes consumers to buy items, which benefits manufacturers and distributors. Like every previous AR-15 influencer, he profits Colt, the rifle's manufacturer, and 52,779 gun dealers in the U.S. Ramos and other AR-15 influences make us fear for our safety and our children's. Fearing for our safety, we acquire 20 million firearms a year and live in a gun culture.
So now at school, we want to arm teachers.
Consider. Which of your teachers would you have preferred in body armor with a gun drawn?
Miss Summers? Remember her bringing daisies from her yard to second grade? She handed each student a beautiful flower. Miss Summers loved everyone, even those with AR-15s. She can't shoot.
Frasier? Mr. Frasier turned a youngster over down to explain "invert." Mr. Frasier's hands shook when he wasn't flipping fifth-graders and fractions. He may have shot wrong.
Mrs. Barkley barked in high school English class when anyone started an essay with "But." Mrs. Barkley dubbed Abie a "Jewboy" and gave him terrible grades. Arming Miss Barkley is like poisoning the chef.
Think back. Do you remember a teacher with a gun? No. Arming teachers so the gun industry can make more money is the craziest idea ever.
Or maybe you agree with Ted Cruz, the gun lobby-bought senator, that more guns reduce gun violence. After the next school shooting, you'll undoubtedly talk about arming teachers and pupils. Colt will likely develop a backpack-sized, lighter version of its popular killing machine in pink and blue for kids and boys. The MAR-15? (M for mini).
This post is a summary. Read the full one here.

Mike Meyer
3 years ago
Reality Distortion
Old power paradigm blocks new planetary paradigm
The difference between our reality and the media's reality is like a tale of two worlds. The greatest and worst of times, really.
Expanding information demands complex skills and understanding to separate important information from ignorance and crap. And that's just the start of determining the source's aim.
Trust who? We see people trust liars in public and then be destroyed by their decisions. Mistakes may be devastating.
Many give up and don't trust anyone. Reality is a choice, though. Same risks.
We must separate our needs and wants from reality. Needs and wants have rules. Greed and selfishness create an unlivable planet.
Culturally, we know this, but we ignore it as foolish. Selfish and greedy people obtain what they want, while others suffer.
We invade, plunder, rape, and burn. We establish civilizations by institutionalizing an exploitable underclass and denying its existence. These cultural lies promote greed and selfishness despite their destructiveness.
Controlling parts of society institutionalize these lies as fact. Many of each age are willing to gamble on greed because they were taught to see greed and selfishness as principles justified by prosperity.
Our cultural understanding recognizes the long-term benefits of collaboration and sharing. This older understanding generates an increasing tension between greedy people and those who see its planetary effects.
Survival requires distinguishing between global and regional realities. Simple, yet many can't do it. This is the first time human greed has had a global impact.
In the past, conflict stories focused on regional winners and losers. Losers lose, winners win, etc. Powerful people see potential decades of nuclear devastation as local, overblown, and not personally dangerous.
Mutually Assured Destruction (MAD) was a human choice that required people to acquiesce to irrational devastation. This prevented nuclear destruction. Most would refuse.
A dangerous “solution” relies on nuclear trigger-pullers not acting irrationally. Since then, we've collected case studies of sane people performing crazy things in experiments. We've been lucky, but the climate apocalypse could be different.
Climate disaster requires only continuing current behavior. These actions already cause global harm, but that's not a threat. These activities must be viewed differently.
Once grasped, denying planetary facts is hard to accept. Deniers can't think beyond regional power. Seeing planet-scale is unusual.
Decades of indoctrination defining any planetary perspective as un-American implies communal planetary assets are for plundering. The old paradigm limits any other view.
In the same way, the new paradigm sees the old regional power paradigm as a threat to planetary civilization and lifeforms. Insane!
While MAD relied on leaders not acting stupidly to trigger a nuclear holocaust, the delayed climatic holocaust needs correcting centuries of lunacy. We must stop allowing craziness in global leadership.
Nothing in our acknowledged past provides a paradigm for such. Only primitive people have failed to reach our level of sophistication.
Before European colonization, certain North American cultures built sophisticated regional nations but abandoned them owing to authoritarian cruelty and destruction. They were overrun by societies that saw no wrong in perpetual exploitation. David Graeber's The Dawn of Everything is an example of historical rediscovery, which is now crucial.
From the new paradigm's perspective, the old paradigm is irrational, yet it's too easy to see those in it as ignorant or malicious, if not both. These people are both, but the collapsing paradigm they promote is older or more ingrained than we think.
We can't shift that paradigm's view of a dead world. We must eliminate this mindset from our nations' leadership. No other way will preserve the earth.
Change is occurring. As always with tremendous transition, younger people are building the new paradigm.
The old paradigm's disintegration is insane. The ability to detect errors and abandon their sources is more important than age. This is gaining recognition.
The breakdown of the previous paradigm is not due to senile leadership, but to systemic problems that the current, conservative leadership cannot recognize.
Stop following the old paradigm.
You might also like

Ossiana Tepfenhart
3 years ago
Has anyone noticed what an absolute shitshow LinkedIn is?
After viewing its insanity, I had to leave this platform.
I joined LinkedIn recently. That's how I aim to increase my readership and gain recognition. LinkedIn's premise appealed to me: a Facebook-like platform for professional networking.
I don't use Facebook since it's full of propaganda. It seems like a professional, apolitical space, right?
I expected people to:
be more formal and respectful than on Facebook.
Talk about the inclusiveness of the workplace. Studies consistently demonstrate that inclusive, progressive workplaces outperform those that adhere to established practices.
Talk about business in their industry. Yep. I wanted to read articles with advice on how to write better and reach a wider audience.
Oh, sh*t. I hadn't anticipated that.
After posting and reading about inclusivity and pro-choice, I was startled by how many professionals acted unprofessionally. I've seen:
Men have approached me in the DMs in a really aggressive manner. Yikes. huge yikes Not at all professional.
I've heard pro-choice women referred to as infant killers by many people. If I were the CEO of a company and I witnessed one of my employees acting that poorly, I would immediately fire them.
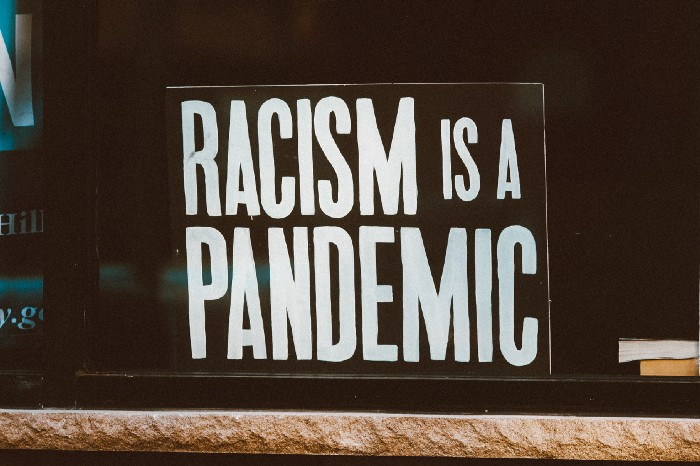
Many posts are anti-LGBTQIA+, as I've noticed. a lot, like, a lot. Some are subtly stating that the world doesn't need to know, while others are openly making fun of transgender persons like myself.
Several medical professionals were posting explicitly racist comments. Even if you are as white as a sheet like me, you should be alarmed by this. Who's to guarantee a patient who is black won't unintentionally die?
I won't even get into how many men in STEM I observed pushing for the exclusion of women from their fields. I shouldn't be surprised considering the majority of those men I've encountered have a passionate dislike for women, but goddamn, dude.
Many people appear entirely too at ease displaying their bigotry on their professional profiles.
As a white female, I'm always shocked by people's open hostility. Professional environments are very important.
I don't know if this is still true (people seem too politicized to care), but if I heard many of these statements in person, I'd suppose they feel ashamed. Really.
Are you not ashamed of being so mean? Are you so weak that competing with others terrifies you? Isn't this embarrassing?
LinkedIn isn't great at censoring offensive comments. These people aren't getting warnings. So they were safe while others were unsafe.
The CEO in me would want to know if I had placed a bigot on my staff.
I always wondered if people's employers knew about their online behavior. If they know how horrible they appear, they don't care.
As a manager, I was picky about hiring. Obviously. In most industries, it costs $1,000 or more to hire a full-time employee, so be sure it pays off.
Companies that embrace diversity and tolerance (and are intolerant of intolerance) are more profitable, likely to recruit top personnel, and successful.
People avoid businesses that alienate them. That's why I don't eat at Chic-Fil-A and why folks avoid MyPillow. Being inclusive is good business.
CEOs are harmed by online bigots. Image is an issue. If you're a business owner, you can fire staff who don't help you.
On the one hand, I'm delighted it makes it simpler to identify those with whom not to do business.
Don’t get me wrong. I'm glad I know who to avoid when hiring, getting references, or searching for a job. When people are bad, it saves me time.
What's up with professionalism?
Really. I need to know. I've crossed the boundary between acceptable and unacceptable behavior, but never on a professional platform. I got in trouble for not wearing bras even though it's not part of my gender expression.
If I behaved like that at my last two office jobs, my supervisors would have fired me immediately. Some of the behavior I've seen is so outrageous, I can't believe these people have employment. Some are even leaders.
Like…how? Is hatred now normalized?
Please pay attention whether you're seeking for a job or even simply a side gig.
Do not add to the tragedy that LinkedIn comments can be, or at least don't make uninformed comments. Even if you weren't banned, the site may still bite you.
Recruiters can and do look at your activity. Your writing goes on your résumé. The wrong comment might lose you a job.
Recruiters and CEOs might reject candidates whose principles contradict with their corporate culture. Bigotry will get you banned from many companies, especially if others report you.
If you want a high-paying job, avoid being a LinkedIn asshole. People care even if you think no one does. Before speaking, ponder. Is this how you want to be perceived?
Better advice:
If your politics might turn off an employer, stop posting about them online and ask yourself why you hold such objectionable ideas.

Karo Wanner
3 years ago
This is how I started my Twitter account.
My 12-day results look good.
Twitter seemed for old people and politicians.
I thought the platform would die soon like Facebook.
The platform's growth stalled around 300m users between 2015 and 2019.
In 2020, Twitter grew and now has almost 400m users.
Niharikaa Kaur Sodhi built a business on Twitter while I was away, despite its low popularity.
When I read about the success of Twitter users in the past 2 years, I created an account and a 3-month strategy.
I'll see if it's worth starting Twitter in 2022.
Late or perfect? I'll update you. Track my Twitter growth. You can find me here.
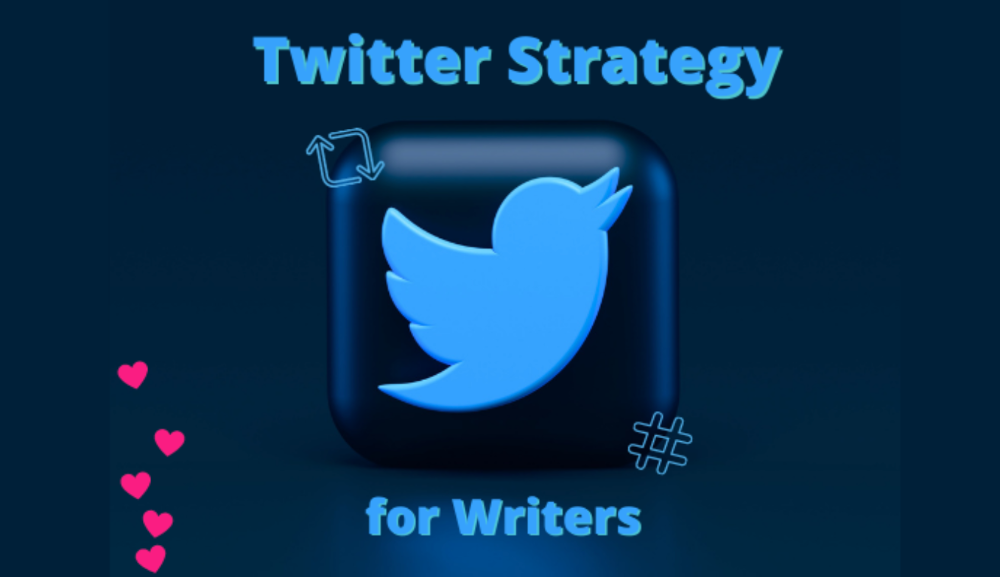
My Twitter Strategy
My Twitter goal is to build a community and recruit members for Mindful Monday.
I believe mindfulness is the only way to solve problems like poverty, inequality, and the climate crisis.
The power of mindfulness is my mission.
Mindful Monday is your weekly reminder to live in the present moment. I send mindfulness tips every Monday.
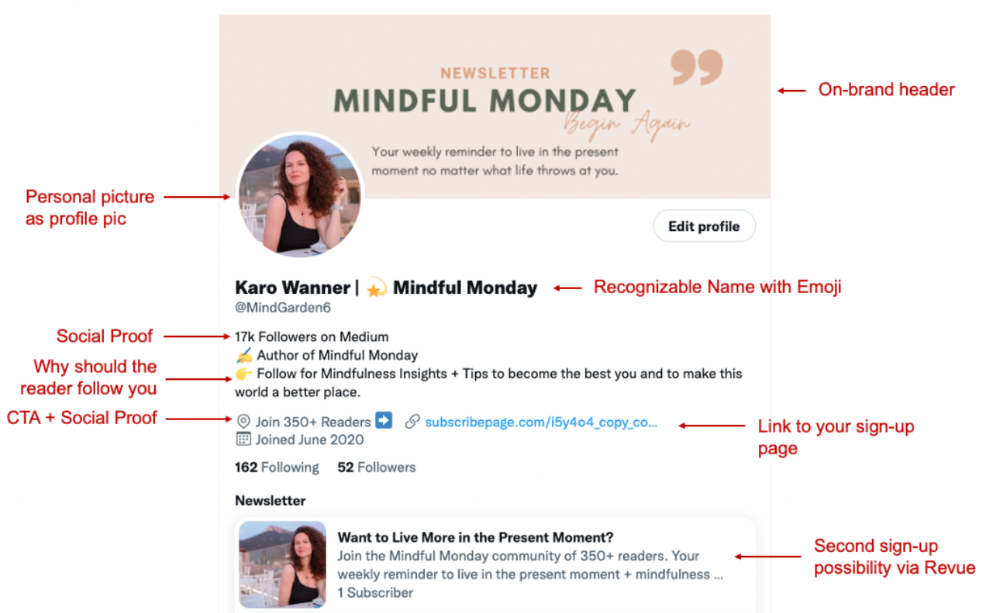
My Twitter profile promotes Mindful Monday and encourages people to join.
What I paid attention to:
I designed a brand-appropriate header to promote Mindful Monday.
Choose a profile picture. People want to know who you are.
I added my name as I do on Medium, Instagram, and emails. To stand out and be easily recognized, add an emoji if appropriate. Add what you want to be known for, such as Health Coach, Writer, or Newsletter.
People follow successful, trustworthy people. Describe any results you have. This could be views, followers, subscribers, or major news outlets. Create!
Tell readers what they'll get by following you. Can you help?
Add CTA to your profile. Your Twitter account's purpose. Give instructions. I placed my sign-up link next to the CTA to promote Mindful Monday. Josh Spector recommended this. (Thanks! Bonus tip: If you don't want the category to show in your profile, e.g. Entrepreneur, go to edit profile, edit professional profile, and choose 'Other'
Here's my Twitter:
I'm no expert, but I tried. Please share any additional Twitter tips and suggestions in the comments.
To hide your Revue newsletter subscriber count:
Join Revue. Select 'Hide Subscriber Count' in Account settings > Settings > Subscriber Count. Voila!
How frequently should you tweet?
1 to 20 Tweets per day, but consistency is key.
Stick to a daily tweet limit. Start with less and be consistent than the opposite.
I tweet 3 times per day. That's my comfort zone. Larger accounts tweet 5–7 times daily.
Do what works for you and that is the right amount.
Twitter is a long-term game, so plan your tweets for a year.
How to Batch Your Tweets?
Sunday batchs.
Sunday evenings take me 1.5 hours to create all my tweets for the week.
Use a word document and write down your posts. Podcasts, books, my own articles inspire me.
When I have a good idea or see a catchy Tweet, I take a screenshot.
To not copy but adapt.
Two pillars support my content:
(90% ~ 29 tweets per week) Inspirational quotes, mindfulness tips, zen stories, mistakes, myths, book recommendations, etc.
(10% 2 tweets per week) I share how I grow Mindful Monday with readers. This pillar promotes MM and behind-the-scenes content.
Second, I schedule all my Tweets using TweetDeck. I tweet at 7 a.m., 5 p.m., and 6 p.m.
Include Twitter Threads in your content strategy
Tweets are blog posts. In your first tweet, you include a headline, then tweet your content.
That’s how you create a series of connected Tweets.
What’s the point? You have more room to convince your reader you're an expert.
Add a call-to-action to your thread.
Follow for more like this
Newsletter signup (share your link)
Ask for retweet
One thread per week is my goal.
I'll schedule threads with Typefully. In the free version, you can schedule one Tweet, but that's fine.
Pin a thread to the top of your profile if it leads to your newsletter. So new readers see your highest-converting content first.
Tweet Medium posts
I also tweet Medium articles.
I schedule 1 weekly repost for 5 weeks after each publication. I share the same article daily for 5 weeks.
Every time I tweet, I include a different article quote, so even if the link is the same, the quote adds value.
Engage Other Experts
When you first create your account, few people will see it. Normal.
If you comment on other industry accounts, you can reach their large audience.
First, you need 50 to 100 followers. Here's my beginner tip.
15 minutes a day or when I have downtime, I comment on bigger accounts in my niche.
My 12-Day Results
Now let's look at the first data.
I had 32 followers on March 29. 12 followers in 11 days. I have 52 now.
Not huge, but growing rapidly.
Let's examine impressions/views.
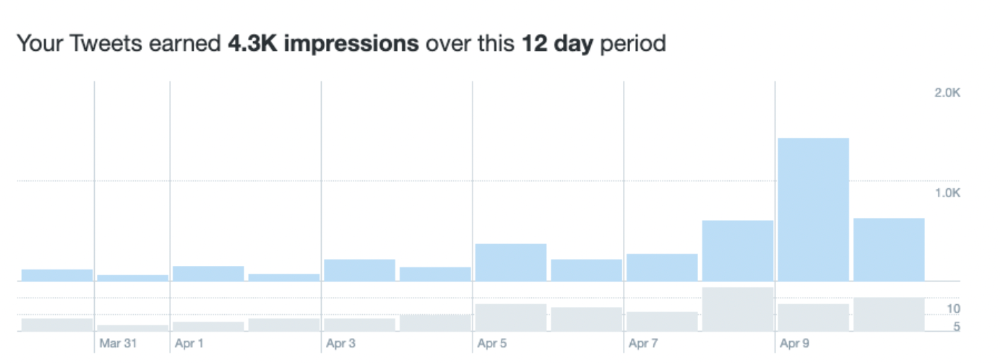
As a newbie, I gained 4,300 impressions/views in 12 days. On Medium, I got fewer views.
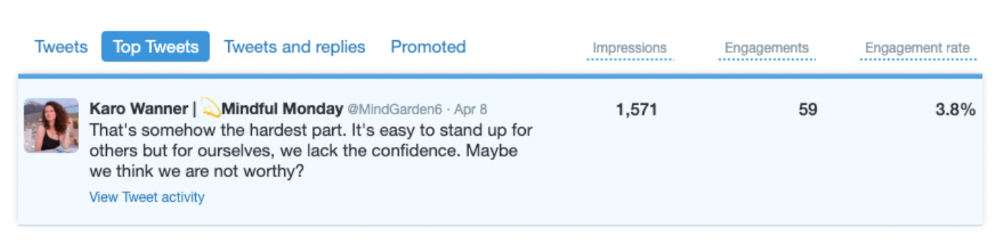
The 1,6k impressions per day spike comes from a larger account I mentioned the day before. First, I was shocked to see the spike and unsure of its origin.
These results are promising given the effort required to be consistent on Twitter.
Let's see how my journey progresses. I'll keep you posted.
Tweeters, Does this content strategy make sense? What's wrong? Comment below.
Let's support each other on Twitter. Here's me.
Which Twitter strategy works for you in 2022?
This post is a summary. Read the full article here

Max Parasol
3 years ago
Are DAOs the future or just a passing fad?
How do you DAO? Can DAOs scale?
DAO: Decentralized Autonomous. Organization.
“The whole phrase is a misnomer. They're not decentralized, autonomous, or organizations,” says Monsterplay blockchain consultant David Freuden.
As part of the DAO initiative, Freuden coauthored a 51-page report in May 2020. “We need DAOs,” he says. “‘Shareholder first' is a 1980s/90s concept. Profits became the focus, not products.”
His predictions for DAOs have come true nearly two years later. DAOs had over 1.6 million participants by the end of 2021, up from 13,000 at the start of the year. Wyoming, in the US, will recognize DAOs and the Marshall Islands in 2021. Australia may follow that example in 2022.
But what is a DAO?
Members buy (or are rewarded with) governance tokens to vote on how the DAO operates and spends its money. “DeFi spawned DAOs as an investment vehicle. So a DAO is tokenomics,” says Freuden.
DAOs are usually built around a promise or a social cause, but they still want to make money. “If you can't explain why, the DAO will fail,” he says. “A co-op without tokenomics is not a DAO.”
Operating system DAOs, protocol DAOs, investment DAOs, grant DAOs, service DAOs, social DAOs, collector DAOs, and media DAOs are now available.
Freuden liked the idea of people rallying around a good cause. Speculators and builders make up the crypto world, so it needs a DAO for them.
,Speculators and builders, or both, have mismatched expectations, causing endless, but sometimes creative friction.
Organisms that boost output
Launching a DAO with an original product such as a cryptocurrency, an IT protocol or a VC-like investment fund like FlamingoDAO is common. DAOs enable distributed open-source contributions without borders. The goal is vital. Sometimes, after a product is launched, DAOs emerge, leaving the company to eventually transition to a DAO, as Uniswap did.
Doing things together is a DAO. So it's a way to reward a distributed workforce. DAOs are essentially productivity coordination organisms.
“Those who work for the DAO make permissionless contributions and benefit from fragmented employment,” argues Freuden. DAOs are, first and foremost, a new form of cooperation.
DAO? Distributed not decentralized
In decentralized autonomous organizations, words have multiple meanings. DAOs can emphasize one aspect over another. Autonomy is a trade-off for decentralization.
DAOstack CEO Matan Field says a DAO is a distributed governance system. Power is shared. However, there are two ways to understand a DAO's decentralized nature. This clarifies the various DAO definitions.
A decentralized infrastructure allows a DAO to be decentralized. It could be created on a public permissionless blockchain to prevent a takeover.
As opposed to a company run by executives or shareholders, a DAO is distributed. Its leadership does not wield power
Option two is clearly distributed.
But not all of this is “automated.”
Think quorum, not robot.
DAOs can be autonomous in the sense that smart contracts are self-enforcing and self-executing. So every blockchain transaction is a simplified smart contract.
Dao landscape
The DAO landscape is evolving.
Consider how Ethereum's smart contracts work. They are more like self-executing computer code, which Vitalik Buterin calls “persistent scripts”.
However, a DAO is self-enforcing once its members agree on its rules. As such, a DAO is “automated upon approval by the governance committee.” This distinguishes them from traditional organizations whose rules must be interpreted and applied.
Why a DAO? They move fast
A DAO can quickly adapt to local conditions as a governance mechanism. It's a collaborative decision-making tool.
Like UkraineDAO, created in response to Putin's invasion of Ukraine by Ukrainian expat Alona Shevchenko, Nadya Tolokonnikova, Trippy Labs, and PleasrDAO. The DAO sought to support Ukrainian charities by selling Ukrainian flag NFTs. With a single mission, a DAO can quickly raise funds for a country accepting crypto where banks are distrusted.
This could be a watershed moment for DAOs.
ConstitutionDAO was another clever use case for DAOs for Freuden. In a failed but “beautiful experiment in a single-purpose DAO,” ConstitutionDAO tried to buy a copy of the US Constitution from a Sotheby's auction. In November 2021, ConstitutionDAO raised $47 million from 19,000 people, but a hedge fund manager outbid them.
Contributions were returned or lost if transactional gas fees were too high. The ConstitutionDAO, as a “beautiful experiment,” proved exceptionally fast at organizing and crowdsourcing funds for a specific purpose.
We may soon be applauding UkraineDAO's geopolitical success in support of the DAO concept.
Some of the best use cases for DAOs today, according to Adam Miller, founder of DAOplatform.io and MIDAO Directory Services, involve DAO structures.
That is, a “flat community is vital.” Prototyping by the crowd is a good example. To succeed, members must be enthusiastic about DAOs as an alternative to starting a company. Because DAOs require some hierarchy, he agrees that "distributed is a better acronym."
Miller sees DAOs as a “new way of organizing people and resources.” He started DAOplatform.io, a DAO tooling advisery that is currently transitioning to a DAO due to the “woeful tech options for running a DAO,” which he says mainly comprises of just “multisig admin keys and a voting system.” So today he's advising on DAO tech stacks.
Miller identifies three key elements.
Tokenization is a common method and tool. Second, governance mechanisms connected to the DAO's treasury. Lastly, community.”
How a DAO works...
They can be more than glorified Discord groups if they have a clear mission. This mission is a mix of financial speculation and utopianism. The spectrum is vast.
The founder of Dash left the cryptocurrency project in 2017. It's the story of a prophet without an heir. So creating a global tokenized evangelical missionary community via a DAO made sense.
Evan Duffield, a “libertarian/anarchist” visionary, forked Bitcoin in January 2014 to make it instant and essentially free. He went away for a while, and DASH became a DAO.
200,000 US retailers, including Walmart and Barnes & Noble, now accept Dash as payment. This payment system works like a gift card.
Arden Goldstein, Dash's head of crypto, DAO, and blockchain marketing, claims Dash is the “first successful DAO.” It was founded in 2016 and disbanded after a hack, an Ethereum hard fork and much controversy. But what are the success metrics?
Crypto success is measured differently, says Goldstein. To achieve common goals, people must participate or be motivated in a healthy DAO. People are motivated to complete tasks in a successful DAO. And, crucially, when tasks get completed.
“Yes or no, 1 or 0, voting is not a new idea. The challenge is getting people to continue to participate and keep building a community.” A DAO motivates volunteers: Nothing keeps people from building. The DAO “philosophy is old news. You need skin in the game to play.”
MasterNodes must stake 1000 Dash. Those members are rewarded with DASH for marketing (and other tasks). It uses an outsourced team to onboard new users globally.
Joining a DAO is part of the fun of meeting crazy or “very active” people on Discord. No one gets fired (usually). If your work is noticed, you may be offered a full-time job.
DAO community members worldwide are rewarded for brand building. Dash is also a great product for developing countries with high inflation and undemocratic governments. The countries with the most Dash DAO members are Russia, Brazil, Venezuela, India, China, France, Italy, and the Philippines.
Grassroots activism makes this DAO work. A DAO is local. Venezuelans can't access Dash.org, so DAO members help them use a VPN. DAO members are investors, fervent evangelicals, and local product experts.
Every month, proposals and grant applications are voted on via the Dash platform. However, the DAO may decide not to fund you. For example, the DAO once hired a PR firm, but the community complained about the lack of press coverage. This raises a great question: How are real-world contractual obligations met by a DAO?
Does the DASH DAO work?
“I see the DAO defund projects I thought were valuable,” Goldstein says. Despite working full-time, I must submit a funding proposal. “Much faster than other companies I've worked on,” he says.
Dash DAO is a headless beast. Ryan Taylor is the CEO of the company overseeing the DASH Core Group project.
The issue is that “we don't know who has the most tokens [...] because we don't know who our customers are.” As a result, “the loudest voices usually don't have the most MasterNodes and aren't the most invested.”
Goldstein, the only female in the DAO, says she worked hard. “I was proud of the DAO when I made the logo pink for a day and got great support from the men.” This has yet to entice a major influx of female DAO members.
Many obstacles stand in the way of utopian dreams.
Governance problems remain
And what about major token holders behaving badly?
In early February, a heated crypto Twitter debate raged on about inclusion, diversity, and cancel culture in relation to decentralized projects. In this case, the question was how a DAO addresses alleged inappropriate behavior.
In a corporation, misconduct can result in termination. In a DAO, founders usually hold a large number of tokens and the keys to the blockchain (multisignature) or otherwise.
Brantly Millegan, the director of operations of Ethereum Name Service (ENS), made disparaging remarks about the LGBTQ community and other controversial topics. The screenshotted comments were made in 2016 and brought to the ENS board's attention in early 2022.
His contract with ENS has expired. But what of his large DAO governance token holdings?
Members of the DAO proposed a motion to remove Millegan from the DAO. His “delegated” votes net 370,000. He was and is the DAO's largest delegate.
What if he had refused to accept the DAO's decision?
Freuden says the answer is not so simple.
“Can a DAO kick someone out who built the project?”
The original mission “should be dissolved” if it no longer exists. “Does a DAO fail and return the money? They must r eturn the money with interest if the marriage fails.”
Before an IPO, VCs might try to remove a problematic CEO.
While DAOs use treasury as a governance mechanism, it is usually controlled (at least initially) by the original project creators. Or, in the case of Uniswap, the venture capital firm a16z has so much voting power that it has delegated it to student-run blockchain organizations.
So, can DAOs really work at scale? How to evolve voting paradigms beyond token holdings?
The whale token holder issue has some solutions. Multiple tokens, such as a utility token on top of a governance token, and quadratic voting for whales, are now common. Other safeguards include multisignature blockchain keys and decision time locks that allow for any automated decision to be made. The structure of each DAO will depend on the assets at stake.
In reality, voter turnout is often a bigger issue.
Is DAO governance scalable?
Many DAOs have low participation. Due to a lack of understanding of technology, apathy, or busy lives. “The bigger the DAO, the fewer voters who vote,” says Freuden.
Freuden's report cites British anthropologist Dunbar's Law, who argued that people can only maintain about 150 relationships.
"As the DAO grows in size, the individual loses influence because they perceive their voting power as being diminished or insignificant. The Ringelmann Effect and Dunbar's Rule show that as a group grows in size, members become lazier, disenfranchised, and detached.
Freuden says a DAO requires “understanding human relationships.” He believes DAOs work best as investment funds rooted in Cryptoland and small in scale. In just three weeks, SyndicateDAO enabled the creation of 450 new investment group DAOs.
Due to SEC regulations, FlamingoDAO, a famous NFT curation investment DAO, could only have 100 investors. The “LAO” is a member-directed venture capital fund and a US LLC. To comply with US securities law, they only allow 100 members with a 120ETH minimum staking contribution.
But how did FlamingoDAO make investment decisions? How often did all 70 members vote? Art and NFTs are highly speculative.
So, investment DAOs are thought to work well in a small petri dish environment. This is due to a crypto-native club's pooled capital (maximum 7% per member) and crowdsourced knowledge.
While scalability is a concern, each DAO will operate differently depending on the goal, technology stage, and personalities. Meetups and hackathons are common ways for techies to collaborate on a cause or test an idea. But somebody still organizes the hack.
Holographic consensus voting
But clever people are working on creative solutions to every problem.
Miller of DAOplatform.io cites DXdao as a successful DAO. Decentralized product and service creator DXdao runs the DAO entirely on-chain. “You earn voting rights by contributing to the community.”
DXdao, a DAOstack fork, uses holographic consensus, a voting algorithm invented by DAOstack founder Matan Field. The system lets a random or semi-random subset make group-wide decisions.
By acting as a gatekeeper for voters, DXdao's Luke Keenan explains that “a small predictions market economy emerges around the likely outcome of a proposal as tokens are staked on it.” Also, proposals that have been financially boosted have fewer requirements to be successful, increasing system efficiency.” DXdao “makes decisions by removing voting power as an economic incentive.”
Field explains that holographic consensus “does not require a quorum to render a vote valid.”
“Rather, it provides a parallel process. It is a game played (for profit) by ‘predictors' who make predictions about whether or not a vote will be approved by the voters. The voting process is valid even when the voting quorum is low if enough stake is placed on the outcome of the vote.
“In other words, a quorum is not a scalable DAO governance strategy,” Field says.
You don't need big votes on everything. If only 5% vote, fine. To move significant value or make significant changes, you need a longer voting period (say 30 days) and a higher quorum,” says Miller.
Clearly, DAOs are maturing. The emphasis is on tools like Orca and processes that delegate power to smaller sub-DAOs, committees, and working groups.
Miller also claims that “studies in psychology show that rewarding people too much for volunteering disincentivizes them.” So, rather than giving out tokens for every activity, you may want to offer symbolic rewards like POAPs or contributor levels.
“Free lunches are less rewarding. Random rewards can boost motivation.”
Culture and motivation
DAOs (and Web3 in general) can give early adopters a sense of ownership. In theory, they encourage early participation and bootstrapping before network effects.
"A double-edged sword," says Goldstein. In the developing world, they may not be fully scalable.
“There must always be a leader,” she says. “People won't volunteer if they don't want to.”
DAO members sometimes feel entitled. “They are not the boss, but they think they should be able to see my calendar or get a daily report,” Goldstein gripes. Say, “I own three MasterNodes and need to know X, Y, and Z.”
In most decentralized projects, strong community leaders are crucial to influencing culture.
Freuden says “the DAO's community builder is the cryptoland influencer.” They must “disseminate the DAO's culture, cause, and rally the troops” in English, not tech.
They must keep members happy.
So the community builder is vital. Building a community around a coin that promises riches is simple, but keeping DAO members motivated is difficult.
It's a human job. But tools like SourceCred or coordinate that measure contributions and allocate tokens are heavily marketed. Large growth funds/community funds/grant programs are common among DAOs.
The Future?
Onboarding, committed volunteers, and an iconic community builder may be all DAOs need.
It takes a DAO just one day to bring together a passionate (and sometimes obsessive) community. For organizations with a common goal, managing stakeholder expectations is critical.
A DAO's core values are community and cause, not scalable governance. “DAOs will work at scale like gaming communities, but we will have sub-DAOs everywhere like committees,” says Freuden.
So-called holographic consensuses “can handle, in principle, increasing rates of proposals by turning this tension between scale and resilience into an economical cost,” Field writes. Scalability is not guaranteed.
The DAO's key innovation is the fragmented workplace. “Voting is a subset of engagement,” says Freuden. DAO should allow for permissionless participation and engagement. DAOs allow for remote work.”
In 20 years, DAOs may be the AI-powered self-organizing concept. That seems far away now. But a new breed of productivity coordination organisms is maturing.