


More on Web3 & Crypto

Sam Hickmann
4 years ago
A quick guide to formatting your text on INTΞGRITY
[06/20/2022 update] We have now implemented a powerful text editor, but you can still use markdown.
Markdown:
Headers
SYNTAX:
# This is a heading 1
## This is a heading 2
### This is a heading 3
#### This is a heading 4
RESULT:
This is a heading 1
This is a heading 2
This is a heading 3
This is a heading 4
Emphasis
SYNTAX:
**This text will be bold**
~~Strikethrough~~
*You **can** combine them*
RESULT:
This text will be italic
This text will be bold
You can combine them
Images
SYNTAX:
RESULT:
Videos
SYNTAX:
https://www.youtube.com/watch?v=7KXGZAEWzn0
RESULT:
Links
SYNTAX:
[Int3grity website](https://www.int3grity.com)
RESULT:
Tweets
SYNTAX:
https://twitter.com/samhickmann/status/1503800505864130561
RESULT:
Blockquotes
SYNTAX:
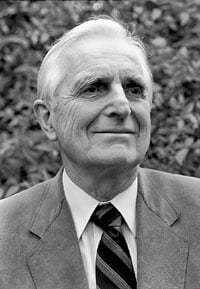
> Human beings face ever more complex and urgent problems, and their effectiveness in dealing with these problems is a matter that is critical to the stability and continued progress of society. \- Doug Engelbart, 1961
RESULT:
Human beings face ever more complex and urgent problems, and their effectiveness in dealing with these problems is a matter that is critical to the stability and continued progress of society. - Doug Engelbart, 1961
Inline code
SYNTAX:
Text inside `backticks` on a line will be formatted like code.
RESULT:
Text inside backticks on a line will be formatted like code.
Code blocks
SYNTAX:
'''js
function fancyAlert(arg) {
  if(arg) {
    $.facebox({div:'#foo'})
  }
}
'''
RESULT:
function fancyAlert(arg) {
if(arg) {
$.facebox({div:'#foo'})
}
}
Maths
We support LaTex to typeset math. We recommend reading the full documentation on the official website
SYNTAX:
$$[x^n+y^n=z^n]$$
RESULT:
[x^n+y^n=z^n]
Tables
SYNTAX:
| header a | header b |
| ---- | ---- |
| row 1 col 1 | row 1 col 2 |
RESULT:
| header a | header b | header c |
|---|---|---|
| row 1 col 1 | row 1 col 2 | row 1 col 3 |

forkast
3 years ago
Three Arrows Capital collapse sends crypto tremors

Three Arrows Capital's Google search volume rose over 5,000%.
Three Arrows Capital, a Singapore-based cryptocurrency hedge fund, filed for Chapter 15 bankruptcy last Friday to protect its U.S. assets from creditors.
Three Arrows filed for bankruptcy on July 1 in New York.
Three Arrows was ordered liquidated by a British Virgin Islands court last week after defaulting on a $670 million loan from Voyager Digital. Three days later, the Singaporean government reprimanded Three Arrows for spreading misleading information and exceeding asset limits.
Three Arrows' troubles began with Terra's collapse in May, after it bought US$200 million worth of Terra's LUNA tokens in February, co-founder Kyle Davies told the Wall Street Journal. Three Arrows has failed to meet multiple margin calls since then, including from BlockFi and Genesis.
Three Arrows Capital, founded by Kyle Davies and Su Zhu in 2012, manages $10 billion in crypto assets.
Bitcoin's price fell from US$20,600 to below US$19,200 after Three Arrows' bankruptcy petition. According to CoinMarketCap, BTC is now above US$20,000.
What does it mean?
Every action causes an equal and opposite reaction, per Newton's third law. Newtonian physics won't comfort Three Arrows investors, but future investors will thank them for their overconfidence.
Regulators are taking notice of crypto's meteoric rise and subsequent fall. Historically, authorities labeled the industry "high risk" to warn traditional investors against entering it. That attitude is changing. Regulators are moving quickly to regulate crypto to protect investors and prevent broader asset market busts.
The EU has reached a landmark deal that will regulate crypto asset sales and crypto markets across the 27-member bloc. The U.S. is close behind with a similar ruling, and smaller markets are also looking to improve safeguards.
For many, regulation is the only way to ensure the crypto industry survives the current winter.

The Verge
3 years ago
Bored Ape Yacht Club creator raises $450 million at a $4 billion valuation.
Yuga Labs, owner of three of the biggest NFT brands on the market, announced today a $450 million funding round. The money will be used to create a media empire based on NFTs, starting with games and a metaverse project.
The team's Otherside metaverse project is an MMORPG meant to connect the larger NFT universe. They want to create “an interoperable world” that is “gamified” and “completely decentralized,” says Wylie Aronow, aka Gordon Goner, co-founder of Bored Ape Yacht Club. “We think the real Ready Player One experience will be player run.”
Just a few weeks ago, Yuga Labs announced the acquisition of CryptoPunks and Meebits from Larva Labs. The deal brought together three of the most valuable NFT collections, giving Yuga Labs more IP to work with when developing games and metaverses. Last week, ApeCoin was launched as a cryptocurrency that will be governed independently and used in Yuga Labs properties.
Otherside will be developed by “a few different game studios,” says Yuga Labs CEO Nicole Muniz. The company plans to create development tools that allow NFTs from other projects to work inside their world. “We're welcoming everyone into a walled garden.”
However, Yuga Labs believes that other companies are approaching metaverse projects incorrectly, allowing the startup to stand out. People won't bond spending time in a virtual space with nothing going on, says Yuga Labs co-founder Greg Solano, aka Gargamel. Instead, he says, people bond when forced to work together.
In order to avoid getting smacked, Solano advises making friends. “We don't think a Zoom chat and walking around saying ‘hi' creates a deep social experience.” Yuga Labs refused to provide a release date for Otherside. Later this year, a play-to-win game is planned.
The funding round was led by Andreessen Horowitz, a major investor in the Web3 space. It previously backed OpenSea and Coinbase. Animoca Brands, Coinbase, and MoonPay are among those who have invested. Andreessen Horowitz general partner Chris Lyons will join Yuga Labs' board. The Financial Times broke the story last month.
"META IS A DOMINANT DIGITAL EXPERIENCE PROVIDER IN A DYSTOPIAN FUTURE."
This emerging [Web3] ecosystem is important to me, as it is to companies like Meta,” Chris Dixon, head of Andreessen Horowitz's crypto arm, tells The Verge. “In a dystopian future, Meta is the dominant digital experience provider, and it controls all the money and power.” (Andreessen Horowitz co-founder Marc Andreessen sits on Meta's board and invested early in Facebook.)
Yuga Labs has been profitable so far. According to a leaked pitch deck, the company made $137 million last year, primarily from its NFT brands, with a 95% profit margin. (Yuga Labs declined to comment on deck figures.)
But the company has built little so far. According to OpenSea data, it has only released one game for a limited time. That means Yuga Labs gets hundreds of millions of dollars to build a gaming company from scratch, based on a hugely lucrative art project.
Investors fund Yuga Labs based on its success. That's what they did, says Dixon, “they created a culture phenomenon”. But ultimately, the company is betting on the same thing that so many others are: that a metaverse project will be the next big thing. Now they must construct it.
You might also like

Steffan Morris Hernandez
3 years ago
10 types of cognitive bias to watch out for in UX research & design
10 biases in 10 visuals
Cognitive biases are crucial for UX research, design, and daily life. Our biases distort reality.
After learning about biases at my UX Research bootcamp, I studied Erika Hall's Just Enough Research and used the Nielsen Norman Group's wealth of information. 10 images show my findings.
1. Bias in sampling
Misselection of target population members causes sampling bias. For example, you are building an app to help people with food intolerances log their meals and are targeting adult males (years 20-30), adult females (ages 20-30), and teenage males and females (ages 15-19) with food intolerances. However, a sample of only adult males and teenage females is biased and unrepresentative.

2. Sponsor Disparity
Sponsor bias occurs when a study's findings favor an organization's goals. Beware if X organization promises to drive you to their HQ, compensate you for your time, provide food, beverages, discounts, and warmth. Participants may endeavor to be neutral, but incentives and prizes may bias their evaluations and responses in favor of X organization.
In Just Enough Research, Erika Hall suggests describing the company's aims without naming it.

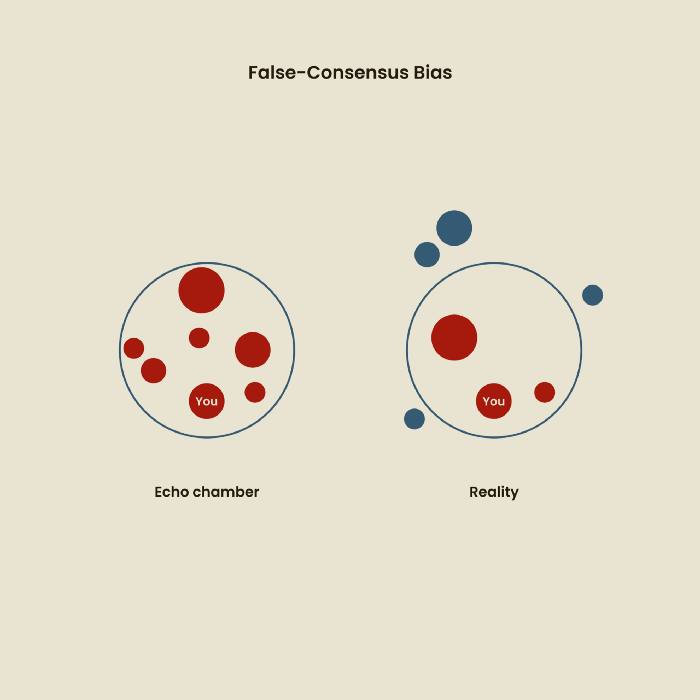
Third, False-Consensus Bias
False-consensus bias is when a person thinks others think and act the same way. For instance, if a start-up designs an app without researching end users' needs, it could fail since end users may have different wants. https://www.nngroup.com/videos/false-consensus-effect/
Working directly with the end user and employing many research methodologies to improve validity helps lessen this prejudice. When analyzing data, triangulation can boost believability.
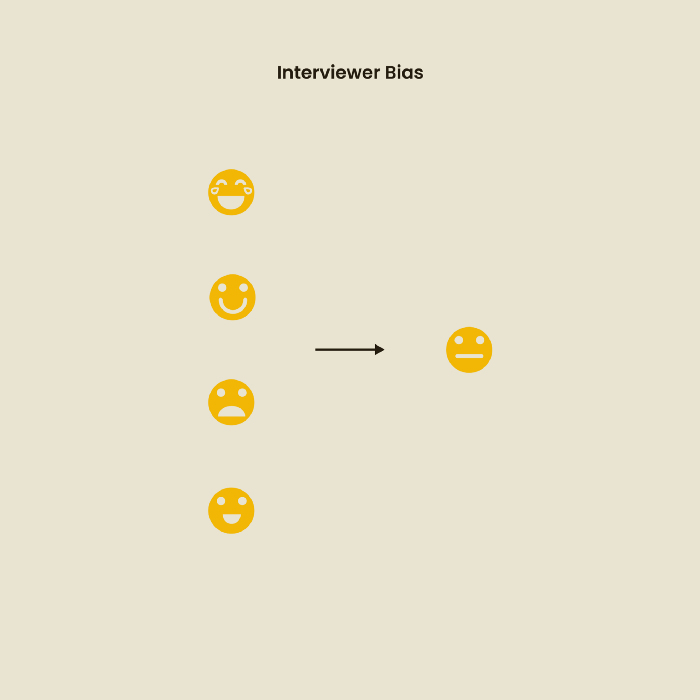
Bias of the interviewer
I struggled with this bias during my UX research bootcamp interviews. Interviewing neutrally takes practice and patience. Avoid leading questions that structure the story since the interviewee must interpret them. Nodding or smiling throughout the interview may subconsciously influence the interviewee's responses.
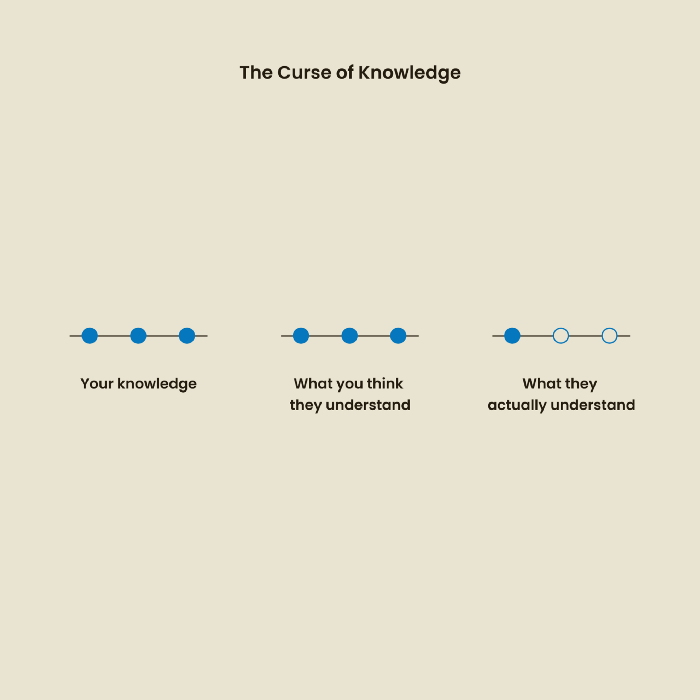
The Curse of Knowledge
The curse of knowledge occurs when someone expects others understand a subject as well as they do. UX research interviews and surveys should reduce this bias because technical language might confuse participants and harm the research. Interviewing participants as though you are new to the topic may help them expand on their replies without being influenced by the researcher's knowledge.
Confirmation Bias
Most prevalent bias. People highlight evidence that supports their ideas and ignore data that doesn't. The echo chamber of social media creates polarization by promoting similar perspectives.
A researcher with confirmation bias may dismiss data that contradicts their research goals. Thus, the research or product may not serve end users.

Design biases
UX Research design bias pertains to study construction and execution. Design bias occurs when data is excluded or magnified based on human aims, assumptions, and preferences.

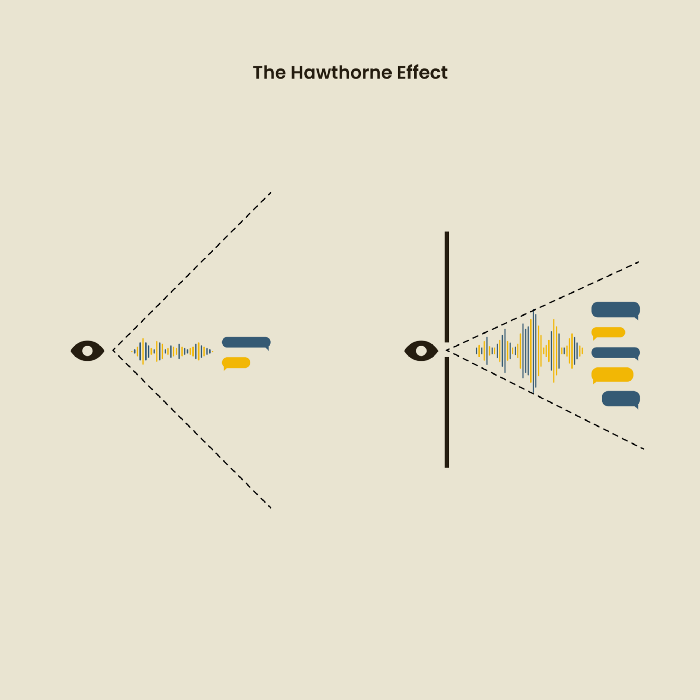
The Hawthorne Impact
Remember when you behaved differently while the teacher wasn't looking? When you behaved differently without your parents watching? A UX research study's Hawthorne Effect occurs when people modify their behavior because you're watching. To escape judgment, participants may act and speak differently.
To avoid this, researchers should blend into the background and urge subjects to act alone.
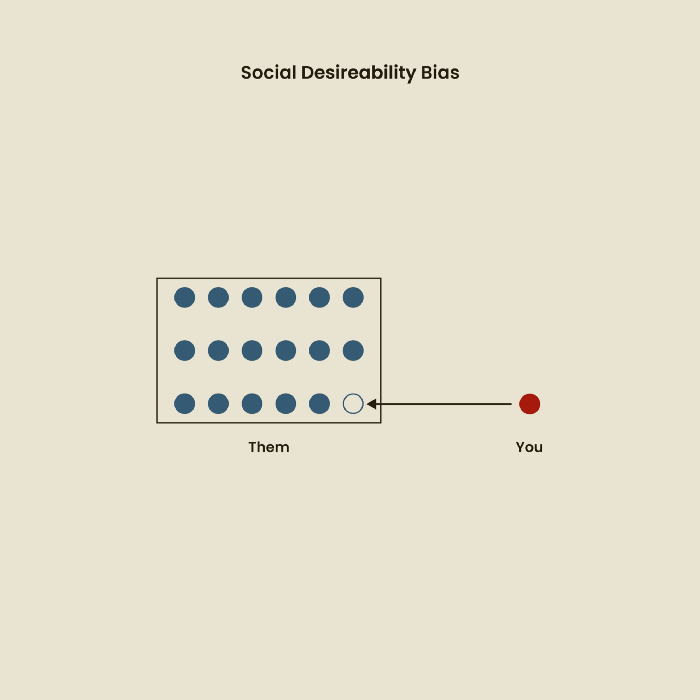
The bias against social desire
People want to belong to escape rejection and hatred. Research interviewees may mislead or slant their answers to avoid embarrassment. Researchers should encourage honesty and confidentiality in studies to address this. Observational research may reduce bias better than interviews because participants behave more organically.
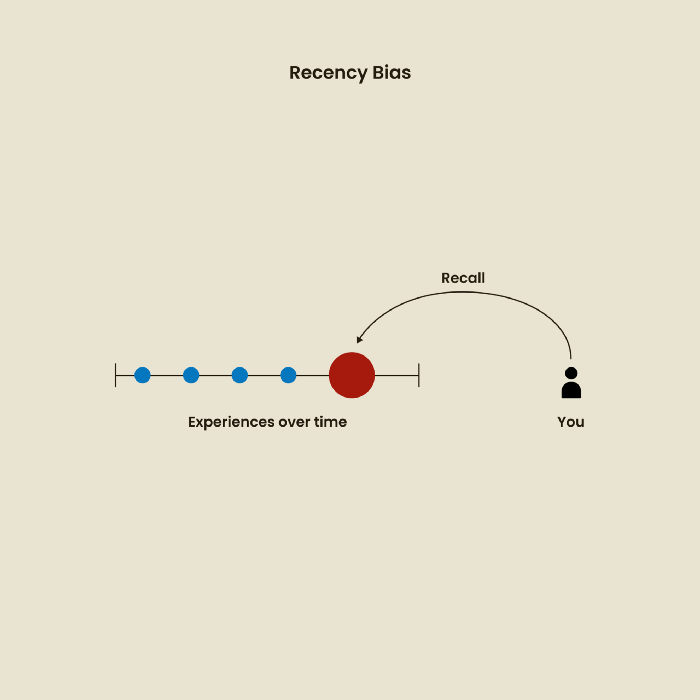
Relative Time Bias
Humans tend to appreciate recent experiences more. Consider school. Say you failed a recent exam but did well in the previous 7 exams. Instead, you may vividly recall the last terrible exam outcome.
If a UX researcher relies their conclusions on the most recent findings instead of all the data and results, recency bias might occur.
I hope you liked learning about UX design, research, and real-world biases.

John Rampton
3 years ago
Ideas for Samples of Retirement Letters

Ready to quit full-time? No worries.
Baby Boomer retirement has accelerated since COVID-19 began. In 2020, 29 million boomers retire. Over 3 million more than in 2019. 75 million Baby Boomers will retire by 2030.
First, quit your work to enjoy retirement. Leave a professional legacy. Your retirement will start well. It all starts with a retirement letter.
Retirement Letter
Retirement letters are formal resignation letters. Different from other resignation letters, these don't tell your employer you're leaving. Instead, you're quitting.
Since you're not departing over grievances or for a better position or higher income, you may usually terminate the relationship amicably. Consulting opportunities are possible.
Thank your employer for their support and give them transition information.
Resignation letters aren't merely a formality. This method handles wages, insurance, and retirement benefits.
Retirement letters often accompany verbal notices to managers. Schedule a meeting before submitting your retirement letter to discuss your plans. The letter will be stored alongside your start date, salary, and benefits in your employee file.
Retirement is typically well-planned. Employers want 6-12 months' notice.
Summary
Guidelines for Giving Retirement Notice
Components of a Successful Retirement Letter
Template for Retirement Letter
Ideas for Samples of Retirement Letters
First Example of Retirement Letter
Second Example of Retirement Letter
Third Example of Retirement Letter
Fourth Example of Retirement Letter
Fifth Example of Retirement Letter
Sixth Example of Retirement Letter
Seventh Example of Retirement Letter
Eighth Example of Retirement Letter
Ninth Example of Retirement Letter
Tenth Example of Retirement Letter
Frequently Asked Questions
1. What is a letter of retirement?
2. Why should you include a letter of retirement?
3. What information ought to be in your retirement letter?
4. Must I provide notice?
5. What is the ideal retirement age?
Guidelines for Giving Retirement Notice
While starting a new phase, you're also leaving a job you were qualified for. You have years of experience. So, it may not be easy to fill a retirement-related vacancy.
Talk to your boss in person before sending a letter. Notice is always appreciated. Properly announcing your retirement helps you and your organization transition.
How to announce retirement:
Learn about the retirement perks and policies offered by the company. The first step in figuring out whether you're eligible for retirement benefits is to research your company's retirement policy.
Don't depart without providing adequate notice. You should give the business plenty of time to replace you if you want to retire in a few months.
Help the transition by offering aid. You could be a useful resource if your replacement needs training.
Contact the appropriate parties. The original copy should go to your boss. Give a copy to HR because they will manage your 401(k), pension, and health insurance.
Investigate the option of working as a consultant or part-time. If you desire, you can continue doing some limited work for the business.
Be nice to others. Describe your achievements and appreciation. Additionally, express your gratitude for giving you the chance to work with such excellent coworkers.
Make a plan for your future move. Simply updating your employer on your goals will help you maintain a good working relationship.
Use a formal letter or email to formalize your plans. The initial step is to speak with your supervisor and HR in person, but you must also give written notice.
Components of a Successful Retirement Letter
To write a good retirement letter, keep in mind the following:
A formal salutation. Here, the voice should be deliberate, succinct, and authoritative.
Be specific about your intentions. The key idea of your retirement letter is resignation. Your decision to depart at this time should be reflected in your letter. Remember that your intention must be clear-cut.
Your deadline. This information must be in resignation letters. Laws and corporate policies may both stipulate a minimum amount of notice.
A kind voice. Your retirement letter shouldn't contain any resentments, insults, or other unpleasantness. Your letter should be a model of professionalism and grace. A straightforward thank you is a terrific approach to accomplish that.
Your ultimate goal. Chaos may start to happen as soon as you turn in your resignation letter. Your position will need to be filled. Additionally, you will have to perform your obligations up until a successor is found. Your availability during the interim period should be stated in your resignation letter.
Give us a way to reach you. Even if you aren't consulting, your company will probably get in touch with you at some point. They might send you tax documents and details on perks. By giving your contact information, you can make this process easier.
Template for Retirement Letter
Identify
Title you held
Address
Supervisor's name
Supervisor’s position
Company name
HQ address
Date
[SUPERVISOR],
1.
Inform that you're retiring. Include your last day worked.
2.
Employer thanks. Mention what you're thankful for. Describe your accomplishments and successes.
3.
Helping moves things ahead. Plan your retirement. Mention your consultancy interest.
Sincerely,
[Signature]
First and last name
Phone number
Personal Email
Ideas for Samples of Retirement Letters
First Example of Retirement Letter
Martin D. Carey
123 Fleming St
Bloomfield, New Jersey 07003
(555) 555-1234
June 6th, 2022
Willie E. Coyote
President
Acme Co
321 Anvil Ave
Fairfield, New Jersey 07004
Dear Mr. Coyote,
This letter notifies Acme Co. of my retirement on August 31, 2022.
There has been no other organization that has given me that sense of belonging and purpose.
My fifteen years at the helm of the Structural Design Division have given me a strong sense of purpose. I’ve been fortunate to have your support, and I’ll be always grateful for the opportunity you offered me.
I had a difficult time making this decision. As a result of finding a small property in Arizona where we will be able to spend our remaining days together, my wife and I have decided to officially retire.
In spite of my regret at being unable to contribute to the firm we’ve built, I believe it is wise to move on.
My heart will always belong to Acme Co. Thank you for the opportunity and best of luck in the years to come.
Sincerely,
Martin D. Carey
Second Example of Retirement Letter
Gustavo Fring
Los Pollas Hermanos
12000–12100 Coors Rd SW,
Albuquerque, New Mexico 87045
Dear Mr. Fring,
I write this letter to announce my formal retirement from Los Pollas Hermanos as manager, effective October 15.
As an employee at Los Pollas Hermanos, I appreciate all the great opportunities you have given me. It has been a pleasure to work with and learn from my colleagues for the past 10 years, and I am looking forward to my next challenge.
If there is anything I can do to assist during this time, please let me know.
Sincerely,
Linda T. Crespo
Third Example of Retirement Letter
William M. Arviso
4387 Parkview Drive
Tustin, CA 92680
May 2, 2023
Tony Stark
Owner
Stark Industries
200 Industrial Avenue
Long Beach, CA 90803
Dear Tony:
I’m writing to inform you that my final day of work at Stark Industries will be May14, 2023. When that time comes, I intend to retire.
As I embark on this new chapter in my life, I would like to thank you and the entire Stark Industries team for providing me with so many opportunities. You have all been a pleasure to work with and I will miss you all when I retire.
I am glad to assist you with the transition in any way I can to ensure your new hire has a seamless experience. All ongoing projects will be completed until my retirement date, and all key information will be handed over to the team.
Once again, thank you for the opportunity to be part of the Stark Industries team. All the best to you and the team in the days to come.
Please do not hesitate to contact me if you require any additional information. In order to finalize my retirement plans, I’ll meet with HR and can provide any details that may be necessary.
Sincerely,
(Signature)
William M. Arviso
Fourth Example of Retirement Letter
Garcia, Barbara
First Street, 5432
New York City, NY 10001
(1234) (555) 123–1234
1 October 2022
Gunther
Owner
Central Perk
199 Lafayette St.
New York City, NY 10001
Mr. Gunther,
The day has finally arrived. As I never imagined, I will be formally retiring from Central Perk on November 1st, 2022.
Considering how satisfied I am with my current position, this may surprise you. It would be best if I retired now since my health has deteriorated, so I think this is a good time to do so.
There is no doubt that the past two decades have been wonderful. Over the years, I have seen a small coffee shop grow into one of the city’s top destinations.
It will be hard for me to leave this firm without wondering what more success we could have achieved. But I’m confident that you and the rest of the Central Perk team will achieve great things.
My family and I will never forget what you’ve done for us, and I am grateful for the chance you’ve given me. My house is always open to you.
Sincerely Yours
Garcia, Barbara
Fifth Example of Retirement Letter
Pat Williams
618 Spooky Place
Monstropolis, 23221
123–555–0031
pwilliams@email.com
Feb. 16, 2022
Mike Wazowski
Co-CEO
Monters, Inc.
324 Scare Road
Monstropolis
Dear Mr. Wazowski,
As a formal notice of my upcoming retirement, I am submitting this letter. I will be leaving Monters, Inc. on April 13.
These past 10 years as a marketing associate have provided me with many opportunities. Since we started our company a decade ago, we have seen the face of harnessing screams change dramatically into harnessing laughter. During my time working with this dynamic marketing team, I learned a lot about customer behavior and marketing strategies. Working closely with some of our long-standing clients, such as Boo, was a particular pleasure.
I would be happy to assist with the transition following my retirement. It would be my pleasure to assist in the hiring or training of my replacement. In order to spend more time with my family, I will also be able to offer part-time consulting services.
After I retire, I plan to cash out the eight unused vacation days I’ve accumulated and take my pension as a lump sum.
Thank you for the opportunity to work with Monters, Inc. In the years to come, I wish you all the best!
Sincerely,
Paul Williams
Sixth Example of Retirement Letter
Dear Micheal,
As In my tenure at Dunder Mifflin Paper Company, I have given everything I had. It has been an honor to work here. But I have decided to move on to new challenges and retire from my position — mainly bears, beets, and Battlestar Galactia.
I appreciate the opportunity to work here and learn so much. During my time at this company, I will always remember the good times and memories we shared. Wishing you all the best in the future.
Sincerely,
Dwight K. Shrute
Your signature
May 16
Seventh Example of Retirement Letter
Greetings, Bill
I am announcing my retirement from Initech, effective March 15, 2023.
Over the course of my career here, I’ve had the privilege of working with so many talented and inspiring people.
In 1999, when I began working as a customer service representative, we were a small organization located in a remote office park.
The fact that we now occupy a floor of the Main Street office building with over 150 employees continues to amaze me.
I am looking forward to spending more time with family and traveling the country in our RV. Although I will be sad to leave.
Please let me know if there are any extra steps I can take to facilitate this transfer.
Sincerely,
Frankin, RenitaEighth Example of Retirement Letter
Height Example of Retirement Letter
Bruce,
Please accept my resignation from Wayne Enterprises as Marketing Communications Director. My last day will be August 1, 2022.
The decision to retire has been made after much deliberation. Now that I have worked in the field for forty years, I believe it is a good time to begin completing my bucket list.
It was not easy for me to decide to leave the company. Having worked at Wayne Enterprises has been rewarding both professionally and personally. There are still a lot of memories associated with my first day as a college intern.
My intention was not to remain with such an innovative company, as you know. I was able to see the big picture with your help, however. Today, we are a force that is recognized both nationally and internationally.
In addition to your guidance, the bold, visionary leadership of our company contributed to the growth of our company.
My departure from the company coincides with a particularly hectic time. Despite my best efforts, I am unable to postpone my exit.
My position would be well served by an internal solution. I have a more than qualified marketing manager in Caroline Crown. It would be a pleasure to speak with you about this.
In case I can be of assistance during the switchover, please let me know. Contact us at (555)555–5555. As part of my responsibilities, I am responsible for making sure all work is completed to Wayne Enterprise’s stringent requirements. Having the opportunity to work with you has been a pleasure. I wish you continued success with your thriving business.
Sincerely,
Cash, Cole
Marketing/Communications
Ninth Example of Retirement Letter
Norman, Jamie
2366 Hanover Street
Whitestone, NY 11357
555–555–5555
15 October 2022
Mr. Lippman
Head of Pendant Publishing
600 Madison Ave.
New York, New York
Respected Mr. Lippman,
Please accept my resignation effective November 1, 2022.
Over the course of my ten years at Pendant Publishing, I’ve had a great deal of fun and I’m quite grateful for all the assistance I’ve received.
It was a pleasure to wake up and go to work every day because of our outstanding corporate culture and the opportunities for promotion and professional advancement available to me.
While I am excited about retiring, I am going to miss being part of our team. It’s my hope that I’ll be able to maintain the friendships I’ve formed here for a long time to come.
In case I can be of assistance prior to or following my departure, please let me know. If I can assist in any way to ensure a smooth transfer to my successor, I would be delighted to do so.
Sincerely,
Signed (hard copy letter)
Norman, Jamie
Tenth Example of Retirement Letter
17 January 2023
Greg S. Jackson
Cyberdyne Systems
18144 El Camino Real,
Sunnyvale, CA
Respected Mrs. Duncan,
I am writing to inform you that I will be resigning from Cyberdyne Systems as of March 1, 2023. I’m grateful to have had this opportunity, and it was a difficult decision to make.
My development as a programmer and as a more seasoned member of the organization has been greatly assisted by your coaching.
I have been proud of Cyberdyne Systems’ ethics and success throughout my 25 years at the company. Starting as a mailroom clerk and currently serving as head programmer.
The portfolios of our clients have always been handled with the greatest care by my colleagues. It is our employees and services that have made Cyberdyne Systems the success it is today.
During my tenure as head of my division, I’ve increased our overall productivity by 800 percent, and I expect that trend to continue after I retire.
In light of the fact that the process of replacing me may take some time, I would like to offer my assistance in any way I can.
The greatest contender for this job is Troy Ledford, my current assistant.
Also, before I leave, I would be willing to teach any partners how to use the programmer I developed to track and manage the development of Skynet.
Over the next few months, I’ll be enjoying vacations with my wife as well as my granddaughter moving to college.
If Cyberdyne Systems has any openings for consultants, please let me know. It has been a pleasure working with you over the last 25 years. I appreciate your concern and care.
Sincerely,
Greg S, Jackson
Questions and Answers
1. What is a letter of retirement?
Retirement letters tell your supervisor you're retiring. This informs your employer that you're departing, like a letter. A resignation letter also requests retirement benefits.
Supervisors frequently receive retirement letters and verbal resignations. Before submitting your retirement letter, meet to discuss your plans. This letter will be filed with your start date, salary, and benefits.
2. Why should you include a letter of retirement?
Your retirement letter should explain why you're leaving. When you quit, your manager and HR department usually know. Regardless, a retirement letter might help you leave on a positive tone. It ensures they have the necessary papers.
In your retirement letter, you tell the firm your plans so they can find your replacement. You may need to stay in touch with your company after sending your retirement letter until a successor is identified.
3. What information ought to be in your retirement letter?
Format it like an official letter. Include your retirement plans and retirement-specific statistics. Date may be most essential.
In some circumstances, benefits depend on when you resign and retire. A date on the letter helps HR or senior management verify when you gave notice and how long.
In addition to your usual salutation, address your letter to your manager or supervisor.
The letter's body should include your retirement date and transition arrangements. Tell them whether you plan to help with the transition or train a new employee. You may have a three-month time limit.
Tell your employer your job title, how long you've worked there, and your biggest successes. Personalize your letter by expressing gratitude for your career and outlining your retirement intentions. Finally, include your contact info.
4. Must I provide notice?
Two-week notice isn't required. Your company may require it. Some state laws contain exceptions.
Check your contract, company handbook, or HR to determine your retirement notice. Resigning may change the policy.
Regardless of your company's policy, notification is standard. Entry-level or junior jobs can be let go so the corporation can replace them.
Middle managers, high-level personnel, and specialists may take months to replace. Two weeks' notice is a courtesy. Start planning months ahead.
You can finish all jobs at that period. Prepare transition documents for coworkers and your replacement.
5. What is the ideal retirement age?
Depends on finances, state, and retirement plan. The average American retires at 62. The average retirement age is 66, according to Gallup's 2021 Economy and Personal Finance Survey.
Remember:
Before the age of 59 1/2, withdrawals from pre-tax retirement accounts, such as 401(k)s and IRAs, are subject to a penalty.
Benefits from Social Security can be accessed as early as age 62.
Medicare isn't available to you till you're 65,
Depending on the year of your birth, your Full Retirement Age (FRA) will be between 66 and 67 years old.
If you haven't taken them already, your Social Security benefits increase by 8% annually between ages 6 and 77.

Jari Roomer
3 years ago
Three Simple Daily Practices That Will Immediately Double Your Output
Most productive people are habitual.

Early in the day, do important tasks.
In his best-selling book Eat That Frog, Brian Tracy advised starting the day with your hardest, most important activity.
Most individuals work best in the morning. Energy and willpower peak then.
Mornings are also ideal for memory, focus, and problem-solving.
Thus, the morning is ideal for your hardest chores.
It makes sense to do these things during your peak performance hours.
Additionally, your morning sets the tone for the day. According to Brian Tracy, the first hour of the workday steers the remainder.
After doing your most critical chores, you may feel accomplished, confident, and motivated for the remainder of the day, which boosts productivity.
Develop Your Essentialism
In Essentialism, Greg McKeown claims that trying to be everything to everyone leads to mediocrity and tiredness.
You'll either burn out, be spread too thin, or compromise your ideals.
Greg McKeown advises Essentialism:
Clarify what’s truly important in your life and eliminate the rest.
Eliminating non-essential duties, activities, and commitments frees up time and energy for what matters most.
According to Greg McKeown, Essentialists live by design, not default.
You'll be happier and more productive if you follow your essentials.
Follow these three steps to live more essentialist.
Prioritize Your Tasks First
What matters most clarifies what matters less. List your most significant aims and values.
The clearer your priorities, the more you can focus on them.
On Essentialism, McKeown wrote, The ultimate form of effectiveness is the ability to deliberately invest our time and energy in the few things that matter most.
#2: Set Your Priorities in Order
Prioritize your priorities, not simply know them.
“If you don’t prioritize your life, someone else will.” — Greg McKeown
Planning each day and allocating enough time for your priorities is the best method to become more purposeful.
#3: Practice saying "no"
If a request or demand conflicts with your aims or principles, you must learn to say no.
Saying no frees up space for our priorities.
Place Sleep Above All Else
Many believe they must forego sleep to be more productive. This is false.
A productive day starts with a good night's sleep.
Matthew Walker (Why We Sleep) says:
“Getting a good night’s sleep can improve cognitive performance, creativity, and overall productivity.”
Sleep helps us learn, remember, and repair.
Unfortunately, 35% of people don't receive the recommended 79 hours of sleep per night.
Sleep deprivation can cause:
increased risk of diabetes, heart disease, stroke, and obesity
Depression, stress, and anxiety risk are all on the rise.
decrease in general contentment
decline in cognitive function
To live an ideal, productive, and healthy life, you must prioritize sleep.
Follow these six sleep optimization strategies to obtain enough sleep:
Establish a nightly ritual to relax and prepare for sleep.
Avoid using screens an hour before bed because the blue light they emit disrupts the generation of melatonin, a necessary hormone for sleep.
Maintain a regular sleep schedule to control your body's biological clock (and optimizes melatonin production)
Create a peaceful, dark, and cool sleeping environment.
Limit your intake of sweets and caffeine (especially in the hours leading up to bedtime)
Regular exercise (but not right before you go to bed, because your body temperature will be too high)
Sleep is one of the best ways to boost productivity.
Sleep is crucial, says Matthew Walker. It's the key to good health and longevity.