


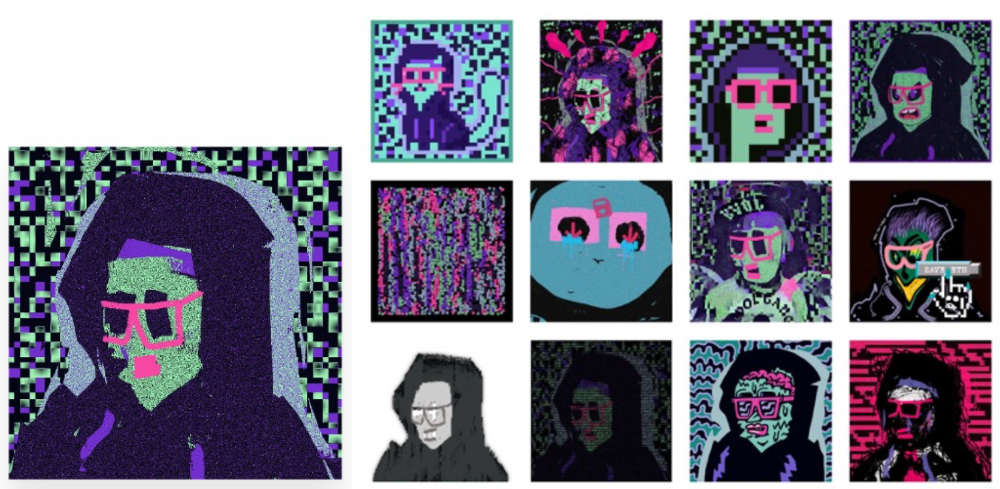
Yuga Labs (BAYC and MAYC) buys CryptoPunks and Meebits and gives them commercial rights
Yuga has acquired the CryptoPunks and Meebits NFT IP from Larva Labs. These include 423 CryptoPunks and 1711 Meebits.
We set out to create in the NFT space because we admired CryptoPunks and the founders' visionary work. A lot of their work influenced how we built BAYC and NFTs. We're proud to lead CryptoPunks and Meebits into the future as part of our broader ecosystem.
"Yuga Labs invented the modern profile picture project and are the best in the world at operating these projects. They are ideal CrytoPunk and Meebit stewards. We are confident that in their hands, these projects will thrive in the emerging decentralized web.”
–The founders of Larva Labs, CryptoPunks, and Meebits
This deal grew out of discussions between our partner Guy Oseary and the Larva Labs founders. One call led to another, and now we're here. This does not mean Matt and John will join Yuga. They'll keep running Larva Labs and creating awesome projects that help shape the future of web3.
Next steps
Here's what we plan to do with CryptoPunks and Meebits now that we own the IP. Owners of CryptoPunks and Meebits will soon receive commercial rights equal to those of BAYC and MAYC holders. Our legal teams are working on new terms and conditions for both collections, which we hope to share with the community soon. We expect a wide range of third-party developers and community creators to incorporate CryptoPunks and Meebits into their web3 projects. We'll build the brand alongside them.
We don't intend to cram these NFT collections into the BAYC club model. We see BAYC as the hub of the Yuga universe, and CryptoPunks as a historical collection. We will work to improve the CryptoPunks and Meebits collections as good stewards. We're not in a hurry. We'll consult the community before deciding what to do next.
For us, NFTs are about culture. We're deeply invested in the BAYC community, and it's inspiring to see them grow, collaborate, and innovate. We're excited to see what CryptoPunks and Meebits do with IP rights. Our goal has always been to create a community-owned brand that goes beyond NFTs, and now we can include CryptoPunks and Meebits.
More on NFTs & Art
Scott Duke Kominers
3 years ago
NFT Creators Go Creative Commons Zero (cc0)
On January 1, "Public Domain Day," thousands of creative works immediately join the public domain. The original creator or copyright holder loses exclusive rights to reproduce, adapt, or publish the work, and anybody can use it. It happens with movies, poems, music, artworks, books (where creative rights endure 70 years beyond the author's death), and sometimes source code.
Public domain creative works open the door to new uses. 400,000 sound recordings from before 1923, including Winnie-the-Pooh, were released this year. With most of A.A. Milne's 1926 Winnie-the-Pooh characters now available, we're seeing innovative interpretations Milne likely never planned. The ancient hyphenated version of the honey-loving bear is being adapted for a horror movie: "Winnie-the-Pooh: Blood and Honey"... with Pooh and Piglet as the baddies.
Counterintuitively, experimenting and recombination can occasionally increase IP value. Open source movements allow the public to build on (or fork and duplicate) existing technologies. Permissionless innovation helps Android, Linux, and other open source software projects compete. Crypto's success at attracting public development is also due to its support of open source and "remix culture," notably in NFT forums.
Production memes
NFT projects use several IP strategies to establish brands, communities, and content. Some preserve regular IP protections; others offer NFT owners the opportunity to innovate on connected IP; yet others have removed copyright and other IP safeguards.
By using the "Creative Commons Zero" (cc0) license, artists can intentionally select for "no rights reserved." This option permits anyone to benefit from derivative works without legal repercussions. There's still a lot of confusion between copyrights and NFTs, so nothing here should be considered legal, financial, tax, or investment advice. Check out this post for an overview of copyright vulnerabilities with NFTs and how authors can protect owners' rights. This article focuses on cc0.
Nouns, a 2021 project, popularized cc0 for NFTs. Others followed, including: A Common Place, Anonymice, Blitmap, Chain Runners, Cryptoadz, CryptoTeddies, Goblintown, Gradis, Loot, mfers, Mirakai, Shields, and Terrarium Club are cc0 projects.
Popular crypto artist XCOPY licensed their 1-of-1 NFT artwork "Right-click and Save As Guy" under cc0 in January, exactly one month after selling it. cc0 has spawned many derivatives.
"Right-click Save As Guy" by XCOPY (1)/derivative works (2)
XCOPY said Monday he would apply cc0 to "all his existing art." "We haven't seen a cc0 summer yet, but I think it's approaching," said the artist. - predicting a "DeFi summer" in 2020, when decentralized finance gained popularity.
Why do so many NFT authors choose "no rights"?
Promoting expansions of the original project to create a more lively and active community is one rationale. This makes sense in crypto, where many value open sharing and establishing community.
Creativity depends on cultural significance. NFTs may allow verifiable ownership of any digital asset, regardless of license, but cc0 jumpstarts "meme-ability" by actively, not passively, inviting derivative works. As new derivatives are made and shared, attention might flow back to the original, boosting its reputation. This may inspire new interpretations, leading in a flywheel effect where each derivative adds to the original's worth - similar to platform network effects, where platforms become more valuable as more users join them.
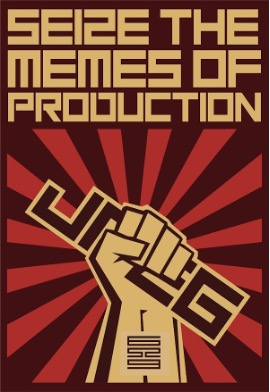
cc0 licence allows creators "seize production memes."
Physical items are also using cc0 NFT assets, thus it's not just a digital phenomenon. The Nouns Vision initiative turned the square-framed spectacles shown on each new NounsDAO NFT ("one per day, forever") into luxury sunglasses. Blitmap's pixel-art has been used on shoes, apparel, and caps. In traditional IP regimes, a single owner controls creation, licensing, and production.
The physical "blitcap" (3rd level) is a descendant of the trait in the cc0 Chain Runners collection (2nd), which uses the "logo" from cc0 Blitmap (1st)! The Logo is Blitmap token #84 and has been used as a trait in various collections. The "Dom Rose" is another popular token. These homages reference Blitmap's influence as a cc0 leader, as one of the earliest NFT projects to proclaim public domain intents. A new collection, Citizens of Tajigen, emerged last week with a Blitcap characteristic.
These derivatives can be a win-win for everyone, not just the original inventors, especially when using NFT assets to establish unique brands. As people learn about the derivative, they may become interested in the original. If you see someone wearing Nouns glasses on the street (or in a Super Bowl ad), you may desire a pair, but you may also be interested in buying an original NounsDAO NFT or related derivative.
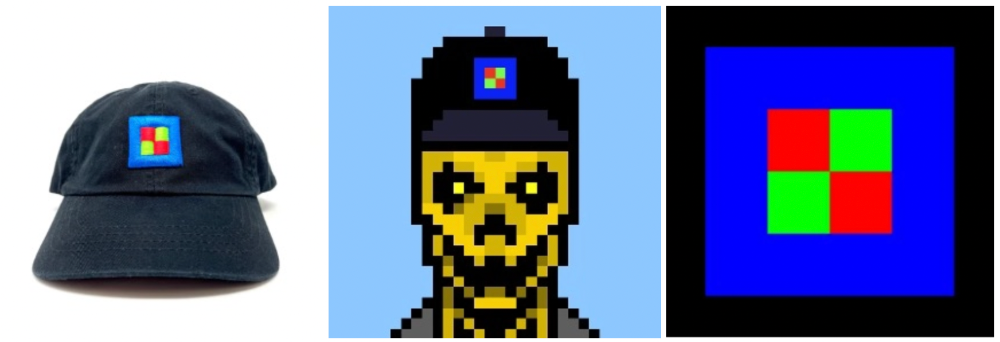
Blitmap Logo Hat (1), Chain Runners #780 ft. Hat (2), and Blitmap Original "Logo #87" (3)
Co-creating open source
NFTs' power comes from smart contract technology's intrinsic composability. Many smart contracts can be integrated or stacked to generate richer applications.
"Money Legos" describes how decentralized finance ("DeFi") smart contracts interconnect to generate new financial use cases. Yearn communicates with MakerDAO's stablecoin $DAI and exchange liquidity provider Curve by calling public smart contract methods. NFTs and their underlying smart contracts can operate as the base-layer framework for recombining and interconnecting culture and creativity.
cc0 gives an NFT's enthusiast community authority to develop new value layers whenever, wherever, and however they wish.
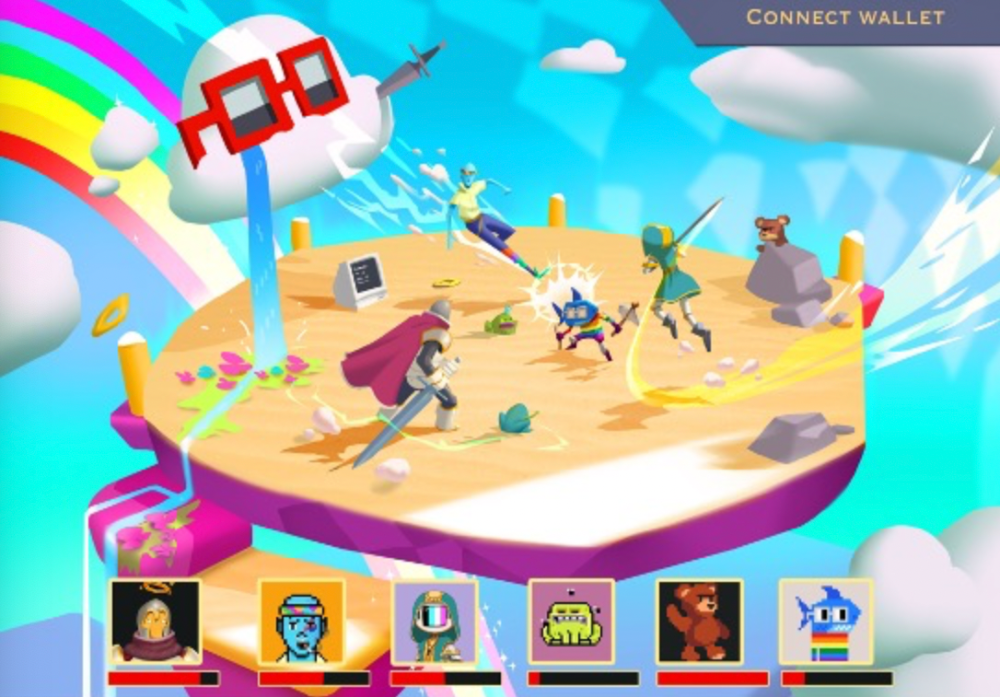
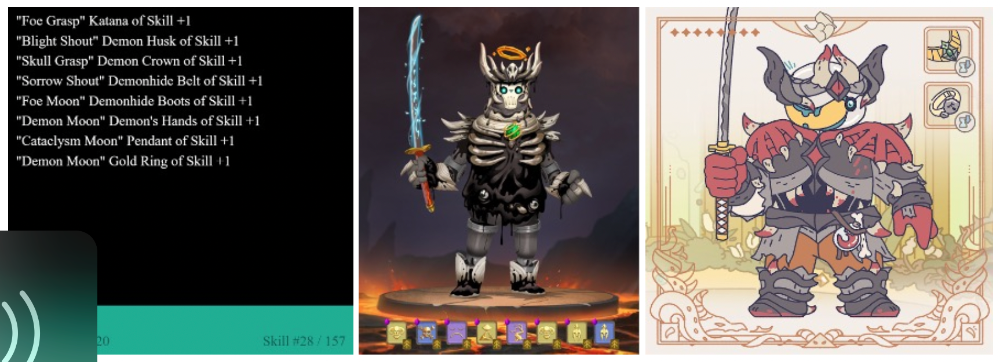
Multiple cc0 projects are playable characters in HyperLoot, a Loot Project knockoff.
Open source and Linux's rise are parallels. When the internet was young, Microsoft dominated the OS market with Windows. Linux (and its developer Linus Torvalds) championed a community-first mentality, freely available the source code without restrictions. This led to developers worldwide producing new software for Linux, from web servers to databases. As people (and organizations) created world-class open source software, Linux's value proposition grew, leading to explosive development and industry innovation. According to Truelist, Linux powers 96.3% of the top 1 million web servers and 85% of smartphones.
With cc0 licensing empowering NFT community builders, one might hope for long-term innovation. Combining cc0 with NFTs "turns an antagonistic game into a co-operative one," says NounsDAO cofounder punk4156. It's important on several levels. First, decentralized systems from open source to crypto are about trust and coordination, therefore facilitating cooperation is crucial. Second, the dynamics of this cooperation work well in the context of NFTs because giving people ownership over their digital assets allows them to internalize the results of co-creation through the value that accrues to their assets and contributions, which incentivizes them to participate in co-creation in the first place.
Licensed to create
If cc0 projects are open source "applications" or "platforms," then NFT artwork, metadata, and smart contracts provide the "user interface" and the underlying blockchain (e.g., Ethereum) is the "operating system." For these apps to attain Linux-like potential, more infrastructure services must be established and made available so people may take advantage of cc0's remixing capabilities.
These services are developing. Zora protocol and OpenSea's open source Seaport protocol enable open, permissionless NFT marketplaces. A pixel-art-rendering engine was just published on-chain to the Ethereum blockchain and integrated into OKPC and ICE64. Each application improves blockchain's "out-of-the-box" capabilities, leading to new apps created from the improved building blocks.
Web3 developer growth is at an all-time high, yet it's still a small fraction of active software developers globally. As additional developers enter the field, prospective NFT projects may find more creative and infrastructure Legos for cc0 and beyond.
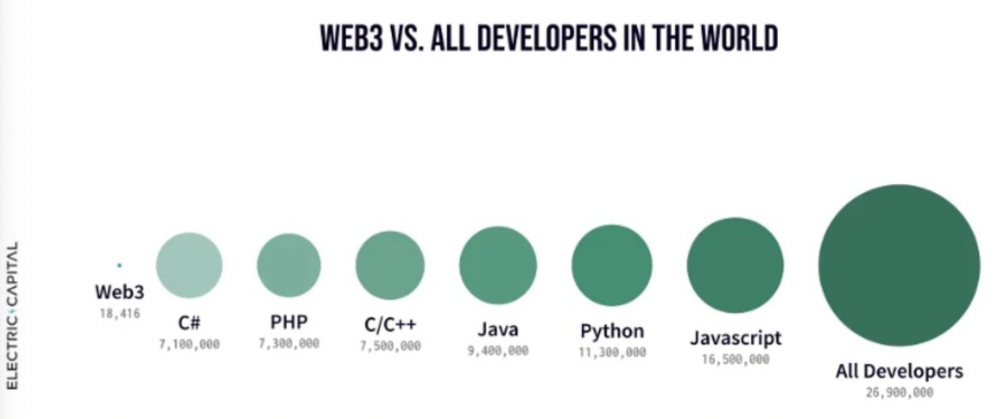
Electric Capital Developer Report (2021), p. 122
Growth requires composability. Users can easily integrate digital assets developed on public standards and compatible infrastructure into other platforms. The Loot Project is one of the first to illustrate decentralized co-creation, worldbuilding, and more in NFTs. This example was low-fi or "incomplete" aesthetically, providing room for imagination and community co-creation.
Loot began with a series of Loot bag NFTs, each listing eight "adventure things" in white writing on a black backdrop (such as Loot Bag #5726's "Katana, Divine Robe, Great Helm, Wool Sash, Divine Slippers, Chain Gloves, Amulet, Gold Ring"). Dom Hofmann's free Loot bags served as a foundation for the community.
Several projects have begun metaphorical (lore) and practical (game development) world-building in a short time, with artists contributing many variations to the collective "Lootverse." They've produced games (Realms & The Crypt), characters (Genesis Project, Hyperloot, Loot Explorers), storytelling initiatives (Banners, OpenQuill), and even infrastructure (The Rift).
Why cc0 and composability? Because consumers own and control Loot bags, they may use them wherever they choose by connecting their crypto wallets. This allows users to participate in multiple derivative projects, such as Genesis Adventurers, whose characters appear in many others — creating a decentralized franchise not owned by any one corporation.
Genesis Project's Genesis Adventurer (1) with HyperLoot (2) and Loot Explorer (3) versions
When to go cc0
There are several IP development strategies NFT projects can use. When it comes to cc0, it’s important to be realistic. The public domain won't make a project a runaway success just by implementing the license. cc0 works well for NFT initiatives that can develop a rich, enlarged ecosystem.
Many of the most successful cc0 projects have introduced flexible intellectual property. The Nouns brand is as obvious for a beer ad as for real glasses; Loot bags are simple primitives that make sense in all adventure settings; and the Goblintown visual style looks good on dwarfs, zombies, and cranky owls as it does on Val Kilmer.
The ideal cc0 NFT project gives builders the opportunity to add value:
vertically, by stacking new content and features directly on top of the original cc0 assets (for instance, as with games built on the Loot ecosystem, among others), and
horizontally, by introducing distinct but related intellectual property that helps propagate the original cc0 project’s brand (as with various Goblintown derivatives, among others).
These actions can assist cc0 NFT business models. Because cc0 NFT projects receive royalties from secondary sales, third-party extensions and derivatives can boost demand for the original assets.
Using cc0 license lowers friction that could hinder brand-reinforcing extensions or lead to them bypassing the original. Robbie Broome recently argued (in the context of his cc0 project A Common Place) that giving away his IP to cc0 avoids bad rehashes down the line. If UrbanOutfitters wanted to put my design on a tee, they could use the actual work instead of hiring a designer. CC0 can turn competition into cooperation.
Community agreement about core assets' value and contribution can help cc0 projects. Cohesion and engagement are key. Using the above examples: Developers can design adventure games around whatever themes and item concepts they desire, but many choose Loot bags because of the Lootverse's community togetherness. Flipmap shared half of its money with the original Blitmap artists in acknowledgment of that project's core role in the community. This can build a healthy culture within a cc0 project ecosystem. Commentator NiftyPins said it was smart to acknowledge the people that constructed their universe. Many OG Blitmap artists have popped into the Flipmap discord to share information.
cc0 isn't a one-size-fits-all answer; NFTs formed around well-established brands may prefer more restrictive licenses to preserve their intellectual property and reinforce exclusivity. cc0 has some superficial similarities to permitting NFT owners to market the IP connected with their NFTs (à la Bored Ape Yacht Club), but there is a significant difference: cc0 holders can't exclude others from utilizing the same IP. This can make it tougher for holders to develop commercial brands on cc0 assets or offer specific rights to partners. Holders can still introduce enlarged intellectual property (such as backstories or derivatives) that they control.
Blockchain technologies and the crypto ethos are decentralized and open-source. This makes it logical for crypto initiatives to build around cc0 content models, which build on the work of the Creative Commons foundation and numerous open source pioneers.
NFT creators that choose cc0 must select how involved they want to be in building the ecosystem. Some cc0 project leaders, like Chain Runners' developers, have kept building on top of the initial cc0 assets, creating an environment derivative projects can plug into. Dom Hofmann stood back from Loot, letting the community lead. (Dom is also working on additional cc0 NFT projects for the company he formed to build Blitmap.) Other authors have chosen out totally, like sartoshi, who announced his exit from the cc0 project he founded, mfers, and from the NFT area by publishing a final edition suitably named "end of sartoshi" and then deactivating his Twitter account. A multi-signature wallet of seven mfers controls the project's smart contract.
cc0 licensing allows a robust community to co-create in ways that benefit all members, regardless of original creators' continuous commitment. We foresee more organized infrastructure and design patterns as NFT matures. Like open source software, value capture frameworks may see innovation. (We could imagine a variant of the "Sleepycat license," which requires commercial software to pay licensing fees when embedding open source components.) As creators progress the space, we expect them to build unique rights and licensing strategies. cc0 allows NFT producers to bootstrap ideas that may take off.

Jayden Levitt
3 years ago
Starbucks' NFT Project recently defeated its rivals.
The same way Amazon killed bookstores. You just can’t see it yet.

Shultz globalized coffee. Before Starbucks, coffee sucked.
All accounts say 1970s coffee was awful.
Starbucks had three stores selling ground Indonesian coffee in the 1980s.
What a show!
A year after joining the company at 29, Shultz traveled to Italy for R&D.
He noticed the coffee shops' sense of theater and community and realized Starbucks was in the wrong business.
Integrating coffee and destination created a sense of community in the store.
Brilliant!
He told Starbucks' founders about his experience.
They disapproved.
For two years.
Shultz left and opened an Italian coffee shop chain like any good entrepreneur.
Starbucks ran into financial trouble, so the founders offered to sell to Shultz.
Shultz bought Starbucks in 1987 for $3.8 million, including six stores and a payment plan.
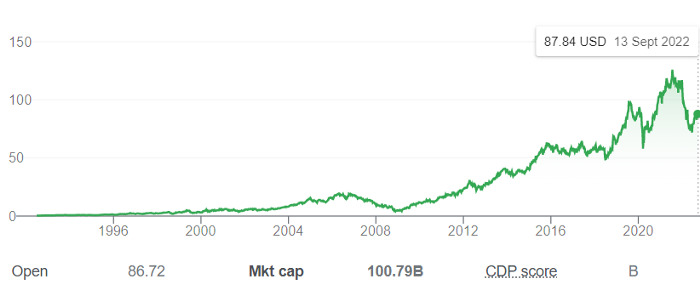
Starbucks is worth $100.79Billion, per Google Finance.
26,500 times Shultz's initial investment
Starbucks is releasing its own NFT Platform under Shultz and his early Vision.
This year, Starbucks Odyssey launches. The new digital experience combines a Loyalty Rewards program with NFT.
The side chain Polygon-based platform doesn't require a Crypto Wallet. Customers can earn and buy digital assets to unlock incentives and experiences.
They've removed all friction, making it more immersive and convenient than a coffee shop.
Brilliant!
NFTs are the access coupon to their digital community, but they don't highlight the technology.
They prioritize consumer experience by adding non-technical users to Web3. Their collectables are called journey stamps, not NFTs.
No mention of bundled gas fees.
Brady Brewer, Starbucks' CMO, said;
“It happens to be built on blockchain and web3 technologies, but the customer — to be honest — may very well not even know that what they’re doing is interacting with blockchain technology. It’s just the enabler,”
Rewards members will log into a web app using their loyalty program credentials to access Starbucks Odyssey. They won't know about blockchain transactions.
Starbucks has just dealt its rivals a devastating blow.
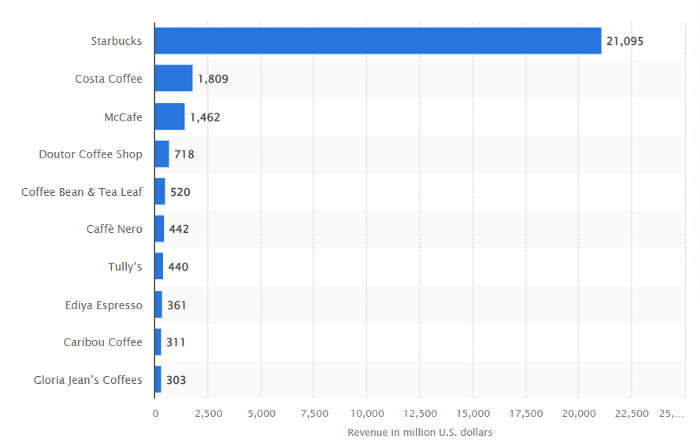
It generates more than ten times the revenue of its closest competitor Costa Coffee.
The coffee giant is booming.
Starbucks is ahead of its competitors. No wonder.
They have an innovative, adaptable leadership team.
Starbucks' DNA challenges the narrative, especially when others reject their ideas.
I’m off for a cappuccino.

Stephen Moore
3 years ago
Trading Volume on OpenSea Drops by 99% as the NFT Boom Comes to an End
Wasn't that a get-rich-quick scheme?

OpenSea processed $2.7 billion in NFT transactions in May 2021.
Fueled by a crypto bull run, rumors of unfathomable riches, and FOMO, Bored Apes, Crypto Punks, and other JPEG-format trash projects flew off the virtual shelves, snatched up by retail investors and celebrities alike.
Over a year later, those shelves are overflowing and warehouses are backlogged. Since March, I've been writing less. In May and June, the bubble was close to bursting.
Apparently, the boom has finally peaked.
This bubble has punctured, and deflation has begun. On Aug. 28, OpenSea processed $9.34 million.
From that euphoric high of $2.7 billion, $9.34 million represents a spectacular decline of 99%.
OpenSea contradicts the data. A trading platform spokeswoman stated the comparison is unfair because it compares the site's highest and lowest trading days. They're the perfect two data points to assess the drop. OpenSea chooses to use ETH volume measures, which ignore crypto's shifting price. Since January 2022, monthly ETH volume has dropped 140%, according to Dune.
Unconvincing counterargument.
Further OpenSea indicators point to declining NFT demand:
Since January 2022, daily user visits have decreased by 50%.
Daily transactions have decreased by 50% since the beginning of the year in the same manner.
Off-platform, the floor price of Bored Apes has dropped from 145 ETH to 77 ETH. (At $4,800, a reduction from $700,000 to $370,000). Google search data shows waning popular interest.
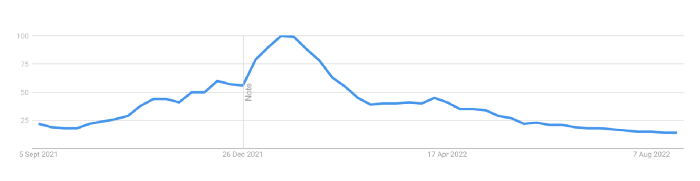
It is a trend that will soon vanish, just like laser eyes.
NFTs haven't moved since the new year. Eminem and Snoop Dogg can utilize their apes in music videos or as 3D visuals to perform at the VMAs, but the reality is that NFTs have lost their public appeal and the market is trying to regain its footing.
They've lost popularity because?
Breaking records. The technology still lacks genuine use cases a year and a half after being popular.
They're pricey prestige symbols that have made a few people rich through cunning timing or less-than-savory scams or rug pulling. Over $10.5 billion has been taken through frauds, most of which are NFT enterprises promising to be the next Bored Apes, according to Web3 is going wonderfully. As the market falls, many ordinary investors realize they purchased into a self-fulfilling ecosystem that's halted. Many NFTs are sold between owner-held accounts to boost their price, data suggests. Most projects rely on social media excitement to debut with a high price before the first owners sell and chuckle to the bank. When they don't, the initiative fails, leaving investors high and dry.
NFTs are fading like laser eyes. Most people pushing the technology don't believe in it or the future it may bring. No, they just need a Kool-Aid-drunk buyer.
Everybody wins. When your JPEGs are worth 99% less than when you bought them, you've lost.
When demand reaches zero, many will lose.
You might also like
Blake Montgomery
3 years ago
Explaining Twitter Files
Elon Musk, Matt Taibbi, the 'Twitter Files,' and Hunter Biden's laptop: what gives?
Explaining Twitter Files
Matt Taibbi released "The Twitter Files," a batch of emails sent by Twitter executives discussing the company's decision to stop an October 2020 New York Post story online.
What's on Twitter? New York Post and Fox News call them "bombshell" documents. Or, as a Post columnist admitted, are they "not the smoking gun"? Onward!
What started this?
The New York Post published an exclusive, potentially explosive story in October 2020: Biden's Secret Emails: Ukrainian executive thanks Hunter Biden for'meeting' veep dad. The story purported to report the contents of a laptop brought to the tabloid by a Delaware computer repair shop owner who said it belonged to President Biden's second son, Hunter Biden. Emails and files on the laptop allegedly showed how Hunter peddled influence with Ukranian businessmen and included a "raunchy 12-minute video" of Hunter smoking crack and having sex.
Twitter banned links to the Post story after it was published, calling it "hacked material." The Post's Twitter account was suspended for multiple days.
Why? Yoel Roth, Twitter's former head of trust and safety, said the company couldn't verify the story, implying they didn't trust the Post.
Twitter's stated purpose rarely includes verifying news stories. This seemed like intentional political interference. This story was hard to verify because the people who claimed to have found the laptop wouldn't give it to other newspapers. (Much of the story, including Hunter's business dealings in Ukraine and China, was later confirmed.)
Roth: "It looked like a hack and leak."
So what are the “Twitter Files?”
Twitter's decision to bury the story became a political scandal, and new CEO Elon Musk promised an explanation. The Twitter Files, named after Facebook leaks.
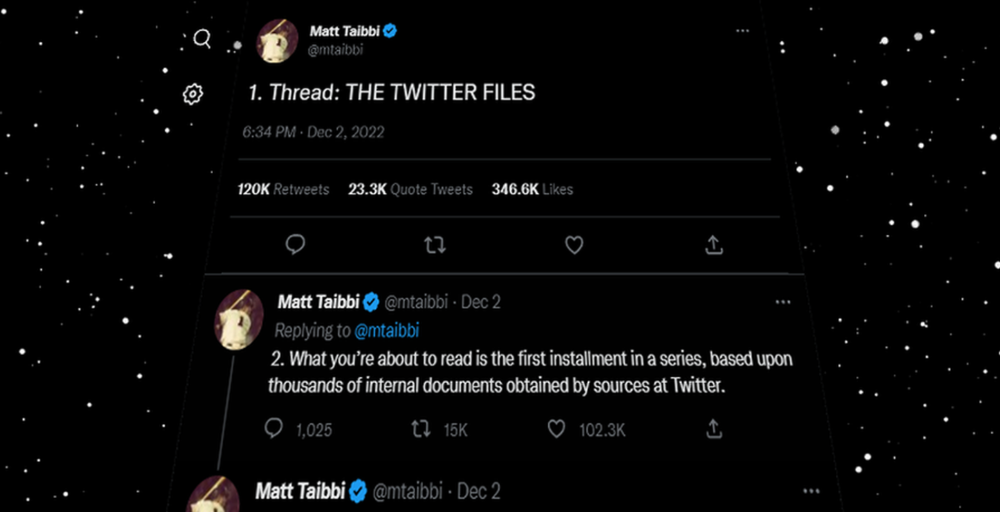
Musk promised exclusive details of "what really happened" with Hunter Biden late Friday afternoon. The tweet was punctuated with a popcorn emoji.
Explaining Twitter Files
Three hours later, journalist Matt Taibbi tweeted more than three dozen tweets based on internal Twitter documents that revealed "a Frankensteinian tale of a human-built mechanism grown out of its designer's control."
Musk sees this release as a way to shape Twitter's public perception and internal culture in his image. We don't know if the CEO gave Taibbi the documents. Musk hyped the document dump before and during publication, but Taibbi cited "internal sources."
Taibbi shares email screenshots showing Twitter execs discussing the Post story and blocking its distribution. Taibbi says the emails show Twitter's "extraordinary steps" to bury the story.
Twitter communications chief Brandon Borrman has the most damning quote in the Files. Can we say this is policy? The story seemed unbelievable. It seemed like a hack... or not? Could Twitter, which ex-CEO Dick Costolo called "the free speech wing of the free speech party," censor a news story?
Many on the right say the Twitter Files prove the company acted at the behest of Democrats. Both parties had these tools, writes Taibbi. In 2020, both the Trump White House and Biden campaign made requests. He says the system for reporting tweets for deletion is unbalanced because Twitter employees' political donations favor Democrats. Perhaps. These donations may have helped Democrats connect with Twitter staff, but it's also possible they didn't. No emails in Taibbi's cache show these alleged illicit relations or any actions Twitter employees took as a result.
Even Musk's supporters were surprised by the drop. Miranda Devine of the New York Post told Tucker Carlson the documents weren't "the smoking gun we'd hoped for." Sebastian Gorka said on Truth Social, "So far, I'm deeply underwhelmed." DC Democrats collude with Palo Alto Democrats. Whoop!” The Washington Free Beacon's Joe Simonson said the Twitter files are "underwhelming." Twitter was staffed by Democrats who did their bidding. (Why?)
If "The Twitter Files" matter, why?
These emails led Twitter to suppress the Hunter Biden laptop story has real news value. It's rare for a large and valuable company like Twitter to address wrongdoing so thoroughly. Emails resemble FOIA documents. They describe internal drama at a company with government-level power. Katie Notopoulos tweeted, "Any news outlet would've loved this scoop!" It's not a'scandal' as teased."
Twitter's new owner calls it "the de facto public town square," implying public accountability. Like a government agency. Though it's exciting to receive once-hidden documents in response to a FOIA, they may be boring and tell you nothing new. Like Twitter files. We learned how Twitter blocked the Post's story, but not why. Before these documents were released, we knew Twitter had suppressed the story and who was involved.
These people were disciplined and left Twitter. Musk fired Vijaya Gadde, the former CLO who reportedly played a "key role" in the decision. Roth quit over Musk's "dictatorship." Musk arrived after Borrman left. Jack Dorsey, then-CEO, has left. Did those who digitally quarantined the Post's story favor Joe Biden and the Democrats? Republican Party opposition and Trump hatred? New York Post distaste? According to our documents, no. Was there political and press interference? True. We knew.
Taibbi interviewed anonymous ex-Twitter employees about the decision; all expressed shock and outrage. One source said, "Everyone knew this was fucked." Since Taibbi doesn't quote that expletive, we can assume the leaked emails contained few or no sensational quotes. These executives said little to support nefarious claims.
Outlets more invested in the Hunter Biden story than Gizmodo seem vexed by the release and muted headlines. The New York Post, which has never shied away from a blaring headline in its 221-year history, owns the story of Hunter Biden's laptop. Two Friday-night Post alerts about Musk's actions were restrained. Elon Musk will drop Twitter files on NY Post-Hunter Biden laptop censorship today. Elon Musk's Twitter dropped Post censorship details from Biden's laptop. Fox News' Apple News push alert read, "Elon Musk drops Twitter censorship documents."
Bombshell, bombshell, bombshell… what, exactly, is the bombshell? Maybe we've heard this story too much and are missing the big picture. Maybe these documents detail a well-documented decision.
The Post explains why on its website. "Hunter Biden laptop bombshell: Twitter invented reason to censor Post's reporting," its headline says.
Twitter's ad hoc decision to moderate a tabloid's content is not surprising. The social network had done this for years as it battled toxic users—violent white nationalists, virulent transphobes, harassers and bullies of all political stripes, etc. No matter how much Musk crows, the company never had content moderation under control. Buzzfeed's 2016 investigation showed how Twitter has struggled with abusive posters since 2006. Jack Dorsey and his executives improvised, like Musk.
Did the US government interfere with the ex-social VP's media company? That's shocking, a bombshell. Musk said Friday, "Twitter suppressing free speech by itself is not a 1st amendment violation, but acting under government orders with no judicial review is." Indeed! Taibbi believed this. August 2022: "The laptop is secondary." Zeynep Tufecki, a Columbia professor and New York Times columnist, says the FBI is cutting true story distribution. Taibbi retracted the claim Friday night: "I've seen no evidence of government involvement in the laptop story."
What’s the bottom line?
I'm still not sure what's at stake in the Hunter Biden scandal after dozens of New York Post articles, hundreds of hours of Fox News airtime, and thousands of tweets. Briefly: Joe Biden's son left his laptop with a questionable repairman. FBI confiscated it? The repairman made a copy and gave it to Rudy Giuliani's lawyer. The Post got it from Steve Bannon. On that laptop were videos of Hunter Biden smoking crack, cavorting with prostitutes, and emails about introducing his father to a Ukrainian businessman for $50,000 a month. Joe Biden urged Ukraine to fire a prosecutor investigating the company. What? The story seems to be about Biden family business dealings, right?
The discussion has moved past that point anyway. Now, the story is the censorship of it. Adrienne Rich wrote in "Diving Into the Wreck" that she came for "the wreck and not the story of the wreck" No matter how far we go, Hunter Biden's laptop is done. Now, the crash's story matters.
I'm dizzy. Katherine Miller of BuzzFeed wrote, "I know who I believe, and you probably do, too. To believe one is to disbelieve the other, which implicates us in the decision; we're stuck." I'm stuck. Hunter Biden's laptop is a political fabrication. You choose. I've decided.
This could change. Twitter Files drama continues. Taibbi said, "Much more to come." I'm dizzy.

Pat Vieljeux
3 years ago
Your entrepreneurial experience can either be a beautiful adventure or a living hell with just one decision.
Choose.
DNA makes us distinct.
We act alike. Most people follow the same road, ignoring differences. We remain quiet about our uniqueness for fear of exclusion (family, social background, religion). We live a more or less imposed life.
Off the beaten path, we stand out from the others. We obey without realizing we're sewing a shroud. We're told to do as everyone else and spend 40 years dreaming of a golden retirement and regretting not living.
“One of the greatest regrets in life is being what others would want you to be, rather than being yourself.” - Shannon L. Alder
Others dare. Again, few are creative; most follow the example of those who establish a business for the sake of entrepreneurship. To live.
They pick a potential market and model their MVP on an existing solution. Most mimic others, alter a few things, appear to be original, and end up with bland products, adding to an already crowded market.
SaaS, PaaS, etc. followed suit. It's reduced pricing, profitability, and product lifespan.
As competitors become more aggressive, their profitability diminishes, making life horrible for them and their employees. They fail to innovate, cut costs, and close their company.
Few of them look happy and fulfilled.
How did they do it?
The answer is unsettlingly simple.
They are themselves.
They start their company, propelled at first by a passion or maybe a calling.
Then, at their own pace, they create it with the intention of resolving a dilemma.
They assess what others are doing and consider how they might improve it.
In contrast to them, they respond to it in their own way by adding a unique personal touch. Therefore, it is obvious.
Originals, like their DNA, can't be copied. Or if they are, they're poorly printed. Originals are unmatched. Artist-like. True collectors only buy Picasso paintings by the master, not forgeries, no matter how good.
Imaginative people are constantly ahead. Copycats fall behind unless they innovate. They watch their competition continuously. Their solution or product isn't sexy. They hope to cash in on their copied product by flooding the market.
They're mostly pirates. They're short-sighted, unlike creators.
Creators see further ahead and have no rivals. They use copiers to confirm a necessity. To maintain their individuality, creators avoid copying others. They find copying boring. It's boring. They oppose plagiarism.
It's thrilling and inspiring.
It will also make them more able to withstand their opponents' tension. Not to mention roadblocks. For creators, impediments are games.
Others fear it. They race against the clock and fear threats that could interrupt their momentum since they lack inventiveness and their product has a short life cycle.
Creators have time on their side. They're dedicated. Clearly. Passionate booksellers will have their own bookstore. Their passion shows in their book choices. Only the ones they love.
The copier wants to display as many as possible, including mediocre authors, and will cut costs. All this to dominate the market. They're digging their own grave.
The bookseller is just one example. I could give you tons of them.
Closing remarks
Entrepreneurs might follow others or be themselves. They risk exhaustion trying to predict what their followers will do.
It's true.
Life offers choices.
Being oneself or doing as others do, with the possibility of regretting not expressing our uniqueness and not having lived.
“Be yourself; everyone else is already taken”. Oscar Wilde
The choice is yours.

Esteban
3 years ago
The Berkus Startup Valuation Method: What Is It?
What Is That?
Berkus is a pre-revenue valuation method based exclusively on qualitative criteria, like Scorecard.
Few firms match their financial estimates, especially in the early stages, so valuation methodologies like the Berkus method are a good way to establish a valuation when the economic measures are not reliable.
How does it work?
This technique evaluates five key success factors.
Fundamental principle
Technology
Execution
Strategic alliances in its primary market
Production, followed by sales
The Berkus technique values the business idea and four success factors. As seen in the matrix below, each of these dimensions poses a danger to the startup's success.
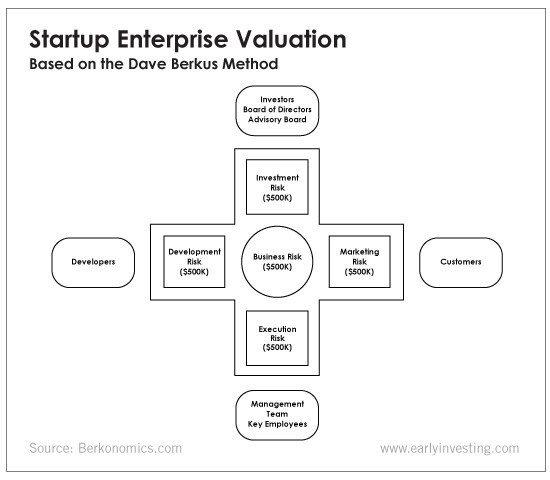
It assigns $0-$500,000 to each of these beginning regions. This approach enables a maximum $2.5M pre-money valuation.
This approach relies significantly on geography and uses the US as a baseline, as it differs in every country in Europe.
A set of standards for analyzing each dimension individually
Fundamental principle (or strength of the idea)
Ideas are worthless; execution matters. Most of us can relate to seeing a new business open in our area or a startup get funded and thinking, "I had this concept years ago!" Someone did it.
The concept remains. To assess the idea's viability, we must consider several criteria.
The concept's exclusivity It is necessary to protect a product or service's concept using patents and copyrights. Additionally, it must be capable of generating large profits.
Planned growth and growth that goes in a specific direction have a lot of potential, therefore incorporating them into a business is really advantageous.
The ability of a concept to grow A venture's ability to generate scalable revenue is a key factor in its emergence and continuation. A startup needs a scalable idea in order to compete successfully in the market.
The attraction of a business idea to a broad spectrum of people is significantly influenced by the current socio-political climate. Thus, the requirement for the assumption of conformity.
Concept Validation Ideas must go through rigorous testing with a variety of audiences in order to lower risk during the implementation phase.
Technology (Prototype)
This aspect reduces startup's technological risk. How good is the startup prototype when facing cyber threats, GDPR compliance (in Europe), tech stack replication difficulty, etc.?
Execution
Check the management team's efficacy. A potential angel investor must verify the founders' experience and track record with previous ventures. Good leadership is needed to chart a ship's course.
Strategic alliances in its primary market
Existing and new relationships will play a vital role in the development of both B2B and B2C startups. What are the startup's synergies? potential ones?
Production, followed by sales (product rollout)
Startup success depends on its manufacturing and product rollout. It depends on the overall addressable market, the startup's ability to market and sell their product, and their capacity to provide consistent, high-quality support.
Example
We're now founders of EyeCaramba, a machine vision-assisted streaming platform. My imagination always goes to poor puns when naming a startup.
Since we're first-time founders and the Berkus technique depends exclusively on qualitative methods and the evaluator's skill, we ask our angel-investor acquaintance for a pre-money appraisal of EyeCaramba.
Our friend offers us the following table:
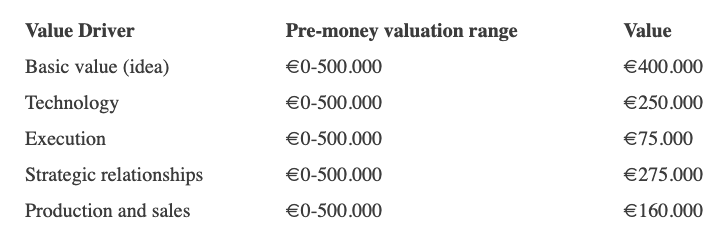
Because we're first-time founders, our pal lowered our Execution score. He knows the idea's value and that the gaming industry is red-hot, with worse startup ideas getting funded, therefore he gave the Basic value the highest value (idea).
EyeCaramba's pre-money valuation is $400,000 + $250,000 + $75,000 + $275,000 + $164,000 (1.16M). Good.
References
https://medium.com/humble-ventures/how-angel-investors-value-pre-revenue-startups-part-iii-8271405f0774#:~:text=pre%2Drevenue%20startups.-,Berkus%20Method,potential%20of%20the%20idea%20itself.%E2%80%9D
https://eqvista.com/berkus-valuation-method-for-startups/
https://www.venionaire.com/early-stage-startup-valuation-part-2-the-berkus-method/