


More on Web3 & Crypto

Dylan Smyth
4 years ago
10 Ways to Make Money Online in 2022
As a tech-savvy person (and software engineer) or just a casual technology user, I'm sure you've had this same question countless times: How do I make money online? and how do I make money with my PC/Mac?
You're in luck! Today, I will list the top 5 easiest ways to make money online. Maybe a top ten in the future? Top 5 tips for 2022.
1. Using the gig economy
There are many websites on the internet that allow you to earn extra money using skills and equipment that you already own.
I'm referring to the gig economy. It's a great way to earn a steady passive income from the comfort of your own home. For some sites, premium subscriptions are available to increase sales and access features like bidding on more proposals.
Some of these are:
- Freelancer
- Upwork
- Fiverr (⭐ my personal favorite)
- TaskRabbit
2. Mineprize
MINEPRIZE is a great way to make money online. What's more, You need not do anything! You earn money by lending your idle CPU power to MINEPRIZE.
To register with MINEPRIZE, all you need is an email address and a password. Let MINEPRIZE use your resources, and watch the money roll in! You can earn up to $100 per month by letting your computer calculate. That's insane.
3. Writing
“O Romeo, Romeo, why art thou Romeo?” Okay, I admit that not all writing is Shakespearean. To be a copywriter, you'll need to be fluent in English. Thankfully, we don't have to use typewriters anymore.
Writing is a skill that can earn you a lot of money (claps for the rhyme).
Here are a few ways you can make money typing on your fancy keyboard:
Self-publish a book
Write scripts for video creators
Write for social media
Book-checking
Content marketing help
What a list within a list!
4. Coding
Yes, kids. You've probably coded before if you understand
You've probably coded before if you understand
print("hello world");
Computational thinking (or coding) is one of the most lucrative ways to earn extra money, or even as a main source of income.
Of course, there are hardcode coders (like me) who write everything line by line, binary di — okay, that last part is a bit exaggerated.
But you can also make money by writing websites or apps or creating low code or no code platforms.
But you can also make money by writing websites or apps or creating low code or no code platforms.
Some low-code platforms
Sheet : spreadsheets to apps :
Loading... We'll install your new app... No-Code Your team can create apps and automate tasks. Agile…
www.appsheet.com
Low-code platform | Business app creator - Zoho Creator
Work is going digital, and businesses of all sizes must adapt quickly. Zoho Creator is a...
www.zoho.com
Sell your data with TrueSource. NO CODE NEEDED
Upload data, configure your product, and earn in minutes.
www.truesource.io
Cool, huh?
5. Created Content
If we use the internet correctly, we can gain unfathomable wealth and extra money. But this one is a bit more difficult. Unlike some of the other items on this list, it takes a lot of time up front.
I'm referring to sites like YouTube and Medium. It's a great way to earn money both passively and actively. With the likes of Jake- and Logan Paul, PewDiePie (a.k.a. Felix Kjellberg) and others, it's never too late to become a millionaire on YouTube. YouTubers are always rising to the top with great content.
6. NFTs and Cryptocurrency
It is now possible to amass large sums of money by buying and selling digital assets on NFTs and cryptocurrency exchanges. Binance's Initial Game Offer rewards early investors who produce the best results.
One awesome game sold a piece of its plot for US$7.2 million! It's Axie Infinity. It's free and available on Google Play and Apple Store.
7. Affiliate Marketing
Affiliate marketing is a form of advertising where businesses pay others (like bloggers) to promote their goods and services. Here's an example. I write a blog (like this one) and post an affiliate link to an item I recommend buying — say, a camera — and if you buy the camera, I get a commission!
These programs pay well:
- Elementor
- AWeber
- Sendinblue
- ConvertKit\sLeadpages
- GetResponse
- SEMRush\sFiverr
- Pabbly
8. Start a blog
Now, if you're a writer or just really passionate about something or a niche, blogging could potentially monetize that passion!
Create a blog about anything you can think of. It's okay to start right here on Medium, as I did.
9. Dropshipping
And I mean that in the best possible way — drop shopping is ridiculously easy to set up, but difficult to maintain for some.
Luckily, Shopify has made setting up an online store a breeze. Drop-shipping from Alibaba and DHGate is quite common. You've got a winner if you can find a local distributor willing to let you drop ship their product!
10. Set up an Online Course
If you have a skill and can articulate it, online education is for you.
Skillshare, Pluralsight, and Coursera have all made inroads in recent years, upskilling people with courses that YOU can create and earn from.
That's it for today! Please share if you liked this post. If not, well —

Trent Lapinski
4 years ago
What The Hell Is A Crypto Punk?
We are Crypto Punks, and we are changing your world.
A “Crypto Punk” is a new generation of entrepreneurs who value individual liberty and collective value creation and co-creation through decentralization. While many Crypto Punks were born and raised in a digital world, some of the early pioneers in the crypto space are from the Oregon Trail generation. They were born to an analog world, but grew up simultaneously alongside the birth of home computing, the Internet, and mobile computing.
A Crypto Punk’s world view is not the same as previous generations. By the time most Crypto Punks were born everything from fiat currency, the stock market, pharmaceuticals, the Internet, to advanced operating systems and microprocessing were already present or emerging. Crypto Punks were born into pre-existing conditions and systems of control, not governed by logic or reason but by greed, corporatism, subversion, bureaucracy, censorship, and inefficiency.
All Systems Are Human Made
Crypto Punks understand that all systems were created by people and that previous generations did not have access to information technologies that we have today. This is why Crypto Punks have different values than their parents, and value liberty, decentralization, equality, social justice, and freedom over wealth, money, and power. They understand that the only path forward is to work together to build new and better systems that make the old world order obsolete.
Unlike the original cypher punks and cyber punks, Crypto Punks are a new iteration or evolution of these previous cultures influenced by cryptography, blockchain technology, crypto economics, libertarianism, holographics, democratic socialism, and artificial intelligence. They are tasked with not only undoing the mistakes of previous generations, but also innovating and creating new ways of solving complex problems with advanced technology and solutions.
Where Crypto Punks truly differ is in their understanding that computer systems can exist for more than just engagement and entertainment, but actually improve the human condition by automating bureaucracy and inefficiency by creating more efficient economic incentives and systems.
Crypto Punks Value Transparency and Do Not Trust Flawed, Unequal, and Corrupt Systems
Crypto Punks have a strong distrust for inherently flawed and corrupt systems. This why Crypto Punks value transparency, free speech, privacy, and decentralization. As well as arguably computer systems over human powered systems.
Crypto Punks are the children of the Great Recession, and will never forget the economic corruption that still enslaves younger generations.
Crypto Punks were born to think different, and raised by computers to view reality through an LED looking glass. They will not surrender to the flawed systems of economic wage slavery, inequality, censorship, and subjection. They will literally engineer their own unstoppable financial systems and trade in cryptography over fiat currency merely to prove that belief systems are more powerful than corruption.
Crypto Punks are here to help achieve freedom from world governments, corporations and bankers who monetizine our data to control our lives.
Crypto Punks Decentralize
Despite all the evils of the world today, Crypto Punks know they have the power to create change. This is why Crypto Punks are optimistic about the future despite all the indicators that humanity is destined for failure.
Crypto Punks believe in systems that prioritize people and the planet above profit. Even so, Crypto Punks still believe in capitalistic systems, but only capitalistic systems that incentivize good behaviors that do not violate the common good for the sake of profit.
Cyber Punks Are Co-Creators
We are Crypto Punks, and we will build a better world for all of us. For the true price of creation is not in US dollars, but through working together as equals to replace the unequal and corrupt greedy systems of previous generations.
Where they have failed, Crypto Punks will succeed. Not because we want to, but because we have to. The world we were born into is so corrupt and its systems so flawed and unequal we were never given a choice.
We have to be the change we seek.
We are Crypto Punks.
Either help us, or get out of our way.
Are you a Crypto Punk?

Crypto Zen Monk
2 years ago
How to DYOR in the world of cryptocurrency
RESEARCH
We must create separate ideas and handle our own risks to be better investors. DYOR is crucial.
The only thing unsustainable is your cluelessness.
DYOR: Why
On social media, there is a lot of false information and divergent viewpoints. All of these facts might be accurate, but they might not be appropriate for your portfolio and investment preferences.
You become a more knowledgeable investor thanks to DYOR.
DYOR improves your portfolio's risk management.
My DYOR resources are below.
Messari: Major Blockchains' Activities
New York-based Messari provides cryptocurrency open data libraries.
Major blockchains offer 24-hour on-chain volume. https://messari.io/screener/most-active-chains-DB01F96B
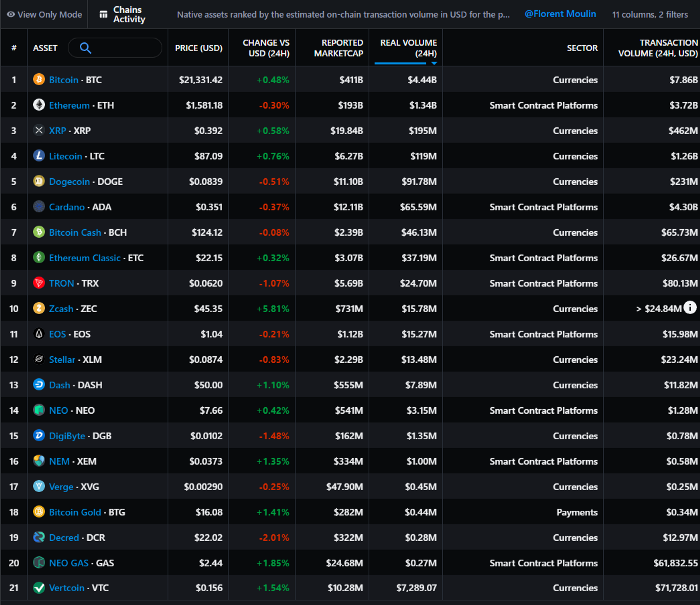
What to do
Invest in stable cryptocurrencies. Sort Messari by Real Volume (24H) or Reported Market Cap.
Coingecko: Research on Ecosystems
Top 10 Ecosystems by Coingecko are good.
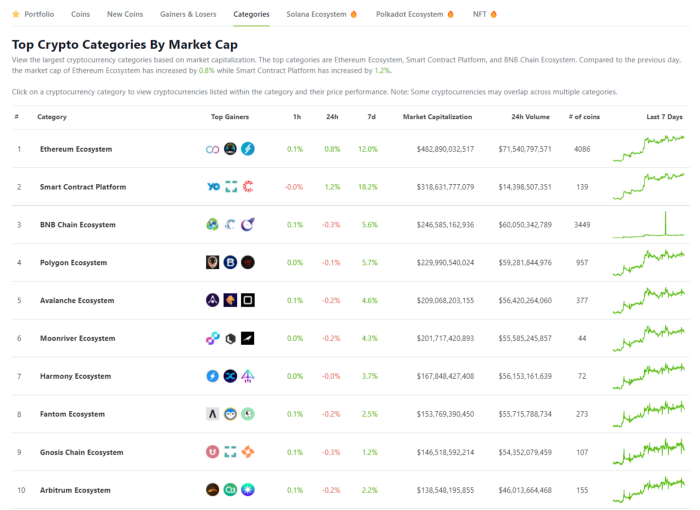
What to do
Invest in quality.
Leading ten Ecosystems by Market Cap
There are a lot of coins in the ecosystem (second last column of above chart)
CoinGecko's Market Cap Crypto Categories Market capitalization-based cryptocurrency categories. Ethereum Ecosystem www.coingecko.com
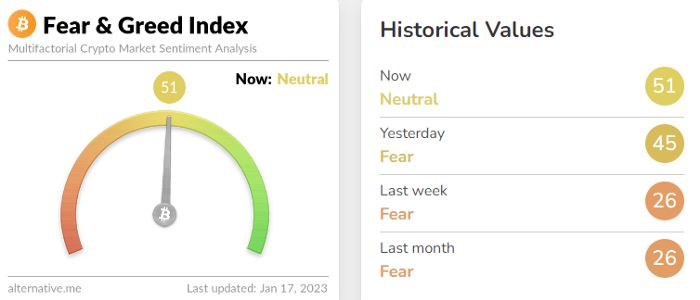
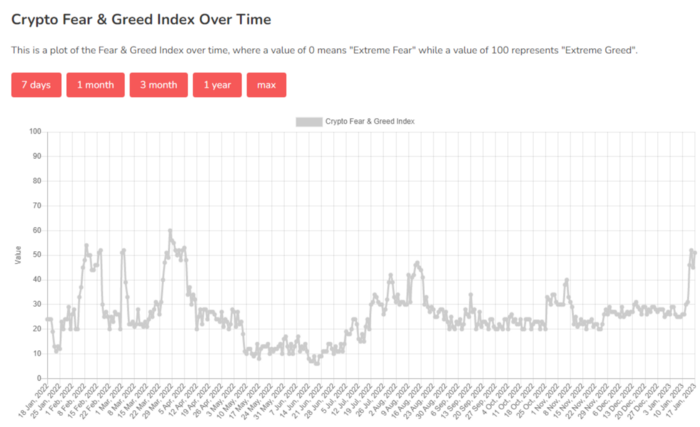
Fear & Greed Index for Bitcoin (FGI)
The Bitcoin market sentiment index ranges from 0 (extreme dread) to 100. (extreme greed).
How to Apply
See market sentiment:
Extreme fright = opportunity to buy
Extreme greed creates sales opportunity (market due for correction).
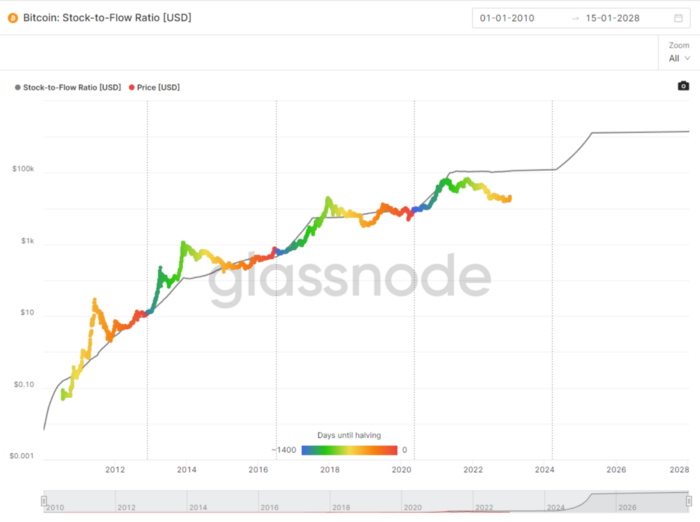
Glassnode
Glassnode gives facts, information, and confidence to make better Bitcoin, Ethereum, and cryptocurrency investments and trades.
Explore free and paid metrics.
Stock to Flow Ratio: Application
The popular Stock to Flow Ratio concept believes scarcity drives value. Stock to flow is the ratio of circulating Bitcoin supply to fresh production (i.e. newly mined bitcoins). The S/F Ratio has historically predicted Bitcoin prices. PlanB invented this metric.
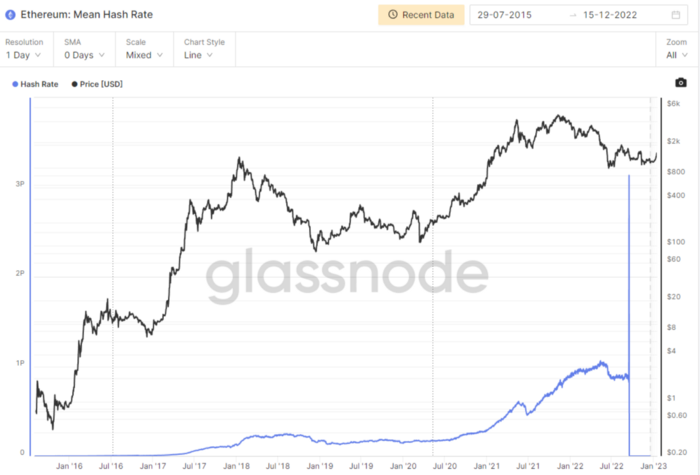
Utilization: Ethereum Hash Rate
Ethereum miners produce an estimated number of hashes per second.
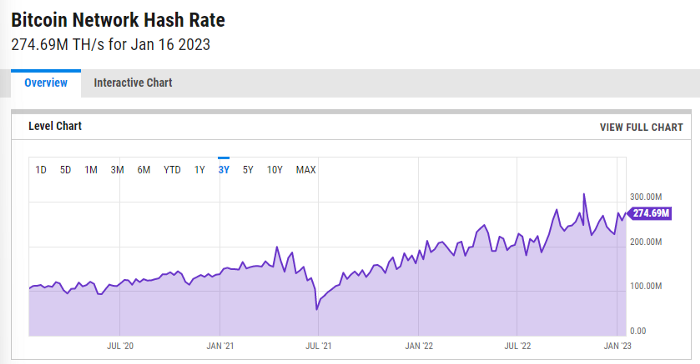
ycharts: Hash rate of the Bitcoin network
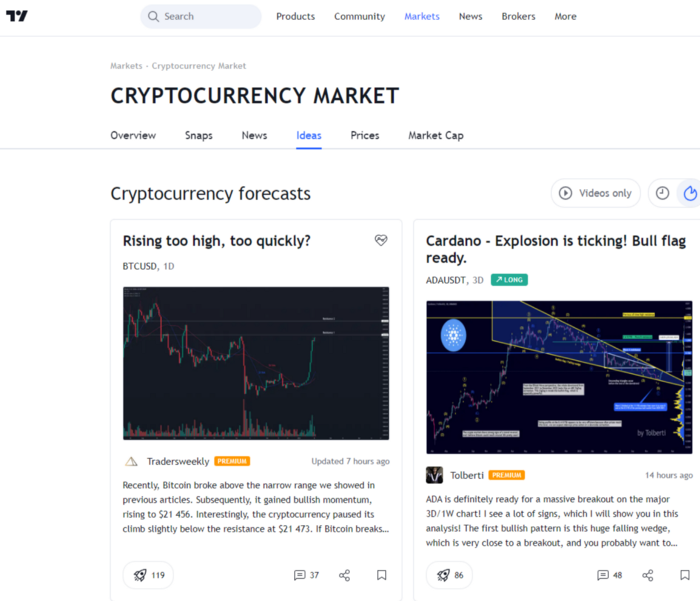
TradingView
TradingView is your go-to tool for investment analysis, watch lists, technical analysis, and recommendations from other traders/investors.
Research for a cryptocurrency project
Two key questions every successful project must ask: Q1: What is this project trying to solve? Is it a big problem or minor? Q2: How does this project make money?
Each cryptocurrency:
Check out the white paper.
check out the project's internet presence on github, twitter, and medium.
the transparency of it
Verify the team structure and founders. Verify their LinkedIn profile, academic history, and other qualifications. Search for their names with scam.
Where to purchase and use cryptocurrencies Is it traded on trustworthy exchanges?
From CoinGecko and CoinMarketCap, we may learn about market cap, circulations, and other important data.
The project must solve a problem. Solving a problem is the goal of the founders.
Avoid projects that resemble multi-level marketing or ponzi schemes.
Your use of social media
Use social media carefully or ignore it: Twitter, TradingView, and YouTube
Someone said this before and there are some truth to it. Social media bullish => short.
Your Behavior
Investigate. Spend time. You decide. Worth it!
Only you have the best interest in your financial future.
You might also like

Isaiah McCall
3 years ago
There is a new global currency emerging, but it is not bitcoin.
America should avoid BRICS

Vladimir Putin has watched videos of Muammar Gaddafi's CIA-backed demise.
Gaddafi...
Thief.
Did you know Gaddafi wanted a gold-backed dinar for Africa? Because he considered our global financial system was a Ponzi scheme, he wanted to discontinue trading oil in US dollars.
Or, Gaddafi's Libya enjoyed Africa's highest quality of living before becoming freed. Pictured:
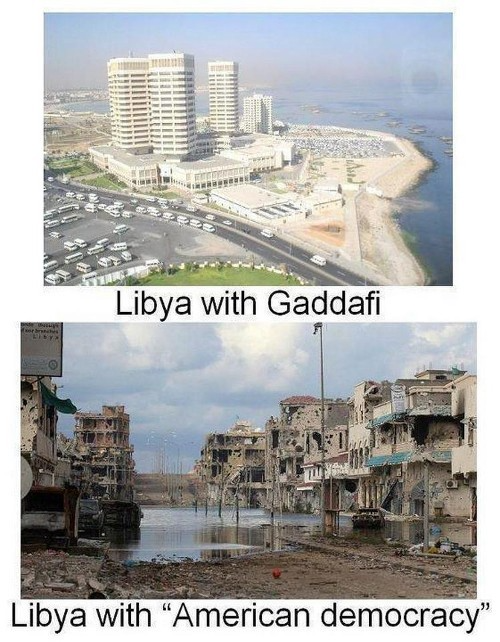
Vladimir Putin is a nasty guy, but he had his reasons for not mentioning NATO assisting Ukraine in resisting US imperialism. Nobody tells you. Sure.
The US dollar's corruption post-2008, debasement by quantitative easing, and lack of value are key factors. BRICS will replace the dollar.
BRICS aren't bricks.
Economy-related.
Brazil, Russia, India, China, and South Africa have cooperated for 14 years to fight U.S. hegemony with a new international currency: BRICS.
BRICS is mostly comical. Now. Saudi Arabia, the second-largest oil hegemon, wants to join.
So what?
The New World Currency is BRICS
Russia was kicked out of G8 for its aggressiveness in Crimea in 2014.
It's now G7.
No biggie, said Putin, he said, and I quote, “Bon appetite.”
He was prepared. China, India, and Brazil lead the New World Order.
Together, they constitute 40% of the world's population and, according to the IMF, 50% of the world's GDP by 2030.
Here’s what the BRICS president Marcos Prado Troyjo had to say earlier this year about no longer needing the US dollar: “We have implemented the mechanism of mutual settlements in rubles and rupees, and there is no need for our countries to use the dollar in mutual settlements. And today a similar mechanism of mutual settlements in rubles and yuan is being developed by China.”
Ick. That's D.C. and NYC warmongers licking their chops for WW3 nasty.
Here's a lovely picture of BRICS to relax you:
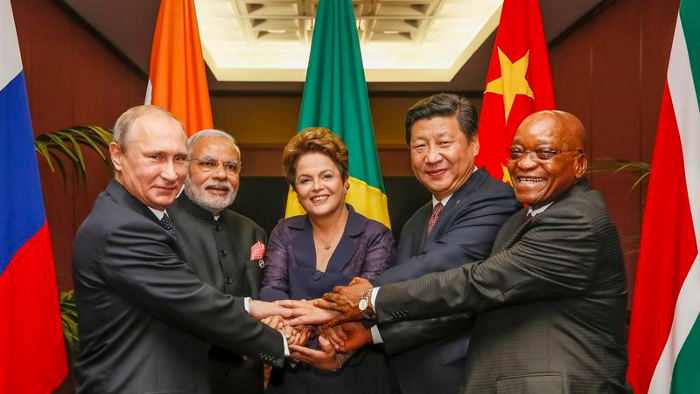
If Saudi Arabia joins BRICS, as President Mohammed Bin Salman has expressed interest, a majority of the Middle East will have joined forces to construct a new world order not based on the US currency.
I'm not sure of the new acronym.
SBRICSS? CIRBSS? CRIBSS?
The Reason America Is Harvesting What It Sowed
BRICS began 14 years ago.
14 years ago, what occurred? Concentrate. It involved CDOs, bad subprime mortgages, and Wall Street quants crunching numbers.
2008 recession
When two nations trade, they do so in US dollars, not Euros or gold.
What happened when 2008, an avoidable crisis caused by US banks' cupidity and ignorance, what happened?
Everyone WORLDWIDE felt the pain.
Mostly due to corporate America's avarice.
This should have been a warning that China and Russia had enough of our bs. Like when France sent a battleship to America after Nixon scrapped the gold standard. The US was warned to shape up or be dethroned (or at least try).

Nixon improved in 1971. Kinda. Invented PetroDollar.
Another BS system that unfairly favors America and possibly pushed Russia, China, and Saudi Arabia into BRICS.
The PetroDollar forces oil-exporting nations to trade in US dollars and invest in US Treasury bonds. Brilliant. Genius evil.
Our misdeeds are:
In conflicts that are not its concern, the USA uses the global reserve currency as a weapon.
Targeted nations abandon the dollar, and rightfully so, as do nations that depend on them for trade in vital resources.
The dollar's position as the world's reserve currency is in jeopardy, which could have disastrous economic effects.
Although we have actually sown our own doom, we appear astonished. According to the Bible, whomever sows to appease his sinful nature will reap destruction from that nature whereas whoever sows to appease the Spirit will reap eternal life from the Spirit.
Americans, even our leaders, lack caution and delayed pleasure. When our unsustainable systems fail, we double down. Bailouts of the banks in 2008 were myopic, puerile, and another nail in America's hegemony.
America has screwed everyone.
We're unpopular.
The BRICS's future
It's happened before.
Saddam Hussein sold oil in Euros in 2000, and the US invaded Iraq a month later. The media has devalued the word conspiracy. The Iraq conspiracy.
There were no WMDs, but NYT journalists like Judy Miller drove Americans into a warmongering frenzy because Saddam would ruin the PetroDollar. Does anyone recall that this war spawned ISIS?
I think America has done good for the world. You can make a convincing case that we're many people's villain.
Learn more in Confessions of an Economic Hitman, The Devil's Chessboard, or Tyranny of the Federal Reserve. Or ignore it. That's easier.
We, America, should extend an olive branch, ask for forgiveness, and learn from our faults, as the Tao Te Ching advises. Unlikely. Our population is apathetic and stupid, and our government is corrupt.
Argentina, Iran, Egypt, and Turkey have also indicated interest in joining BRICS. They're also considering making it gold-backed, making it a new world reserve currency.
You should pay attention.
Thanks for reading!

Sam Warain
3 years ago
The Brilliant Idea Behind Kim Kardashian's New Private Equity Fund
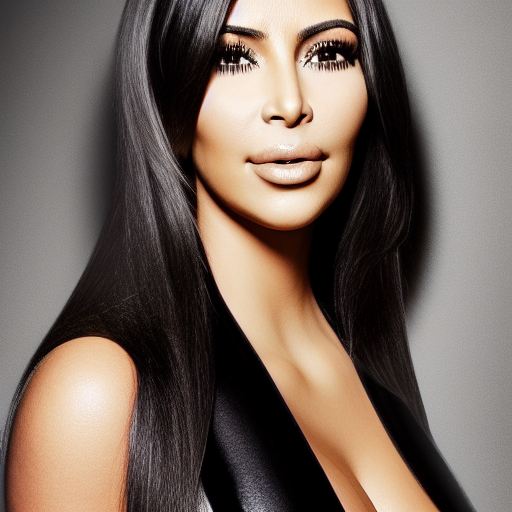
Kim Kardashian created Skky Partners. Consumer products, internet & e-commerce, consumer media, hospitality, and luxury are company targets.
Some call this another Kardashian publicity gimmick.
This maneuver is brilliance upon closer inspection. Why?
1) Kim has amassed a sizable social media fan base:
Over 320 million Instagram and 70 million Twitter users follow Kim Kardashian.
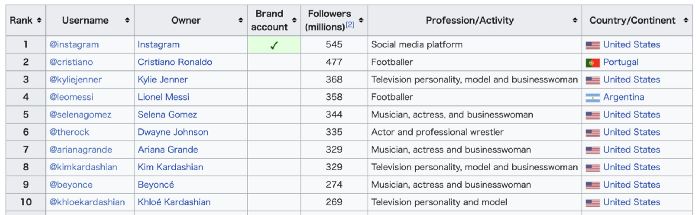
Kim Kardashian's Instagram account ranks 8th. Three Kardashians in top 10 is ridiculous.
This gives her access to consumer data. She knows what people are discussing. Investment firms need this data.
Quality, not quantity, of her followers matters. Studies suggest that her following are more engaged than Selena Gomez and Beyonce's.
Kim's followers are worth roughly $500 million to her brand, according to a research. They trust her and buy what she recommends.
2) She has a special aptitude for identifying trends.
Kim Kardashian can sense trends.
She's always ahead of fashion and beauty trends. She's always trying new things, too. She doesn't mind making mistakes when trying anything new. Her desire to experiment makes her a good business prospector.
Kim has also created a lifestyle brand that followers love. Kim is an entrepreneur, mom, and role model, not just a reality TV star or model. She's established a brand around her appearance, so people want to buy her things.
Her fragrance collection has sold over $100 million since its 2009 introduction, and her Sears apparel line did over $200 million in its first year.
SKIMS is her latest $3.2bn brand. She can establish multibillion-dollar firms with her enormous distribution platform.
Early founders would kill for Kim Kardashian's network.
Making great products is hard, but distribution is more difficult. — David Sacks, All-in-Podcast
3) She can delegate the financial choices to Jay Sammons, one of the greatest in the industry.
Jay Sammons is well-suited to develop Kim Kardashian's new private equity fund.
Sammons has 16 years of consumer investing experience at Carlyle. This will help Kardashian invest in consumer-facing enterprises.
Sammons has invested in Supreme and Beats Electronics, both of which have grown significantly. Sammons' track record and competence make him the obvious choice.
Kim Kardashian and Jay Sammons have joined forces to create a new business endeavor. The agreement will increase Kardashian's commercial empire. Sammons can leverage one of the world's most famous celebrities.
“Together we hope to leverage our complementary expertise to build the next generation consumer and media private equity firm” — Kim Kardashian
Kim Kardashian is a successful businesswoman. She developed an empire by leveraging social media to connect with fans. By developing a global lifestyle brand, she has sold things and experiences that have made her one of the world's richest celebrities.
She's a shrewd entrepreneur who knows how to maximize on herself and her image.
Imagine how much interest Kim K will bring to private equity and venture capital.
I'm curious about the company's growth.

Hasan AboulHasan
3 years ago
High attachment products can help you earn money automatically.
Affiliate marketing is a popular online moneymaker. You promote others' products and get commissions. Affiliate marketing requires constant product promotion.
Affiliate marketing can be profitable even without much promotion. Yes, this is Autopilot Money.
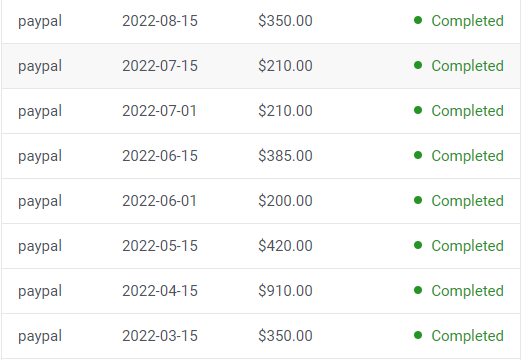
How to Pick an Affiliate Program to Generate Income Autonomously
Autopilot moneymaking requires a recurring affiliate marketing program.
Finding the best product and testing it takes a lot of time and effort.
Here are three ways to choose the best service or product to promote:
Find a good attachment-rate product or service.
When choosing a product, ask if you can easily switch to another service. Attachment rate is how much people like a product.
Higher attachment rates mean better Autopilot products.
Consider promoting GetResponse. It's a 33% recurring commission email marketing tool. This means you get 33% of the customer's plan as long as he pays.
GetResponse has a high attachment rate because it's hard to leave and start over with another tool.
2. Pick a good or service with a lot of affiliate assets.
Check if a program has affiliate assets or creatives before joining.
Images and banners to promote the product in your business.
They save time; I look for promotional creatives. Creatives or affiliate assets are website banners or images. This reduces design time.
3. Select a service or item that consumers already adore.
New products are hard to sell. Choosing a trusted company's popular product or service is helpful.
As a beginner, let people buy a product they already love.
Online entrepreneurs and digital marketers love Systeme.io. It offers tools for creating pages, email marketing, funnels, and more. This product guarantees a high ROI.
Make the product known!
Affiliate marketers struggle to get traffic. Using affiliate marketing to make money is easier than you think if you have a solid marketing strategy.
Your plan should include:
1- Publish affiliate-related blog posts and SEO-optimize them
2- Sending new visitors product-related emails
3- Create a product resource page.
4-Review products
5-Make YouTube videos with links in the description.
6- Answering FAQs about your products and services on your blog and Quora.
7- Create an eCourse on how to use this product.
8- Adding Affiliate Banners to Your Website.
With these tips, you can promote your products and make money on autopilot.