When My Remote Leadership Skills Took Off
4 Ways To Manage Remote Teams & Employees
The wheels hit the ground as I landed in Rochester.
Our six-person satellite office was now part of my team.
Their manager only reported to me the day before, but I had my ticket booked ahead of time.
I had managed remote employees before but this was different. Engineers dialed into headquarters for every meeting.
So when I learned about the org chart change, I knew a strong first impression would set the tone for everything else.
I was either their boss, or their boss's boss, and I needed them to know I was committed.
Managing a fleet of satellite freelancers or multiple offices requires treating others as more than just a face behind a screen.
You must comprehend each remote team member's perspective and daily interactions.
The good news is that you can start using these techniques right now to better understand and elevate virtual team members.
1. Make Visits To Other Offices
If budgeted, visit and work from offices where teams and employees report to you. Only by living alongside them can one truly comprehend their problems with communication and other aspects of modern life.
2. Have Others Come to You
• Having remote, distributed, or satellite employees and teams visit headquarters every quarter or semi-quarterly allows the main office culture to rub off on them.
When remote team members visit, more people get to meet them, which builds empathy.
If you can't afford to fly everyone, at least bring remote managers or leaders. Hopefully they can resurrect some culture.
3. Weekly Work From Home
No home office policy?
Make one.
WFH is a team-building, problem-solving, and office-viewing opportunity.
For dial-in meetings, I started working from home on occasion.
It also taught me which teams “forget” or “skip” calls.
As a remote team member, you experience all the issues first hand.
This isn't as accurate for understanding teams in other offices, but it can be done at any time.
4. Increase Contact Even If It’s Just To Chat
Don't underestimate office banter.
Sometimes it's about bonding and trust, other times it's about business.
If you get all this information in real-time, please forward it.
Even if nothing critical is happening, call remote team members to check in and chat.
I guarantee that building relationships and rapport will increase both their job satisfaction and yours.
More on Leadership

Aniket
3 years ago
Yahoo could have purchased Google for $1 billion
Let's see this once-dominant IT corporation crumble.

What's the capital of Kazakhstan? If you don't know the answer, you can probably find it by Googling. Google Search returned results for Nur-Sultan in 0.66 seconds.
Google is the best search engine I've ever used. Did you know another search engine ruled the Internet? I'm sure you guessed Yahoo!
Google's friendly UI and wide selection of services make it my top choice. Let's explore Yahoo's decline.
Yahoo!
YAHOO stands for Yet Another Hierarchically Organized Oracle. Jerry Yang and David Filo established Yahoo.
Yahoo is primarily a search engine and email provider. It offers News and an advertising platform. It was a popular website in 1995 that let people search the Internet directly. Yahoo began offering free email in 1997 by acquiring RocketMail.
According to a study, Yahoo used Google Search Engine technology until 2000 and then developed its own in 2004.
Yahoo! rejected buying Google for $1 billion
Larry Page and Sergey Brin, Google's founders, approached Yahoo in 1998 to sell Google for $1 billion so they could focus on their studies. Yahoo denied the offer, thinking it was overvalued at the time.
Yahoo realized its error and offered Google $3 billion in 2002, but Google demanded $5 billion since it was more valuable. Yahoo thought $5 billion was overpriced for the existing market.
In 2022, Google is worth $1.56 Trillion.
What happened to Yahoo!
Yahoo refused to buy Google, and Google's valuation rose, making a purchase unfeasible.
Yahoo started losing users when Google launched Gmail. Google's UI was far cleaner than Yahoo's.
Yahoo offered $1 billion to buy Facebook in July 2006, but Zuckerberg and the board sought $1.1 billion. Yahoo rejected, and Facebook's valuation rose, making it difficult to buy.
Yahoo was losing users daily while Google and Facebook gained many. Google and Facebook's popularity soared. Yahoo lost value daily.
Microsoft offered $45 billion to buy Yahoo in February 2008, but Yahoo declined. Microsoft increased its bid to $47 billion after Yahoo said it was too low, but Yahoo rejected it. Then Microsoft rejected Yahoo’s 10% bid increase in May 2008.
In 2015, Verizon bought Yahoo for $4.5 billion, and Apollo Global Management bought 90% of Yahoo's shares for $5 billion in May 2021. Verizon kept 10%.
Yahoo's opportunity to acquire Google and Facebook could have been a turning moment. It declined Microsoft's $45 billion deal in 2008 and was sold to Verizon for $4.5 billion in 2015. Poor decisions and lack of vision caused its downfall. Yahoo's aim wasn't obvious and it didn't stick to a single domain.
Hence, a corporation needs a clear vision and a leader who can see its future.
Liked this article? Join my tech and programming newsletter here.

Caspar Mahoney
3 years ago
Changing Your Mindset From a Project to a Product
Product game mindsets? How do these vary from Project mindset?

1950s spawned the Iron Triangle. Project people everywhere know and live by it. In stakeholder meetings, it is used to stretch the timeframe, request additional money, or reduce scope.
Quality was added to this triangle as things matured.
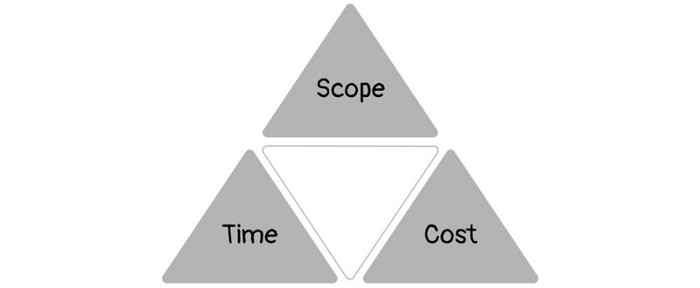
Quality was intended to be transformative, but none of these principles addressed why we conduct projects.
Value and benefits are key.
Product value is quantified by ROI, revenue, profit, savings, or other metrics. For me, every project or product delivery is about value.
Most project managers, especially those schooled 5-10 years or more ago (thousands working in huge corporations worldwide), understand the world in terms of the iron triangle. What does that imply? They worry about:
a) enough time to get the thing done.
b) have enough resources (budget) to get the thing done.
c) have enough scope to fit within (a) and (b) >> note, they never have too little scope, not that I have ever seen! although, theoretically, this could happen.
Boom—iron triangle.
To make the triangle function, project managers will utilize formal governance (Steering) to move those things. Increase money, scope, or both if time is short. Lacking funds? Increase time, scope, or both.
In current product development, shifting each item considerably may not yield value/benefit.
Even terrible. This approach will fail because it deprioritizes Value/Benefit by focusing the major stakeholders (Steering participants) and delivery team(s) on Time, Scope, and Budget restrictions.
Pre-agile, this problem was terrible. IT projects failed wildly. History is here.
Value, or benefit, is central to the product method. Product managers spend most of their time planning value-delivery paths.
Product people consider risk, schedules, scope, and budget, but value comes first. Let me illustrate.
Imagine managing internal products in an enterprise. Your core customer team needs a rapid text record of a chat to fix a problem. The consumer wants a feature/features added to a product you're producing because they think it's the greatest spot.
Project-minded, I may say;
Ok, I have budget as this is an existing project, due to run for a year. This is a new requirement to add to the features we’re already building. I think I can keep the deadline, and include this scope, as it sounds related to the feature set we’re building to give the desired result”.
This attitude repeats Scope, Time, and Budget.
Since it meets those standards, a project manager will likely approve it. If they have a backlog, they may add it and start specking it out assuming it will be built.
Instead, think like a product;
What problem does this feature idea solve? Is that problem relevant to the product I am building? Can that problem be solved quicker/better via another route ? Is it the most valuable problem to solve now? Is the problem space aligned to our current or future strategy? or do I need to alter/update the strategy?
A product mindset allows you to focus on timing, resource/cost, feasibility, feature detail, and so on after answering the aforementioned questions.
The above oversimplifies because
Leadership in discovery

Project managers are facilitators of ideas. This is as far as they normally go in the ‘idea’ space.
Business Requirements collection in classic project delivery requires extensive upfront documentation.
Agile project delivery analyzes requirements iteratively.
However, the project manager is a facilitator/planner first and foremost, therefore topic knowledge is not expected.
I mean business domain, not technical domain (to confuse matters, it is true that in some instances, it can be both technical and business domains that are important for a single individual to master).
Product managers are domain experts. They will become one if they are training/new.
They lead discovery.
Product Manager-led discovery is much more than requirements gathering.
Requirements gathering involves a Business Analyst interviewing people and documenting their requests.
The project manager calculates what fits and what doesn't using their Iron Triangle (presumably in their head) and reports back to Steering.
If this requirements-gathering exercise failed to identify requirements, what would a project manager do? or bewildered by project requirements and scope?
They would tell Steering they need a Business SME or Business Lead assigning or more of their time.
Product discovery requires the Product Manager's subject knowledge and a new mindset.
How should a Product Manager handle confusing requirements?
Product Managers handle these challenges with their talents and tools. They use their own knowledge to fill in ambiguity, but they have the discipline to validate those assumptions.
To define the problem, they may perform qualitative or quantitative primary research.
They might discuss with UX and Engineering on a whiteboard and test assumptions or hypotheses.
Do Product Managers escalate confusing requirements to Steering/Senior leaders? They would fix that themselves.
Product managers raise unclear strategy and outcomes to senior stakeholders. Open talks, soft skills, and data help them do this. They rarely raise requirements since they have their own means of handling them without top stakeholder participation.
Discovery is greenfield, exploratory, research-based, and needs higher-order stakeholder management, user research, and UX expertise.
Product Managers also aid discovery. They lead discovery. They will not leave customer/user engagement to a Business Analyst. Administratively, a business analyst could aid. In fact, many product organizations discourage business analysts (rely on PM, UX, and engineer involvement with end-users instead).
The Product Manager must drive user interaction, research, ideation, and problem analysis, therefore a Product professional must be skilled and confident.
Creating vs. receiving and having an entrepreneurial attitude

Product novices and project managers focus on details rather than the big picture. Project managers prefer spreadsheets to strategy whiteboards and vision statements.
These folks ask their manager or senior stakeholders, "What should we do?"
They then elaborate (in Jira, in XLS, in Confluence or whatever).
They want that plan populated fast because it reduces uncertainty about what's going on and who's supposed to do what.
Skilled Product Managers don't only ask folks Should we?
They're suggesting this, or worse, Senior stakeholders, here are some options. After asking and researching, they determine what value this product adds, what problems it solves, and what behavior it changes.
Therefore, to move into Product, you need to broaden your view and have courage in your ability to discover ideas, find insightful pieces of information, and collate them to form a valuable plan of action. You are constantly defining RoI and building Business Cases, so much so that you no longer create documents called Business Cases, it is simply ingrained in your work through metrics, intelligence, and insights.
Product Management is not a free lunch.
Plateless.
Plates and food must be prepared.
In conclusion, Product Managers must make at least three mentality shifts:
You put value first in all things. Time, money, and scope are not as important as knowing what is valuable.
You have faith in the field and have the ability to direct the search. YYou facilitate, but you don’t just facilitate. You wouldn't want to limit your domain expertise in that manner.
You develop concepts, strategies, and vision. You are not a waiter or an inbox where other people can post suggestions; you don't merely ask folks for opinion and record it. However, you excel at giving things that aren't clearly spoken or written down physical form.

Joseph Mavericks
4 years ago
5 books my CEO read to make $30M
Offices without books are like bodies without souls.

After 10 years, my CEO sold his company for $30 million. I've shared many of his lessons on medium. You could ask him anything at his always-open office. He also said we could use his office for meetings while he was away. When I used his office for work, I was always struck by how many books he had.
Books are useful in almost every aspect of learning. Building a business, improving family relationships, learning a new language, a new skill... Books teach, guide, and structure. Whether fiction or nonfiction, books inspire, give ideas, and develop critical thinking skills.
My CEO prefers non-fiction and attends a Friday book club. This article discusses 5 books I found in his office that impacted my life/business. My CEO sold his company for $30 million, but I've built a steady business through blogging and video making.
I recall events and lessons I learned from my CEO and how they relate to each book, and I explain how I applied the book's lessons to my business and life.
Note: This post has no affiliate links.
1. The One Thing — Gary Keller

Gary Keller, a real estate agent, wanted more customers. So he and his team brainstormed ways to get more customers. They decided to write a bestseller about work and productivity. The more people who saw the book, the more customers they'd get.
Gary Keller focused on writing the best book on productivity, work, and efficiency for months. His business experience. Keller's business grew after the book's release.
The author summarizes the book in one question.
"What's the one thing that will make everything else easier or unnecessary?"
When I started my blog and business alongside my 9–5, I quickly identified my one thing: writing. My business relied on it, so it had to be great. Without writing, there was no content, traffic, or business.
My CEO focused on funding when he started his business. Even in his final years, he spent a lot of time on the phone with investors, either to get more money or to explain what he was doing with it. My CEO's top concern was money, and the other super important factors were handled by separate teams.
Product tech and design
Incredible customer support team
Excellent promotion team
Profitable sales team
My CEO didn't always focus on one thing and ignore the rest. He was on all of those teams when I started my job. He'd start his day in tech, have lunch with marketing, and then work in sales. He was in his office on the phone at night.
He eventually realized his errors. Investors told him he couldn't do everything for the company. If needed, he had to change internally. He learned to let go, mind his own business, and focus for the next four years. Then he sold for $30 million.
The bigger your project/company/idea, the more you'll need to delegate to stay laser-focused. I started something new every few months for 10 years before realizing this. So much to do makes it easy to avoid progress. Once you identify the most important aspect of your project and enlist others' help, you'll be successful.
2. Eat That Frog — Brian Tracy
The author quote sums up book's essence:
Mark Twain said that if you eat a live frog in the morning, it's probably the worst thing that will happen to you all day. Your "frog" is the biggest, most important task you're most likely to procrastinate on.
"Frog" and "One Thing" are both about focusing on what's most important. Eat That Frog recommends doing the most important task first thing in the morning.
I shared my CEO's calendar in an article 10 months ago. Like this:

CEO's average week (some information crossed out for confidentiality)
Notice anything about 8am-8:45am? Almost every day is the same (except Friday). My CEO started his day with a management check-in for 2 reasons:
Checking in with all managers is cognitively demanding, and my CEO is a morning person.
In a young startup where everyone is busy, the morning management check-in was crucial. After 10 am, you couldn't gather all managers.
When I started my blog, writing was my passion. I'm a morning person, so I woke up at 6 am and started writing by 6:30 am every day for a year. This allowed me to publish 3 articles a week for 52 weeks to build my blog and audience. After 2 years, I'm not stopping.
3. Deep Work — Cal Newport
Deep work is focusing on a cognitively demanding task without distractions (like a morning management meeting). It helps you master complex information quickly and produce better results faster. In a competitive world 10 or 20 years ago, focus wasn't a huge advantage. Smartphones, emails, and social media made focus a rare, valuable skill.
Most people can't focus anymore. Screens light up, notifications buzz, emails arrive, Instagram feeds... Many people don't realize they're interrupted because it's become part of their normal workflow.
Cal Newport mentions Bill Gates' "Think Weeks" in Deep Work.
Microsoft CEO Bill Gates would isolate himself (often in a lakeside cottage) twice a year to read and think big thoughts.
Inside Bill's Brain on Netflix shows Newport's lakeside cottage. I've always wanted a lakeside cabin to work in. My CEO bought a lakehouse after selling his company, but now he's retired.
As a company grows, you can focus less on it. In a previous section, I said investors told my CEO to get back to basics and stop micromanaging. My CEO's commitment and ability to get work done helped save the company. His deep work and new frameworks helped us survive the corona crisis (more on this later).
The ability to deep work will be a huge competitive advantage in the next century. Those who learn to work deeply will likely be successful while everyone else is glued to their screens, Bluetooth-synced to their watches, and playing Candy Crush on their tablets.
4. The 7 Habits of Highly Effective People — Stephen R. Covey
It took me a while to start reading this book because it seemed like another shallow self-help bible. I kept finding this book when researching self-improvement. I tried it because it was everywhere.
Stephen Covey taught me 2 years ago to have a personal mission statement.
A 7 Habits mission statement describes the life you want to lead, the character traits you want to embody, and the impact you want to have on others. shortform.com
I've had many lunches with my CEO and talked about Vipassana meditation and Sunday forest runs, but I've never seen his mission statement. I'm sure his family is important, though. In the above calendar screenshot, you can see he always included family events (in green) so we could all see those time slots. We couldn't book him then. Although he never spent as much time with his family as he wanted, he always made sure to be on time for his kid's birthday rather than a conference call.
My CEO emphasized his company's mission. Your mission statement should answer 3 questions.
What does your company do?
How does it do it?
Why does your company do it?
As a graphic designer, I had to create mission-statement posters. My CEO hung posters in each office.
5. Measure What Matters — John Doerr

This book is about Andrew Grove's OKR strategy, developed in 1968. When he joined Google's early investors board, he introduced it to Larry Page and Sergey Brin. Google still uses OKR.
Objective Key Results
Objective: It explains your goals and desired outcome. When one goal is reached, another replaces it. OKR objectives aren't technical, measured, or numerical. They must be clear.
Key Result should be precise, technical, and measurable, unlike the Objective. It shows if the Goal is being worked on. Time-bound results are quarterly or yearly.
Our company almost sank several times. Sales goals were missed, management failed, and bad decisions were made. On a Monday, our CEO announced we'd implement OKR to revamp our processes.
This was a year before the pandemic, and I'm certain we wouldn't have sold millions or survived without this change. This book impacted the company the most, not just management but all levels. Organization and transparency improved. We reached realistic goals. Happy investors. We used the online tool Gtmhub to implement OKR across the organization.
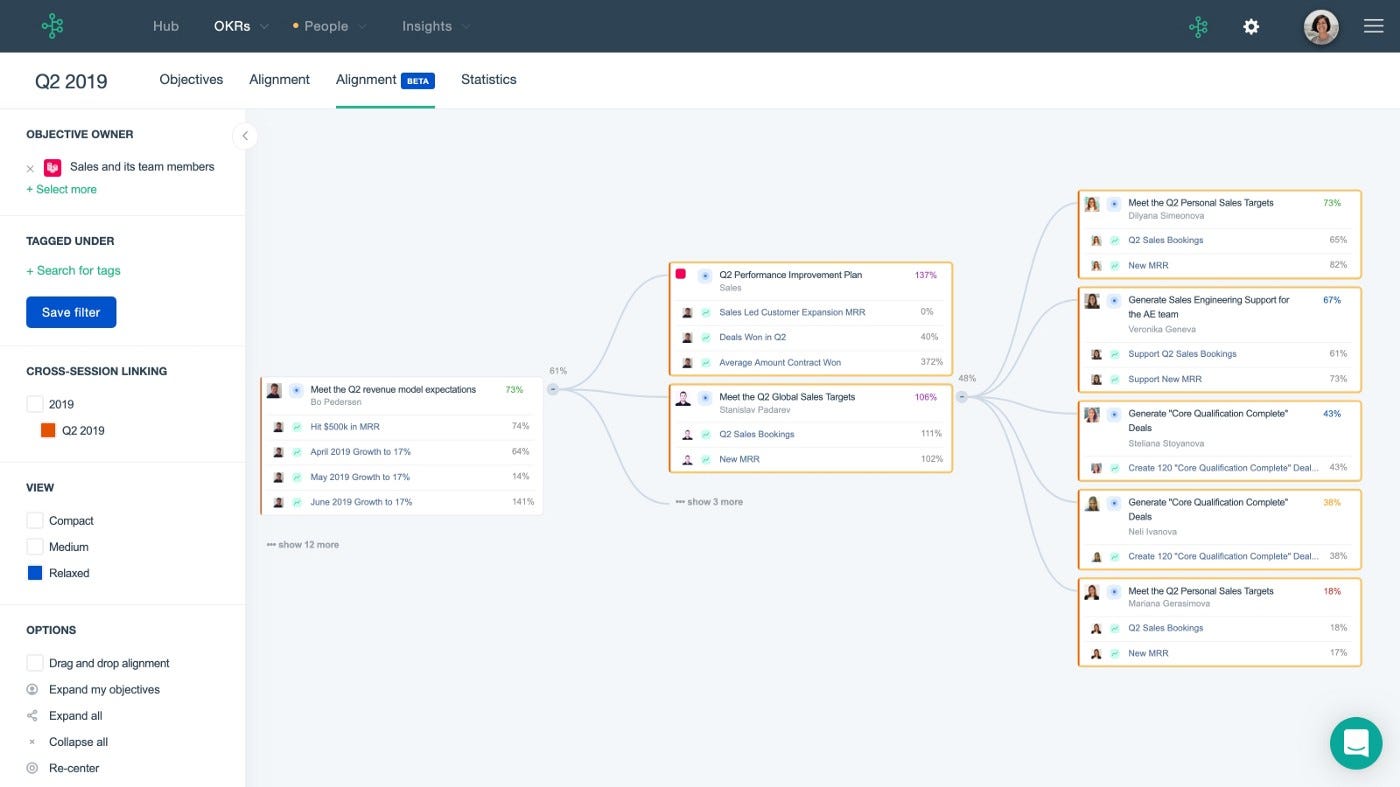
My CEO's company went from near bankruptcy to being acquired for $30 million in 2 years after implementing OKR.
I hope you enjoyed this booklist. Here's a recap of the 5 books and the lessons I learned from each.
The 7 Habits of Highly Effective People — Stephen R. Covey
Have a mission statement that outlines your goals, character traits, and impact on others.
Deep Work — Cal Newport
Focus is a rare skill; master it. Deep workers will succeed in our hyper-connected, distracted world.
The One Thing — Gary Keller
What can you do that will make everything else easier or unnecessary? Once you've identified it, focus on it.
Eat That Frog — Brian Tracy
Identify your most important task the night before and do it first thing in the morning. You'll have a lighter day.
Measure What Matters — John Doerr
On a timeline, divide each long-term goal into chunks. Divide those slices into daily tasks (your goals). Time-bound results are quarterly or yearly. Objectives aren't measured or numbered.
Thanks for reading. Enjoy the ride!
You might also like

Eitan Levy
4 years ago
The Top 8 Growth Hacking Techniques for Startups
The Top 8 Growth Hacking Techniques for Startups

These startups, and how they used growth-hack marketing to flourish, are some of the more ethical ones, while others are less so.
Before the 1970 World Cup began, Puma paid footballer Pele $120,000 to tie his shoes. The cameras naturally focused on Pele and his Pumas, causing people to realize that Puma was the top football brand in the world.
Early workers of Uber canceled over 5,000 taxi orders made on competing applications in an effort to financially hurt any of their rivals.
PayPal developed a bot that advertised cheap goods on eBay, purchased them, and paid for them with PayPal, fooling eBay into believing that customers preferred this payment option. Naturally, Paypal became eBay's primary method of payment.
Anyone renting a space on Craigslist had their emails collected by AirBnB, who then urged them to use their service instead. A one-click interface was also created to list immediately on AirBnB from Craigslist.
To entice potential single people looking for love, Tinder developed hundreds of bogus accounts of attractive people. Additionally, for at least a year, users were "accidentally" linked.
Reddit initially created a huge number of phony accounts and forced them all to communicate with one another. It eventually attracted actual users—the real meaning of "fake it 'til you make it"! Additionally, this gave Reddit control over the tone of voice they wanted for their site, which is still present today.
To disrupt the conferences of their main rival, Salesforce recruited fictitious protestors. The founder then took over all of the event's taxis and gave a 45-minute pitch for his startup. No place to hide!
When a wholesaler required a minimum purchase of 10, Amazon CEO Jeff Bezos wanted a way to purchase only one book from them. A wholesaler would deliver the one book he ordered along with an apology for the other eight books after he discovered a loophole and bought the one book before ordering nine books about lichens. On Amazon, he increased this across all of the users.
Original post available here

Nitin Sharma
3 years ago
The result of my side-hustle blog post with ChatGPT is remarkable.
It's free now.

Most content writers—including me—write about side hustles because they do well.
I wrote several articles on a profitable programming side hustle.
Later, I learnt about AI content-generating platforms like Jasper.ai and Copy.ai, which I thought were terrible because they required subscriptions and had bad content. Even I dislike automatic online posting.
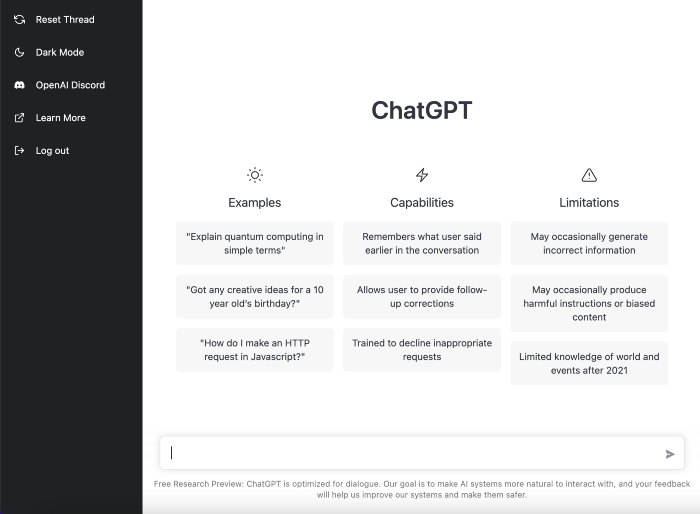
Since ChatGPT is becoming more popular, I tried it. It's free now.
Note: I wasn’t compensated to write this piece by this tool. In other words, I don’t receive any payment from their founders. There is no affiliate link, and right now it is free to use. Also, ChatGPT can do a lot more than what I ever did.
Begin.
OpenAI account registration requires visiting the website (if you don’t have one). Just write anything into the chatbot and get a response.
First, I wrote about the top 10 2023 side businesses.
This came in seconds.
2023 is shaping up to be a year of growth and opportunity for entrepreneurs and side hustlers. With the rise of remote work and the growing gig economy, there are many income streams to consider launching in the coming year. Here are the top 10 income streams to launch in 2023:
Virtual Assistant — The demand for virtual assistants is on the rise as more businesses move online. As a virtual assistant, you can offer administrative, technical, or creative services to clients remotely.
Online Tutoring — If you have expertise in a particular subject, consider becoming an online tutor. There are many platforms that connect tutors with students looking for help with their studies.
Freelance Writing — If you have a knack for writing, consider becoming a freelance writer. You can offer your services to businesses, bloggers, and individuals looking for content for their websites or social media platforms.
Graphic Design — If you have a talent for design, consider starting a graphic design side hustle. You can create logos, banners, and other visual content for businesses and individuals.
Social Media Management — Many businesses are looking for help with managing their social media accounts. As a social media manager, you can help businesses create and execute social media strategies to reach their target audience.
Dropshipping — Dropshipping is a business model where you sell products without actually holding any inventory. You can partner with suppliers and ship the products directly to the customer on behalf of the business.
Pet Sitting — If you love animals, consider starting a pet-sitting side hustle. You can offer your services to pet owners who need someone to take care of their pets while they are away.
Home Cleaning — With busy schedules, many people are looking for help with cleaning their homes. As a home cleaning service provider, you can offer your services to help keep homes tidy and organized.
Event Planning — If you have a talent for organization and planning, consider starting an event planning side hustle. You can offer your services to help plan and execute events for businesses and individuals.
Online Teaching — With the rise of online education, there is a growing demand for online teachers. If you have expertise in a particular subject, consider becoming an online teacher and offer your services to students looking for personalized instruction.
In conclusion, 2023 is shaping up to be a great year for launching new income streams. Whether you are looking to start a virtual assistant business, become an online tutor, or offer home cleaning services, there are many opportunities to turn your skills and expertise into a profitable side hustle.
Better than most online side hustle posts, right?
Write about the top 10 programming side hustles to start in 2023.
I got this.
If you are a programmer looking to start a side hustle, 2023 is the perfect time to launch your own business. With the growing demand for software and app development, there are many opportunities for programmers to turn their skills into a profitable side hustle. Here are the top 10 programming side hustles to start in 2023:
App Development — With the rise of smartphones and tablets, there is a growing demand for app development. You can offer your services to businesses and individuals looking to create custom apps for their needs.
Website Development — Many businesses and individuals are looking for help with creating and maintaining their websites. As a website developer, you can offer your services to help design, build, and manage websites for your clients.
Software Development — If you have expertise in a particular programming language, consider starting a software development side hustle. You can offer your services to businesses and individuals looking to create custom software solutions for their needs.
Game Development — The gaming industry is thriving, and there is a growing demand for game development. If you have experience in game development, you can offer your services to businesses and individuals looking to create custom games.
Data Analysis — With the rise of big data, there is a growing demand for data analysts. As a data analyst, you can offer your services to businesses and individuals looking to make sense of their data and gain insights from it.
Machine Learning — Machine learning is a rapidly growing field, and there is a growing demand for machine learning experts. If you have experience in machine learning, you can offer your services to businesses and individuals looking to develop custom machine learning solutions.
Cloud Computing — With the rise of cloud computing, there is a growing demand for cloud experts. If you have experience in cloud computing, you can offer your services to businesses and individuals looking to migrate their applications and data to the cloud.
Blockchain Development — Blockchain technology is gaining popularity, and there is a growing demand for blockchain developers. If you have experience in blockchain development, you can offer your services to businesses and individuals looking to develop custom blockchain solutions.
Artificial Intelligence — Artificial intelligence is a rapidly growing field, and there is a growing demand for AI experts. If you have experience in artificial intelligence, you can offer your services to businesses and individuals looking to develop custom AI solutions.
Virtual Reality — Virtual reality is an exciting and emerging technology, and there is a growing demand for VR developers. If you have experience in VR development, you can offer your services to businesses and individuals looking to create custom VR experiences.
In conclusion, 2023 is a great time to start a programming side hustle. Whether you are interested in app development, website development, or machine learning, there are many opportunities for programmers to turn their skills into a profitable business.
These two blogs show that AI can simplify blog authoring.
I asked some tough programming questions, and most were suitable.
The content may occasionally not be what we want, but it will almost always be very helpful to you.
Enjoy.

Scott Hickmann
3 years ago Draft
This is a draft

My wallpape