


Crypto seen as the ‘future of money’ in inflation-mired countries
Crypto as the ‘future of money' in inflation-stricken nations
Citizens of devalued currencies “need” crypto. “Nice to have” in the developed world.
According to Gemini's 2022 Global State of Crypto report, cryptocurrencies “evolved from what many considered a niche investment into an established asset class” last year.
More than half of crypto owners in Brazil (51%), Hong Kong (51%), and India (54%), according to the report, bought cryptocurrency for the first time in 2021.
The study found that inflation and currency devaluation are powerful drivers of crypto adoption, especially in emerging market (EM) countries:
“Respondents in countries that have seen a 50% or greater devaluation of their currency against the USD over the last decade were more than 5 times as likely to plan to purchase crypto in the coming year.”
Between 2011 and 2021, the real lost 218 percent of its value against the dollar, and 45 percent of Brazilians surveyed by Gemini said they planned to buy crypto in 2019.
The rand (South Africa's currency) has fallen 103 percent in value over the last decade, second only to the Brazilian real, and 32 percent of South Africans expect to own crypto in the coming year. Mexico and India, the third and fourth highest devaluation countries, followed suit.
Compared to the US dollar, Hong Kong and the UK currencies have not devalued in the last decade. Meanwhile, only 5% and 8% of those surveyed in those countries expressed interest in buying crypto.
What can be concluded? Noah Perlman, COO of Gemini, sees various crypto use cases depending on one's location.
‘Need to have' investment in countries where the local currency has devalued against the dollar, whereas in the developed world it is still seen as a ‘nice to have'.
Crypto as money substitute
As an adjunct professor at New York University School of Law, Winston Ma distinguishes between an asset used as an inflation hedge and one used as a currency replacement.
Unlike gold, he believes Bitcoin (BTC) is not a “inflation hedge”. They acted more like growth stocks in 2022. “Bitcoin correlated more closely with the S&P 500 index — and Ether with the NASDAQ — than gold,” he told Cointelegraph. But in the developing world, things are different:
“Inflation may be a primary driver of cryptocurrency adoption in emerging markets like Brazil, India, and Mexico.”
According to Justin d'Anethan, institutional sales director at the Amber Group, a Singapore-based digital asset firm, early adoption was driven by countries where currency stability and/or access to proper banking services were issues. Simply put, he said, developing countries want alternatives to easily debased fiat currencies.
“The larger flows may still come from institutions and developed countries, but the actual users may come from places like Lebanon, Turkey, Venezuela, and Indonesia.”
“Inflation is one of the factors that has and continues to drive adoption of Bitcoin and other crypto assets globally,” said Sean Stein Smith, assistant professor of economics and business at Lehman College.
But it's only one factor, and different regions have different factors, says Stein Smith. As a “instantaneously accessible, traceable, and cost-effective transaction option,” investors and entrepreneurs increasingly recognize the benefits of crypto assets. Other places promote crypto adoption due to “potential capital gains and returns”.
According to the report, “legal uncertainty around cryptocurrency,” tax questions, and a general education deficit could hinder adoption in Asia Pacific and Latin America. In Africa, 56% of respondents said more educational resources were needed to explain cryptocurrencies.
Not only inflation, but empowering our youth to live better than their parents without fear of failure or allegiance to legacy financial markets or products, said Monica Singer, ConsenSys South Africa lead. Also, “the issue of cash and remittances is huge in Africa, as is the issue of social grants.”
Money's future?
The survey found that Brazil and Indonesia had the most cryptocurrency ownership. In each country, 41% of those polled said they owned crypto. Only 20% of Americans surveyed said they owned cryptocurrency.
These markets are more likely to see cryptocurrencies as the future of money. The survey found:
“The majority of respondents in Latin America (59%) and Africa (58%) say crypto is the future of money.”
Brazil (66%), Nigeria (63%), Indonesia (61%), and South Africa (57%). Europe and Australia had the fewest believers, with Denmark at 12%, Norway at 15%, and Australia at 17%.
Will the Ukraine conflict impact adoption?
The poll was taken before the war. Will the devastating conflict slow global crypto adoption growth?
With over $100 million in crypto donations directly requested by the Ukrainian government since the war began, Stein Smith says the war has certainly brought crypto into the mainstream conversation.
“This real-world demonstration of decentralized money's power could spur wider adoption, policy debate, and increased use of crypto as a medium of exchange.”
But the war may not affect all developing nations. “The Ukraine war has no impact on African demand for crypto,” Others loom larger. “Yes, inflation, but also a lack of trust in government in many African countries, and a young demographic very familiar with mobile phones and the internet.”
A major success story like Mpesa in Kenya has influenced the continent and may help accelerate crypto adoption. Creating a plan when everyone you trust fails you is directly related to the African spirit, she said.
On the other hand, Ma views the Ukraine conflict as a sort of crisis check for cryptocurrencies. For those in emerging markets, the Ukraine-Russia war has served as a “stress test” for the cryptocurrency payment rail, he told Cointelegraph.
“These emerging markets may see the greatest future gains in crypto adoption.”
Inflation and currency devaluation are persistent global concerns. In such places, Bitcoin and other cryptocurrencies are now seen as the “future of money.” Not in the developed world, but that could change with better regulation and education. Inflation and its impact on cash holdings are waking up even Western nations.
Read original post here.
More on Web3 & Crypto

Sam Hickmann
3 years ago
Nomad.xyz got exploited for $190M
Key Takeaways:
Another hack. This time was different. This is a doozy.
Why? Nomad got exploited for $190m. It was crypto's 5th-biggest hack. Ouch.
It wasn't hackers, but random folks. What happened:
A Nomad smart contract flaw was discovered. They couldn't drain the funds at once, so they tried numerous transactions. Rookie!
People noticed and copied the attack.
They just needed to discover a working transaction, substitute the other person's address with theirs, and run it.

In a two-and-a-half-hour attack, $190M was siphoned from Nomad Bridge.
Nomad is a novel approach to blockchain interoperability that leverages an optimistic mechanism to increase the security of cross-chain communication. — nomad.xyz
This hack was permissionless, therefore anyone could participate.
After the fatal blow, people fought over the scraps.
Cross-chain bridges remain a DeFi weakness and exploit target. When they collapse, it's typically total.
$190M...gobbled.
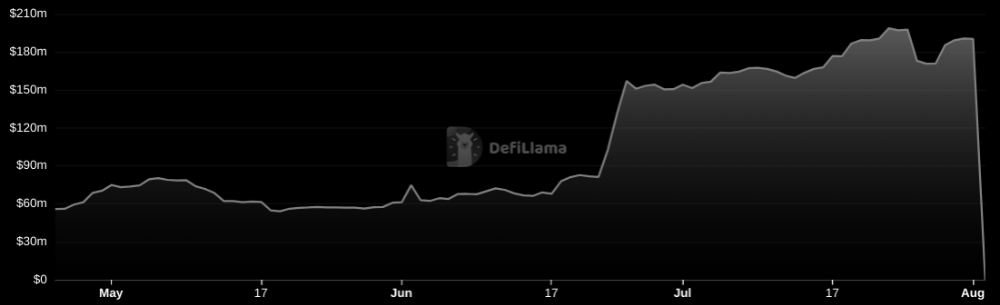
Unbacked assets are hurting Nomad-dependent chains. Moonbeam, EVMOS, and Milkomeda's TVLs dropped.
This incident is every-man-for-himself, although numerous whitehats exploited the issue...
But what triggered the feeding frenzy?
How did so many pick the bones?
After a normal upgrade in June, the bridge's Replica contract was initialized with a severe security issue. The 0x00 address was a trusted root, therefore all messages were valid by default.
After a botched first attempt (costing $350k in gas), the original attacker's exploit tx called process() without first 'proving' its validity.
The process() function executes all cross-chain messages and checks the merkle root of all messages (line 185).
The upgrade caused transactions with a'messages' value of 0 (invalid, according to old logic) to be read by default as 0x00, a trusted root, passing validation as 'proven'
Any process() calls were valid. In reality, a more sophisticated exploiter may have designed a contract to drain the whole bridge.
Copycat attackers simply copied/pasted the same process() function call using Etherscan, substituting their address.
The incident was a wild combination of crowdhacking, whitehat activities, and MEV-bot (Maximal Extractable Value) mayhem.
For example, 🍉🍉🍉. eth stole $4M from the bridge, but claims to be whitehat.

Others stood out for the wrong reasons. Repeat criminal Rari Capital (Artibrum) exploited over $3M in stablecoins, which moved to Tornado Cash.
The top three exploiters (with 95M between them) are:
$47M: 0x56D8B635A7C88Fd1104D23d632AF40c1C3Aac4e3
$40M: 0xBF293D5138a2a1BA407B43672643434C43827179
$8M: 0xB5C55f76f90Cc528B2609109Ca14d8d84593590E
Here's a list of all the exploiters:
The project conducted a Quantstamp audit in June; QSP-19 foreshadowed a similar problem.
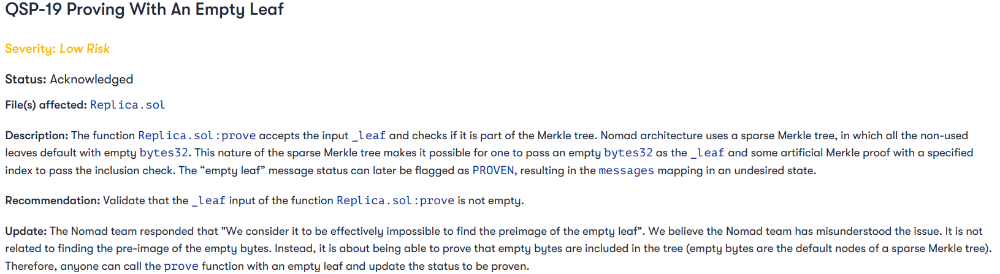
The auditor's comments that "We feel the Nomad team misinterpreted the issue" speak to a troubling attitude towards security that the project's "Long-Term Security" plan appears to confirm:

Concerns were raised about the team's response time to a live, public exploit; the team's official acknowledgement came three hours later.
"Removing the Replica contract as owner" stopped the exploit, but it was too late to preserve the cash.
Closed blockchain systems are only as strong as their weakest link.
The Harmony network is in turmoil after its bridge was attacked and lost $100M in late June.
What's next for Nomad's ecosystems?
Moonbeam's TVL is now $135M, EVMOS's is $3M, and Milkomeda's is $20M.
Loss of confidence may do more damage than $190M.
Cross-chain infrastructure is difficult to secure in a new, experimental sector. Bridge attacks can pollute an entire ecosystem or more.
Nomadic liquidity has no permanent home, so consumers will always migrate in pursuit of the "next big thing" and get stung when attentiveness wanes.
DeFi still has easy prey...
Sources: rekt.news & The Milk Road.

Faisal Khan
2 years ago
4 typical methods of crypto market manipulation

Market fraud
Due to its decentralized and fragmented character, the crypto market has integrity difficulties.
Cryptocurrencies are an immature sector, therefore market manipulation becomes a bigger issue. Many research have attempted to uncover these abuses. CryptoCompare's newest one highlights some of the industry's most typical scams.
Why are these concerns so common in the crypto market? First, even the largest centralized exchanges remain unregulated due to industry immaturity. A low-liquidity market segment makes an attack more harmful. Finally, market surveillance solutions not implemented reduce transparency.
In CryptoCompare's latest exchange benchmark, 62.4% of assessed exchanges had a market surveillance system, although only 18.1% utilised an external solution. To address market integrity, this measure must improve dramatically. Before discussing the report's malpractices, note that this is not a full list of attacks and hacks.
Clean Trading
An investor buys and sells concurrently to increase the asset's price. Centralized and decentralized exchanges show this misconduct. 23 exchanges have a volume-volatility correlation < 0.1 during the previous 100 days, according to CryptoCompares. In August 2022, Exchange A reported $2.5 trillion in artificial and/or erroneous volume, up from $33.8 billion the month before.
Spoofing
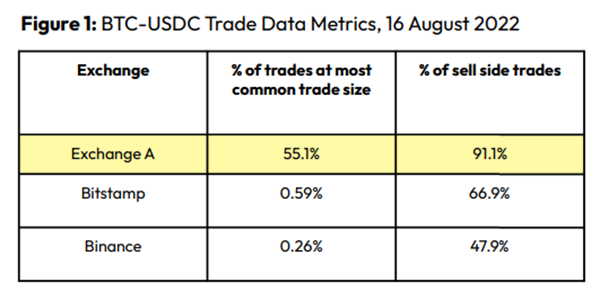
Criminals create and cancel fake orders before they can be filled. Since manipulators can hide in larger trading volumes, larger exchanges have more spoofing. A trader placed a 20.8 BTC ask order at $19,036 when BTC was trading at $19,043. BTC declined 0.13% to $19,018 in a minute. At 18:48, the trader canceled the ask order without filling it.

Front-Running
Most cryptocurrency front-running involves inside trading. Traditional stock markets forbid this. Since most digital asset information is public, this is harder. Retailers could utilize bots to front-run.
CryptoCompare found digital wallets of people who traded like insiders on exchange listings. The figure below shows excess cumulative anomalous returns (CAR) before a coin listing on an exchange.

Finally, LAYERING is a sequence of spoofs in which successive orders are put along a ladder of greater (layering offers) or lower (layering bids) values. The paper concludes with recommendations to mitigate market manipulation. Exchange data transparency, market surveillance, and regulatory oversight could reduce manipulative tactics.

CyberPunkMetalHead
3 years ago
It's all about the ego with Terra 2.0.
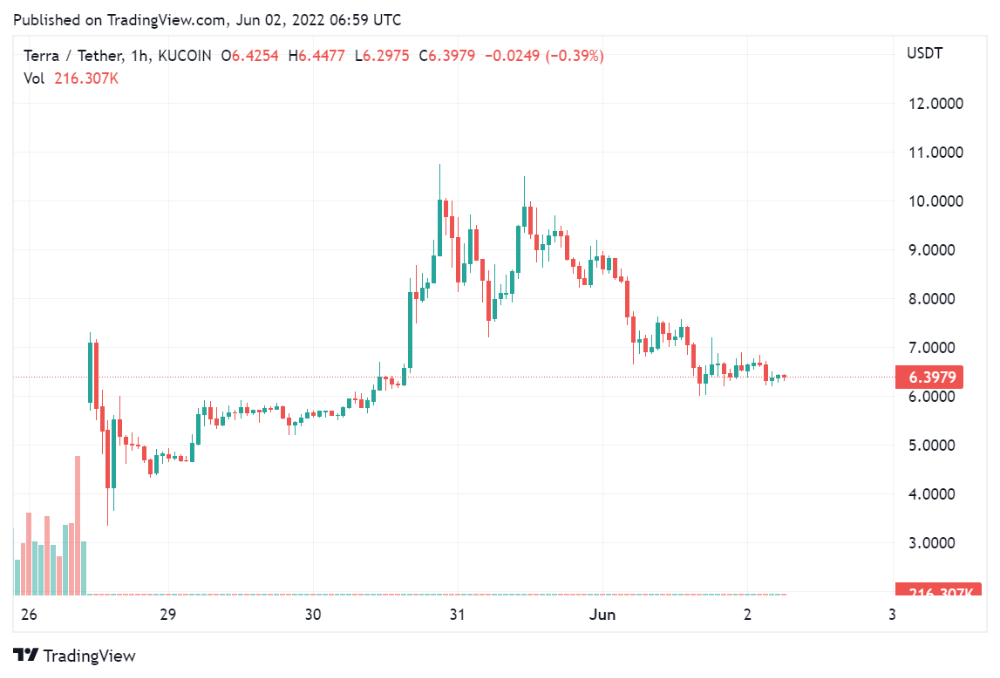
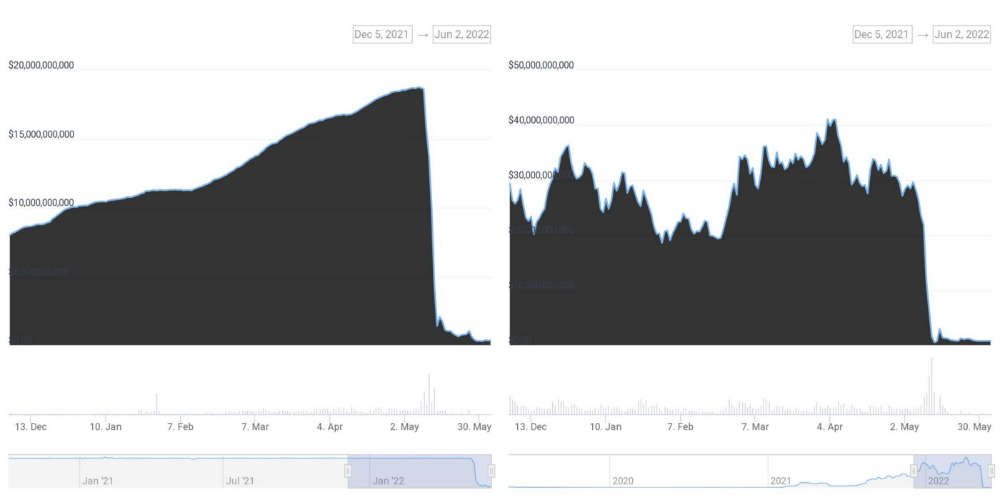
UST depegs and LUNA crashes 99.999% in a fraction of the time it takes the Moon to orbit the Earth.
Fat Man, a Terra whistle-blower, promises to expose Do Kwon's dirty secrets and shady deals.

The Terra community has voted to relaunch Terra LUNA on a new blockchain. The Terra 2.0 Pheonix-1 blockchain went live on May 28, 2022, and people were airdropped the new LUNA, now called LUNA, while the old LUNA became LUNA Classic.
Does LUNA deserve another chance? To answer this, or at least start a conversation about the Terra 2.0 chain's advantages and limitations, we must assess its fundamentals, ideology, and long-term vision.
Whatever the result, our analysis must be thorough and ruthless. A failure of this magnitude cannot happen again, so we must magnify every potential breaking point by 10.
Will UST and LUNA holders be compensated in full?
The obvious. First, and arguably most important, is to restore previous UST and LUNA holders' bags.
Terra 2.0 has 1,000,000,000,000 tokens to distribute.
25% of a community pool
Holders of pre-attack LUNA: 35%
10% of aUST holders prior to attack
Holders of LUNA after an attack: 10%
UST holders as of the attack: 20%
Every LUNA and UST holder has been compensated according to the above proposal.
According to self-reported data, the new chain has 210.000.000 tokens and a $1.3bn marketcap. LUNC and UST alone lost $40bn. The new token must fill this gap. Since launch:
LUNA holders collectively own $1b worth of LUNA if we subtract the 25% community pool airdrop from the current market cap and assume airdropped LUNA was never sold.
At the current supply, the chain must grow 40 times to compensate holders. At the current supply, LUNA must reach $240.
LUNA needs a full-on Bull Market to make LUNC and UST holders whole.
Who knows if you'll be whole? From the time you bought to the amount and price, there are too many variables to determine if Terra can cover individual losses.
The above distribution doesn't consider individual cases. Terra didn't solve individual cases. It would have been huge.
What does LUNA offer in terms of value?
UST's marketcap peaked at $18bn, while LUNC's was $41bn. LUNC and UST drove the Terra chain's value.
After it was confirmed (again) that algorithmic stablecoins are bad, Terra 2.0 will no longer support them.
Algorithmic stablecoins contributed greatly to Terra's growth and value proposition. Terra 2.0 has no product without algorithmic stablecoins.
Terra 2.0 has an identity crisis because it has no actual product. It's like Volkswagen faking carbon emission results and then stopping car production.
A project that has already lost the trust of its users and nearly all of its value cannot survive without a clear and in-demand use case.
Do Kwon, how about him?
Oh, the Twitter-caller-poor? Who challenges crypto billionaires to break his LUNA chain? Who dissolved Terra Labs South Korea before depeg? Arrogant guy?
That's not a good image for LUNA, especially when making amends. I think he should step down and let a nicer person be Terra 2.0's frontman.
The verdict
Terra has a terrific community with an arrogant, unlikeable leader. The new LUNA chain must grow 40 times before it can start making up its losses, and even then, not everyone's losses will be covered.
I won't invest in Terra 2.0 or other algorithmic stablecoins in the near future. I won't be near any Do Kwon-related project within 100 miles. My opinion.
Can Terra 2.0 be saved? Comment below.
You might also like

Sad NoCoiner
3 years ago
Two Key Money Principles You Should Understand But Were Never Taught

Prudence is advised. Be debt-free. Be frugal. Spend less.
This advice sounds nice, but it rarely works.
Most people never learn these two money rules. Both approaches will impact how you see personal finance.
It may safeguard you from inflation or the inability to preserve money.
Let’s dive in.
#1: Making long-term debt your ally
High-interest debt hurts consumers. Many credit cards carry 25% yearly interest (or more), so always pay on time. Otherwise, you’re losing money.
Some low-interest debt is good. Especially when buying an appreciating asset with borrowed money.
Inflation helps you.
If you borrow $800,000 at 3% interest and invest it at 7%, you'll make $32,000 (4%).
As money loses value, fixed payments get cheaper. Your assets' value and cash flow rise.
The never-in-debt crowd doesn't know this. They lose money paying off mortgages and low-interest loans early when they could have bought assets instead.
#2: How To Buy Or Build Assets To Make Inflation Irrelevant
Dozens of studies demonstrate actual wage growth is static; $2.50 in 1964 was equivalent to $22.65 now.
These reports never give solutions unless they're selling gold.
But there is one.
Assets beat inflation.
$100 invested into the S&P 500 would have an inflation-adjusted return of 17,739.30%.
Likewise, you can build assets from nothing. Doing is easy and quick. The returns can boost your income by 10% or more.
The people who obsess over inflation inadvertently make the problem worse for themselves. They wait for The Big Crash to buy assets. Or they moan about debt clocks and spending bills instead of seeking a solution.
Conclusion
Being ultra-prudent is like playing golf with a putter to avoid hitting the ball into the water. Sure, you might not slice a drive into the pond. But, you aren’t going to play well either. Or have very much fun.
Money has rules.
Avoiding debt or investment risks will limit your rewards. Long-term, being too cautious hurts your finances.
Disclaimer: This article is for entertainment purposes only. It is not financial advice, always do your own research.

Micah Daigle
3 years ago
Facebook is going away. Here are two explanations for why it hasn't been replaced yet.
And tips for anyone trying.

We see the same story every few years.
BREAKING NEWS: [Platform X] launched a social network. With Facebook's reputation down, the new startup bets millions will switch.
Despite the excitement surrounding each new platform (Diaspora, Ello, Path, MeWe, Minds, Vero, etc.), no major exodus occurred.
Snapchat and TikTok attracted teens with fresh experiences (ephemeral messaging and rapid-fire videos). These features aren't Facebook, even if Facebook replicated them.
Facebook's core is simple: you publish items (typically text/images) and your friends (generally people you know IRL) can discuss them.
It's cool. Sometimes I don't want to, but sh*t. I like it.
Because, well, I like many folks I've met. I enjoy keeping in touch with them and their banter.
I dislike Facebook's corporation. I've been cautiously optimistic whenever a Facebook-killer surfaced.
None succeeded.
Why? Two causes, I think:
People couldn't switch quickly enough, which is reason #1
Your buddies make a social network social.
Facebook started in self-contained communities (college campuses) then grew outward. But a new platform can't.
If we're expected to leave Facebook, we want to know that most of our friends will too.
Most Facebook-killers had bottlenecks. You have to waitlist or jump through hoops (e.g. setting up a server).
Same outcome. Upload. Chirp.
After a week or two of silence, individuals returned to Facebook.
Reason #2: The fundamental experience was different.
Even when many of our friends joined in the first few weeks, it wasn't the same.
There were missing features or a different UX.
Want to reply with a meme? No photos in comments yet. (Trying!)
Want to tag a friend? Nope, sorry. 2019!
Want your friends to see your post? You must post to all your friends' servers. Good luck!
It's difficult to introduce a platform with 100% of the same features as one that's been there for 20 years, yet customers want a core experience.
If you can't, they'll depart.
The causes that led to the causes
Having worked on software teams for 14+ years, I'm not surprised by these challenges. They are a natural development of a few tech sector meta-problems:
Lean startup methodology
Silicon Valley worships lean startup. It's a way of developing software that involves testing a stripped-down version with a limited number of people before selecting what to build.
Billion people use Facebook's functions. They aren't tested. It must work right away*
*This may seem weird to software people, but it's how non-software works! You can't sell a car without wheels.
2. Creativity
Startup entrepreneurs build new things, not copies. I understand. Reinventing the wheel is boring.
We know what works. Different experiences raise adoption friction. Once millions have transferred, more features (and a friendlier UX) can be implemented.
3. Cost scaling
True. Building a product that can sustain hundreds of millions of users in weeks is expensive and complex.
Your lifeboats must have the same capacity as the ship you're evacuating. It's required.
4. Pure ideologies
People who work on Facebook-alternatives are (understandably) critical of Facebook.
They build an open-source, fully-distributed, data-portable, interface-customizable, offline-capable, censorship-proof platform.
Prioritizing these aims can prevent replicating the straightforward experience users expect. Github, not Facebook, is for techies only.
What about the business plan, though?
Facebook-killer attempts have followed three models.
Utilize VC funding to increase your user base, then monetize them later. (If you do this, you won't kill Facebook; instead, Facebook will become you.)
Users must pay to utilize it. (This causes a huge bottleneck and slows the required quick expansion, preventing it from seeming like a true social network.)
Make it a volunteer-run, open-source endeavor that is free. (This typically denotes that something is cumbersome, difficult to operate, and is only for techies.)
Wikipedia is a fourth way.
Wikipedia is one of the most popular websites and a charity. No ads. Donations support them.
A Facebook-killer managed by a good team may gather millions (from affluent contributors and the crowd) for their initial phase of development. Then it might sustain on regular donations, ethical transactions (e.g. fees on commerce, business sites, etc.), and government grants/subsidies (since it would essentially be a public utility).
When you're not aiming to make investors rich, it's remarkable how little money you need.
If you want to build a Facebook competitor, follow these tips:
Drop the lean startup philosophy. Wait until you have a finished product before launching. Build it, thoroughly test it for bugs, and then release it.
Delay innovating. Wait till millions of people have switched before introducing your great new features. Make it nearly identical for now.
Spend money climbing. Make sure that guests can arrive as soon as they are invited. Never keep them waiting. Make things easy for them.
Make it accessible to all. Even if doing so renders it less philosophically pure, it shouldn't require technical expertise to utilize.
Constitute a nonprofit. Additionally, develop community ownership structures. Profit maximization is not the only strategy for preserving valued assets.
Last thoughts
Nobody has killed Facebook, but Facebook is killing itself.
The startup is burying the newsfeed to become a TikTok clone. Meta itself seems to be ditching the platform for the metaverse.
I wish I was happy, but I'm not. I miss (understandably) removed friends' postings and remarks. It could be a ghost town in a few years. My dance moves aren't TikTok-worthy.
Who will lead? It's time to develop a social network for the people.
Greetings if you're working on it. I'm not a company founder, but I like to help hard-working folks.

Pen Magnet
3 years ago
Why Google Staff Doesn't Work

Sundar Pichai unveiled Simplicity Sprint at Google's latest all-hands conference.
To boost employee efficiency.
Not surprising. Few envisioned Google declaring a productivity drive.
Sunder Pichai's speech:
“There are real concerns that our productivity as a whole is not where it needs to be for the head count we have. Help me create a culture that is more mission-focused, more focused on our products, more customer focused. We should think about how we can minimize distractions and really raise the bar on both product excellence and productivity.”
The primary driver driving Google's efficiency push is:
Google's efficiency push follows 13% quarterly revenue increase. Last year in the same quarter, it was 62%.
Market newcomers may argue that the previous year's figure was fuelled by post-Covid reopening and growing consumer spending. Investors aren't convinced. A promising company like Google can't afford to drop so quickly.
Google’s quarterly revenue growth stood at 13%, against 62% in last year same quarter.
Google isn't alone. In my recent essay regarding 2025 programmers, I warned about the economic downturn's effects on FAAMG's workforce. Facebook had suspended hiring, and Microsoft had promised hefty bonuses for loyal staff.
In the same article, I predicted Google's troubles. Online advertising, especially the way Google and Facebook sell it using user data, is over.
FAAMG and 2nd rung IT companies could be the first to fall without Post-COVID revival and uncertain global geopolitics.
Google has hardly ever discussed effectiveness:
Apparently openly.
Amazon treats its employees like robots, even in software positions. It has significant turnover and a terrible reputation as a result. Because of this, it rarely loses money due to staff productivity.
Amazon trumps Google. In reality, it treats its employees poorly.
Google was the founding father of the modern-day open culture.
Larry and Sergey Google founded the IT industry's Open Culture. Silicon Valley called Google's internal democracy and transparency near anarchy. Management rarely slammed decisions on employees. Surveys and internal polls ensured everyone knew the company's direction and had a vote.
20% project allotment (weekly free time to build own project) was Google's open-secret innovation component.
After Larry and Sergey's exit in 2019, this is Google's first profitability hurdle. Only Google insiders can answer these questions.
Would Google's investors compel the company's management to adopt an Amazon-style culture where the developers are treated like circus performers?
If so, would Google follow suit?
If so, how does Google go about doing it?
Before discussing Google's likely plan, let's examine programming productivity.
What determines a programmer's productivity is simple:
How would we answer Google's questions?
As a programmer, I'm more concerned about Simplicity Sprint's aftermath than its economic catalysts.
Large organizations don't care much about quarterly and annual productivity metrics. They have 10-year product-launch plans. If something seems horrible today, it's likely due to someone's lousy judgment 5 years ago who is no longer in the blame game.
Deconstruct our main question.
How exactly do you change the culture of the firm so that productivity increases?
How can you accomplish that without affecting your capacity to profit? There are countless ways to increase output without decreasing profit.
How can you accomplish this with little to no effect on employee motivation? (While not all employers care about it, in this case we are discussing the father of the open company culture.)
How do you do it for a 10-developer IT firm that is losing money versus a 1,70,000-developer organization with a trillion-dollar valuation?
When implementing a large-scale organizational change, success must be carefully measured.
The fastest way to do something is to do it right, no matter how long it takes.
You require clearly-defined group/team/role segregation and solid pass/fail matrices to:
You can give performers rewards.
Ones that are average can be inspired to improve
Underachievers may receive assistance or, in the worst-case scenario, rehabilitation
As a 20-year programmer, I associate productivity with greatness.
Doing something well, no matter how long it takes, is the fastest way to do it.
Let's discuss a programmer's productivity.
Why productivity is a strange term in programming:
Productivity is work per unit of time.
Money=time This is an economic proverb. More hours worked, more pay. Longer projects cost more.
As a buyer, you desire a quick supply. As a business owner, you want employees who perform at full capacity, creating more products to transport and boosting your profits.
All economic matrices encourage production because of our obsession with it. Productivity is the only organic way a nation may increase its GDP.
Time is money — is not just a proverb, but an economical fact.
Applying the same productivity theory to programming gets problematic. An automating computer. Its capacity depends on the software its master writes.
Today, a sophisticated program can process a billion records in a few hours. Creating one takes a competent coder and the necessary infrastructure. Learning, designing, coding, testing, and iterations take time.
Programming productivity isn't linear, unlike manufacturing and maintenance.
Average programmers produce code every day yet miss deadlines. Expert programmers go days without coding. End of sprint, they often surprise themselves by delivering fully working solutions.
Reversing the programming duties has no effect. Experts aren't needed for productivity.
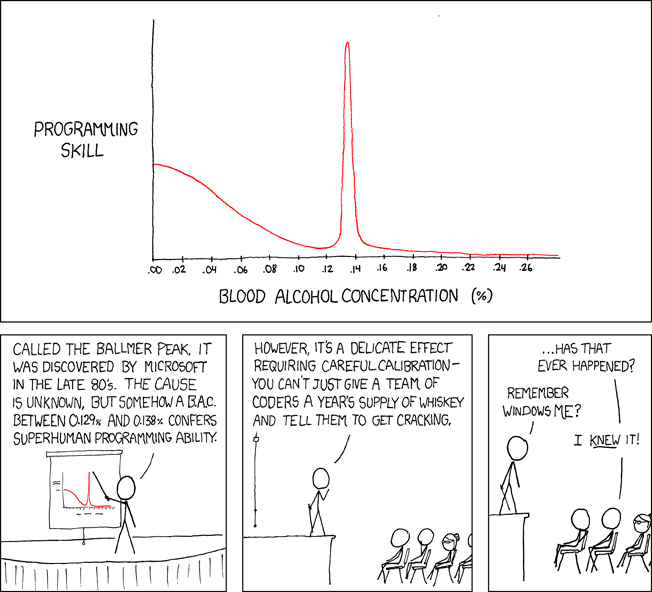
These patterns remind me of an XKCD comic.
Programming productivity depends on two factors:
The capacity of the programmer and his or her command of the principles of computer science
His or her productive bursts, how often they occur, and how long they last as they engineer the answer
At some point, productivity measurement becomes Schrödinger’s cat.
Product companies measure productivity using use cases, classes, functions, or LOCs (lines of code). In days of data-rich source control systems, programmers' merge requests and/or commits are the most preferred yardstick. Companies assess productivity by tickets closed.
Every organization eventually has trouble measuring productivity. Finer measurements create more chaos. Every measure compares apples to oranges (or worse, apples with aircraft.) On top of the measuring overhead, the endeavor causes tremendous and unnecessary stress on teams, lowering their productivity and defeating its purpose.
Macro productivity measurements make sense. Amazon's factory-era management has done it, but at great cost.
Google can pull it off if it wants to.
What Google meant in reality when it said that employee productivity has decreased:
When Google considers its employees unproductive, it doesn't mean they don't complete enough work in the allotted period.
They can't multiply their work's influence over time.
Programmers who produce excellent modules or products are unsure on how to use them.
The best data scientists are unable to add the proper parameters in their models.
Despite having a great product backlog, managers struggle to recruit resources with the necessary skills.
Product designers who frequently develop and A/B test newer designs are unaware of why measures are inaccurate or whether they have already reached the saturation point.
Most ignorant: All of the aforementioned positions are aware of what to do with their deliverables, but neither their supervisors nor Google itself have given them sufficient authority.
So, Google employees aren't productive.
How to fix it?
Business analysis: White suits introducing novel items can interact with customers from all regions. Track analytics events proactively, especially the infrequent ones.
SOLID, DRY, TEST, and AUTOMATION: Do less + reuse. Use boilerplate code creation. If something already exists, don't implement it yourself.
Build features-building capabilities: N features are created by average programmers in N hours. An endless number of features can be built by average programmers thanks to the fact that expert programmers can produce 1 capability in N hours.
Work on projects that will have a positive impact: Use the same algorithm to search for images on YouTube rather than the Mars surface.
Avoid tasks that can only be measured in terms of time linearity at all costs (if a task can be completed in N minutes, then M copies of the same task would cost M*N minutes).
In conclusion:
Software development isn't linear. Why should the makers be measured?
Notation for The Big O
I'm discussing a new way to quantify programmer productivity. (It applies to other professions, but that's another subject)
The Big O notation expresses the paradigm (the algorithmic performance concept programmers rot to ace their Google interview)
Google (or any large corporation) can do this.
Sort organizational roles into categories and specify their impact vs. time objectives. A CXO role's time vs. effect function, for instance, has a complexity of O(log N), meaning that if a CEO raises his or her work time by 8x, the result only increases by 3x.
Plot the influence of each employee over time using the X and Y axes, respectively.
Add a multiplier for Y-axis values to the productivity equation to make business objectives matter. (Example values: Support = 5, Utility = 7, and Innovation = 10).
Compare employee scores in comparable categories (developers vs. devs, CXOs vs. CXOs, etc.) and reward or help employees based on whether they are ahead of or behind the pack.
After measuring every employee's inventiveness, it's straightforward to help underachievers and praise achievers.
Example of a Big(O) Category:
If I ran Google (God forbid, its worst days are far off), here's how I'd classify it. You can categorize Google employees whichever you choose.
The Google interview truth:
O(1) < O(log n) < O(n) < O(n log n) < O(n^x) where all logarithmic bases are < n.
O(1): Customer service workers' hours have no impact on firm profitability or customer pleasure.
CXOs Most of their time is spent on travel, strategic meetings, parties, and/or meetings with minimal floor-level influence. They're good at launching new products but bad at pivoting without disaster. Their directions are being followed.
Devops, UX designers, testers Agile projects revolve around deployment. DevOps controls the levers. Their automation secures results in subsequent cycles.
UX/UI Designers must still prototype UI elements despite improved design tools.
All test cases are proportional to use cases/functional units, hence testers' work is O(N).
Architects Their effort improves code quality. Their right/wrong interference affects product quality and rollout decisions even after the design is set.
Core Developers Only core developers can write code and own requirements. When people understand and own their labor, the output improves dramatically. A single character error can spread undetected throughout the SDLC and cost millions.
Core devs introduce/eliminate 1000x bugs, refactoring attempts, and regression. Following our earlier hypothesis.
The fastest way to do something is to do it right, no matter how long it takes.
Conclusion:
Google is at the liberal extreme of the employee-handling spectrum
Microsoft faced an existential crisis after 2000. It didn't choose Amazon's data-driven people management to revitalize itself.
Instead, it entrusted developers. It welcomed emerging technologies and opened up to open source, something it previously opposed.
Google is too lax in its employee-handling practices. With that foundation, it can only follow Amazon, no matter how carefully.
Any attempt to redefine people's measurements will affect the organization emotionally.
The more Google compares apples to apples, the higher its chances for future rebirth.