

More on Web3 & Crypto

Shan Vernekar
3 years ago
How the Ethereum blockchain's transactions are carried out
Overview
Ethereum blockchain is a network of nodes that validate transactions. Any network node can be queried for blockchain data for free. To write data as a transition requires processing and writing to each network node's storage. Fee is paid in ether and is also called as gas.
We'll examine how user-initiated transactions flow across the network and into the blockchain.
Flow of transactions
A user wishes to move some ether from one external account to another. He utilizes a cryptocurrency wallet for this (like Metamask), which is a browser extension.
The user enters the desired transfer amount and the external account's address. He has the option to choose the transaction cost he is ready to pay.
Wallet makes use of this data, signs it with the user's private key, and writes it to an Ethereum node. Services such as Infura offer APIs that enable writing data to nodes. One of these services is used by Metamask. An example transaction is shown below. Notice the “to” address and value fields.
var rawTxn = {
    nonce: web3.toHex(txnCount),
    gasPrice: web3.toHex(100000000000),
    gasLimit: web3.toHex(140000),
    to: '0x633296baebc20f33ac2e1c1b105d7cd1f6a0718b',
    value: web3.toHex(0),
    data: '0xcc9ab24952616d6100000000000000000000000000000000000000000000000000000000'
};
The transaction is written to the target Ethereum node's local TRANSACTION POOL. It informed surrounding nodes of the new transaction, and those nodes reciprocated. Eventually, this transaction is received by and written to each node's local TRANSACTION pool.
The miner who finds the following block first adds pending transactions (with a higher gas cost) from the nearby TRANSACTION POOL to the block.
The transactions written to the new block are verified by other network nodes.
A block is added to the main blockchain after there is consensus and it is determined to be genuine. The local blockchain is updated with the new node by additional nodes as well.
Block mining begins again next.
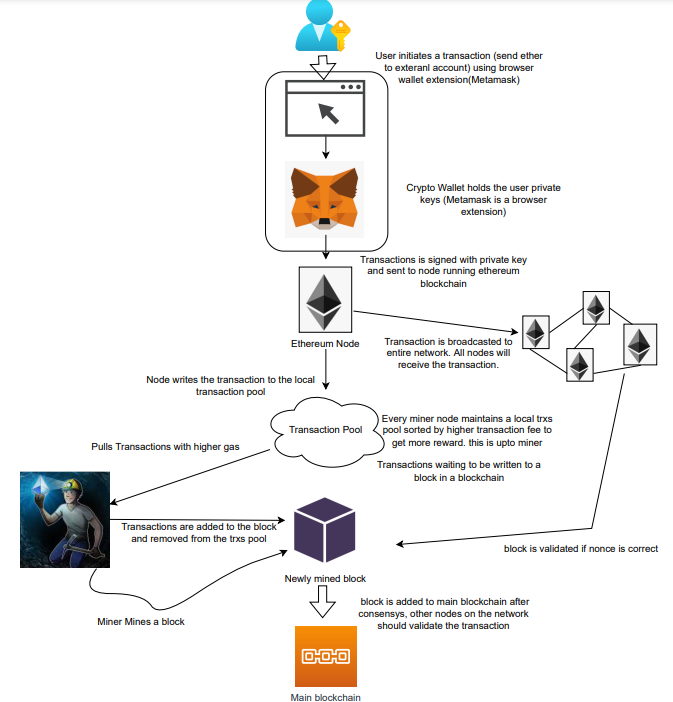
The image above shows how transactions go via the network and what's needed to submit them to the main block chain.
References
ethereum.org/transactions How Ethereum transactions function, their data structure, and how to send them via app. ethereum.org

Farhan Ali Khan
2 years ago
Introduction to Zero-Knowledge Proofs: The Art of Proving Without Revealing
Zero-Knowledge Proofs for Beginners
Published here originally.
Introduction
I Spy—did you play as a kid? One person chose a room object, and the other had to guess it by answering yes or no questions. I Spy was entertaining, but did you know it could teach you cryptography?
Zero Knowledge Proofs let you show your pal you know what they picked without exposing how. Math replaces electronics in this secret spy mission. Zero-knowledge proofs (ZKPs) are sophisticated cryptographic tools that allow one party to prove they have particular knowledge without revealing it. This proves identification and ownership, secures financial transactions, and more. This article explains zero-knowledge proofs and provides examples to help you comprehend this powerful technology.
What is a Proof of Zero Knowledge?
Zero-knowledge proofs prove a proposition is true without revealing any other information. This lets the prover show the verifier that they know a fact without revealing it. So, a zero-knowledge proof is like a magician's trick: the prover proves they know something without revealing how or what. Complex mathematical procedures create a proof the verifier can verify.
Want to find an easy way to test it out? Try out with tis awesome example! ZK Crush
Describe it as if I'm 5
Alex and Jack found a cave with a center entrance that only opens when someone knows the secret. Alex knows how to open the cave door and wants to show Jack without telling him.
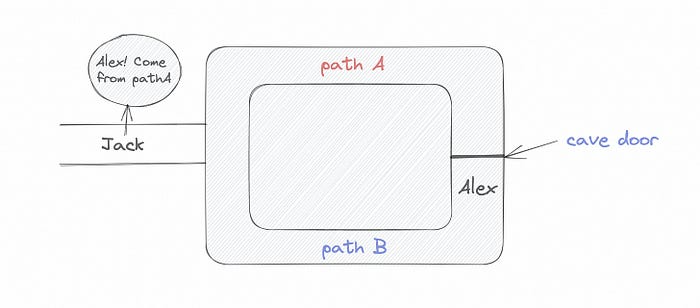
Alex and Jack name both pathways (let’s call them paths A and B).
In the first phase, Alex is already inside the cave and is free to select either path, in this case A or B.
As Alex made his decision, Jack entered the cave and asked him to exit from the B path.
Jack can confirm that Alex really does know the key to open the door because he came out for the B path and used it.
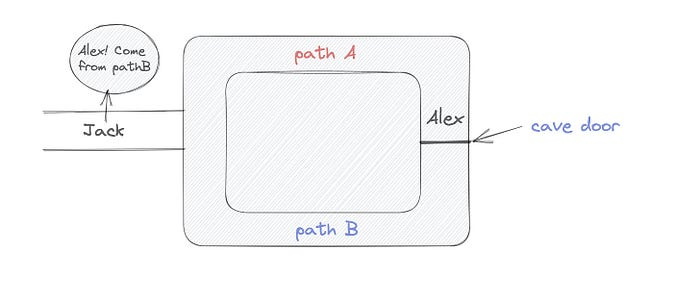
To conclude, Alex and Jack repeat:
Alex walks into the cave.
Alex follows a random route.
Jack walks into the cave.
Alex is asked to follow a random route by Jack.
Alex follows Jack's advice and heads back that way.
What is a Zero Knowledge Proof?
At a high level, the aim is to construct a secure and confidential conversation between the prover and the verifier, where the prover convinces the verifier that they have the requisite information without disclosing it. The prover and verifier exchange messages and calculate in each round of the dialogue.
The prover uses their knowledge to prove they have the information the verifier wants during these rounds. The verifier can verify the prover's truthfulness without learning more by checking the proof's mathematical statement or computation.
Zero knowledge proofs use advanced mathematical procedures and cryptography methods to secure communication. These methods ensure the evidence is authentic while preventing the prover from creating a phony proof or the verifier from extracting unnecessary information.
ZK proofs require examples to grasp. Before the examples, there are some preconditions.
Criteria for Proofs of Zero Knowledge
Completeness: If the proposition being proved is true, then an honest prover will persuade an honest verifier that it is true.
Soundness: If the proposition being proved is untrue, no dishonest prover can persuade a sincere verifier that it is true.
Zero-knowledge: The verifier only realizes that the proposition being proved is true. In other words, the proof only establishes the veracity of the proposition being supported and nothing more.
The zero-knowledge condition is crucial. Zero-knowledge proofs show only the secret's veracity. The verifier shouldn't know the secret's value or other details.
Example after example after example
To illustrate, take a zero-knowledge proof with several examples:
Initial Password Verification Example
You want to confirm you know a password or secret phrase without revealing it.
Use a zero-knowledge proof:
You and the verifier settle on a mathematical conundrum or issue, such as figuring out a big number's components.
The puzzle or problem is then solved using the hidden knowledge that you have learned. You may, for instance, utilize your understanding of the password to determine the components of a particular number.
You provide your answer to the verifier, who can assess its accuracy without knowing anything about your private data.
You go through this process several times with various riddles or issues to persuade the verifier that you actually are aware of the secret knowledge.
You solved the mathematical puzzles or problems, proving to the verifier that you know the hidden information. The proof is zero-knowledge since the verifier only sees puzzle solutions, not the secret information.
In this scenario, the mathematical challenge or problem represents the secret, and solving it proves you know it. The evidence does not expose the secret, and the verifier just learns that you know it.
My simple example meets the zero-knowledge proof conditions:
Completeness: If you actually know the hidden information, you will be able to solve the mathematical puzzles or problems, hence the proof is conclusive.
Soundness: The proof is sound because the verifier can use a publicly known algorithm to confirm that your answer to the mathematical conundrum or difficulty is accurate.
Zero-knowledge: The proof is zero-knowledge because all the verifier learns is that you are aware of the confidential information. Beyond the fact that you are aware of it, the verifier does not learn anything about the secret information itself, such as the password or the factors of the number. As a result, the proof does not provide any new insights into the secret.
Explanation #2: Toss a coin.
One coin is biased to come up heads more often than tails, while the other is fair (i.e., comes up heads and tails with equal probability). You know which coin is which, but you want to show a friend you can tell them apart without telling them.
Use a zero-knowledge proof:
One of the two coins is chosen at random, and you secretly flip it more than once.
You show your pal the following series of coin flips without revealing which coin you actually flipped.
Next, as one of the two coins is flipped in front of you, your friend asks you to tell which one it is.
Then, without revealing which coin is which, you can use your understanding of the secret order of coin flips to determine which coin your friend flipped.
To persuade your friend that you can actually differentiate between the coins, you repeat this process multiple times using various secret coin-flipping sequences.
In this example, the series of coin flips represents the knowledge of biased and fair coins. You can prove you know which coin is which without revealing which is biased or fair by employing a different secret sequence of coin flips for each round.
The evidence is zero-knowledge since your friend does not learn anything about which coin is biased and which is fair other than that you can tell them differently. The proof does not indicate which coin you flipped or how many times you flipped it.
The coin-flipping example meets zero-knowledge proof requirements:
Completeness: If you actually know which coin is biased and which is fair, you should be able to distinguish between them based on the order of coin flips, and your friend should be persuaded that you can.
Soundness: Your friend may confirm that you are correctly recognizing the coins by flipping one of them in front of you and validating your answer, thus the proof is sound in that regard. Because of this, your acquaintance can be sure that you are not just speculating or picking a coin at random.
Zero-knowledge: The argument is that your friend has no idea which coin is biased and which is fair beyond your ability to distinguish between them. Your friend is not made aware of the coin you used to make your decision or the order in which you flipped the coins. Consequently, except from letting you know which coin is biased and which is fair, the proof does not give any additional information about the coins themselves.
Figure out the prime number in Example #3.
You want to prove to a friend that you know their product n=pq without revealing p and q. Zero-knowledge proof?
Use a variant of the RSA algorithm. Method:
You determine a new number s = r2 mod n by computing a random number r.
You email your friend s and a declaration that you are aware of the values of p and q necessary for n to equal pq.
A random number (either 0 or 1) is selected by your friend and sent to you.
You send your friend r as evidence that you are aware of the values of p and q if e=0. You calculate and communicate your friend's s/r if e=1.
Without knowing the values of p and q, your friend can confirm that you know p and q (in the case where e=0) or that s/r is a legitimate square root of s mod n (in the situation where e=1).
This is a zero-knowledge proof since your friend learns nothing about p and q other than their product is n and your ability to verify it without exposing any other information. You can prove that you know p and q by sending r or by computing s/r and sending that instead (if e=1), and your friend can verify that you know p and q or that s/r is a valid square root of s mod n without learning anything else about their values. This meets the conditions of completeness, soundness, and zero-knowledge.
Zero-knowledge proofs satisfy the following:
Completeness: The prover can demonstrate this to the verifier by computing q = n/p and sending both p and q to the verifier. The prover also knows a prime number p and a factorization of n as p*q.
Soundness: Since it is impossible to identify any pair of numbers that correctly factorize n without being aware of its prime factors, the prover is unable to demonstrate knowledge of any p and q that do not do so.
Zero knowledge: The prover only admits that they are aware of a prime number p and its associated factor q, which is already known to the verifier. This is the extent of their knowledge of the prime factors of n. As a result, the prover does not provide any new details regarding n's prime factors.
Types of Proofs of Zero Knowledge
Each zero-knowledge proof has pros and cons. Most zero-knowledge proofs are:
Interactive Zero Knowledge Proofs: The prover and the verifier work together to establish the proof in this sort of zero-knowledge proof. The verifier disputes the prover's assertions after receiving a sequence of messages from the prover. When the evidence has been established, the prover will employ these new problems to generate additional responses.
Non-Interactive Zero Knowledge Proofs: For this kind of zero-knowledge proof, the prover and verifier just need to exchange a single message. Without further interaction between the two parties, the proof is established.
A statistical zero-knowledge proof is one in which the conclusion is reached with a high degree of probability but not with certainty. This indicates that there is a remote possibility that the proof is false, but that this possibility is so remote as to be unimportant.
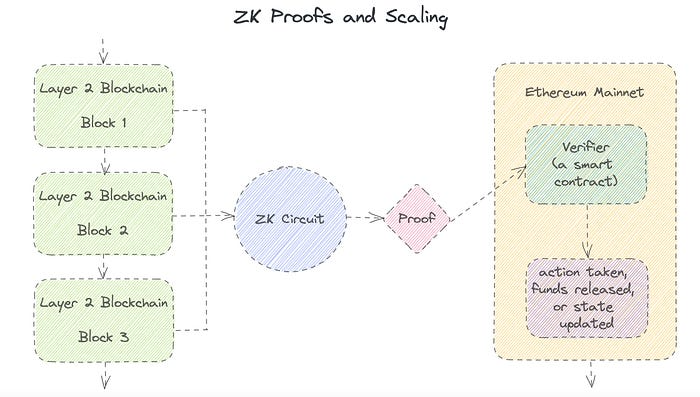
Succinct Non-Interactive Argument of Knowledge (SNARKs): SNARKs are an extremely effective and scalable form of zero-knowledge proof. They are utilized in many different applications, such as machine learning, blockchain technology, and more. Similar to other zero-knowledge proof techniques, SNARKs enable one party—the prover—to demonstrate to another—the verifier—that they are aware of a specific piece of information without disclosing any more information about that information.
The main characteristic of SNARKs is their succinctness, which refers to the fact that the size of the proof is substantially smaller than the amount of the original data being proved. Because to its high efficiency and scalability, SNARKs can be used in a wide range of applications, such as machine learning, blockchain technology, and more.
Uses for Zero Knowledge Proofs
ZKP applications include:
Verifying Identity ZKPs can be used to verify your identity without disclosing any personal information. This has uses in access control, digital signatures, and online authentication.
Proof of Ownership ZKPs can be used to demonstrate ownership of a certain asset without divulging any details about the asset itself. This has uses for protecting intellectual property, managing supply chains, and owning digital assets.
Financial Exchanges Without disclosing any details about the transaction itself, ZKPs can be used to validate financial transactions. Cryptocurrency, internet payments, and other digital financial transactions can all use this.
By enabling parties to make calculations on the data without disclosing the data itself, Data Privacy ZKPs can be used to preserve the privacy of sensitive data. Applications for this can be found in the financial, healthcare, and other sectors that handle sensitive data.
By enabling voters to confirm that their vote was counted without disclosing how they voted, elections ZKPs can be used to ensure the integrity of elections. This is applicable to electronic voting, including internet voting.
Cryptography Modern cryptography's ZKPs are a potent instrument that enable secure communication and authentication. This can be used for encrypted messaging and other purposes in the business sector as well as for military and intelligence operations.
Proofs of Zero Knowledge and Compliance
Kubernetes and regulatory compliance use ZKPs in many ways. Examples:
Security for Kubernetes ZKPs offer a mechanism to authenticate nodes without disclosing any sensitive information, enhancing the security of Kubernetes clusters. ZKPs, for instance, can be used to verify, without disclosing the specifics of the program, that the nodes in a Kubernetes cluster are running permitted software.
Compliance Inspection Without disclosing any sensitive information, ZKPs can be used to demonstrate compliance with rules like the GDPR, HIPAA, and PCI DSS. ZKPs, for instance, can be used to demonstrate that data has been encrypted and stored securely without divulging the specifics of the mechanism employed for either encryption or storage.
Access Management Without disclosing any private data, ZKPs can be used to offer safe access control to Kubernetes resources. ZKPs can be used, for instance, to demonstrate that a user has the necessary permissions to access a particular Kubernetes resource without disclosing the details of those permissions.
Safe Data Exchange Without disclosing any sensitive information, ZKPs can be used to securely transmit data between Kubernetes clusters or between several businesses. ZKPs, for instance, can be used to demonstrate the sharing of a specific piece of data between two parties without disclosing the details of the data itself.
Kubernetes deployments audited Without disclosing the specifics of the deployment or the data being processed, ZKPs can be used to demonstrate that Kubernetes deployments are working as planned. This can be helpful for auditing purposes and for ensuring that Kubernetes deployments are operating as planned.
ZKPs preserve data and maintain regulatory compliance by letting parties prove things without revealing sensitive information. ZKPs will be used more in Kubernetes as it grows.
Scott Hickmann
4 years ago
Welcome
Welcome to Integrity's Web3 community!
You might also like
Vanessa Karel
3 years ago
10 hard lessons from founding a startup.
Here is the ugly stuff, read this if you have a founder in your life or are trying to become one. Your call.
#1 You'll try to talk yourself to sleep, but it won't always work.
As founders, we're all driven. Good and bad, you're restless. Success requires resistance and discipline. Your startup will be on your mind 24/7, and not everyone will have the patience to listen to your worries, ideas, and coffee runs. You become more self-sufficient than ever before.
#2 No one will understand what you're going through unless they've been a founder.
Some of my closest friends don't understand the work that goes into starting a business, and we can't blame them.
#3 You'll feel alienated.
Your problems aren't common; calling your bestie won't help. You must search hard for the right resources. It alienates you from conversations you no longer relate to. (No 4th of July, no long weekends!)
#4 Since you're your "own boss," people assume you have lots of free time.
Do you agree? I was on a webinar with lots of new entrepreneurs, and one woman said, "I started my own business so I could have more time for myself." This may be true for some lucky people, and you can be flexible with your schedule. If you want your business to succeed, you'll probably be its slave for a while.
#5 No time for illness or family emergencies.
Both last month. Oh, no! Physically and emotionally withdrawing at the worst times will give you perspective. I learned this the hard way because I was too stubborn to postpone an important interview. I thought if I rested all day and only took one call, I'd be fine. Nope. I had a fever and my mind wasn't as sharp, so my performance and audience interaction suffered. Nope. Better to delay than miss out.
Oh, and setting a "OoO" makes you cringe.
#6 Good luck with your mental health, perfectionists.
When building a startup, it's difficult to accept that there won't be enough time to do everything. You can't make them all, not perfectly. You must learn to accept things that are done but not perfect.
#7 As a founder, you'll make mistakes, but you'll want to make them quickly so you can learn.
Hard lessons are learned quicker. You'll need to pivot and try new things often; some won't work, and it's best to discover them sooner rather than later.
#8 Pyramid schemes abound.
I didn't realize how bad it was until I started a company. You must spy and constantly research. As a founder, you'll receive many emails from people claiming to "support" you. Be wary and keep your eyes open. When it's too good to be true. Some "companies" will try to get you to pay for "competitions" to "pitch at events." Don't do it.
#9 Keep your competitor research to a minimum.
Actually, competition is good. It means there's a market for those solutions. However, this can be mentally exhausting too. Learn about their geography and updates, but that's it.
#10 You'll feel guilty taking vacation.
I don't know what to say, but I no longer enjoy watching TV, and that's okay. Pay attention to things that enrich you, bring you joy, and have fun. It boosts creativity.
Being a startup founder may be one of the hardest professional challenges you face, but it's also a great learning experience. Your passion will take you places you never imagined and open doors to opportunities you wouldn't have otherwise. You'll meet amazing people. No regrets, no complaints. It's a roller coaster, but the good days are great.
Miss anything? Comment below

Joseph Mavericks
3 years ago
The world's 36th richest man uses a 5-step system to get what he wants.
Ray Dalio's super-effective roadmap
Ray Dalio's $22 billion net worth ranks him 36th globally. From 1975 to 2011, he built the world's most successful hedge fund, never losing more than 4% from 1991 to 2020. (and only doing so during 3 calendar years).
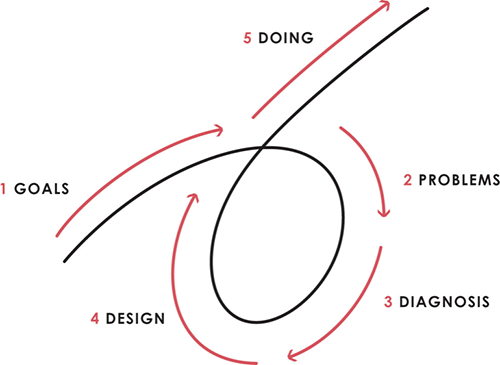
Dalio describes a 5-step process in his best-selling book Principles. It's the playbook he's used to build his hedge fund, beat the markets, and face personal challenges.
This 5-step system is so valuable and well-explained that I didn't edit or change anything; I only added my own insights in the parts I found most relevant and/or relatable as a young entrepreneur. The system's overview:
Have clear goals
Identify and don’t tolerate problems
Diagnose problems to get at their root causes
Design plans that will get you around those problems
Do what is necessary to push through the plans to get results
If you follow these 5 steps in a virtuous loop, you'll almost always see results. Repeat the process for each goal you have.
1. Have clear goals
a) Prioritize: You can have almost anything, but not everything.
I started and never launched dozens of projects for 10 years because I was scattered. I opened a t-shirt store, traded algorithms, sold art on Instagram, painted skateboards, and tinkered with electronics. I decided to try blogging for 6 months to see where it took me. Still going after 3 years.
b) Don’t confuse goals with desires.
A goal inspires you to act. Unreasonable desires prevent you from achieving your goals.
c) Reconcile your goals and desires to decide what you want.
d) Don't confuse success with its trappings.
e) Never dismiss a goal as unattainable.
Always one path is best. Your perception of what's possible depends on what you know now. I never thought I'd make money writing online so quickly, and now I see a whole new horizon of business opportunities I didn't know about before.
f) Expectations create abilities.
Don't limit your abilities. More you strive, the more you'll achieve.
g) Flexibility and self-accountability can almost guarantee success.
Flexible people accept what reality or others teach them. Self-accountability is the ability to recognize your mistakes and be more creative, flexible, and determined.
h) Handling setbacks well is as important as moving forward.
Learn when to minimize losses and when to let go and move on.
2. Don't ignore problems
a) See painful problems as improvement opportunities.
Every problem, painful situation, and challenge is an opportunity. Read The Art of Happiness for more.
b) Don't avoid problems because of harsh realities.
Recognizing your weaknesses isn't the same as giving in. It's the first step in overcoming them.
c) Specify your issues.
There is no "one-size-fits-all" solution.
d) Don’t mistake a cause of a problem with the real problem.
"I can't sleep" is a cause, not a problem. "I'm underperforming" could be a problem.
e) Separate big from small problems.
You have limited time and energy, so focus on the biggest problems.
f) Don't ignore a problem.
Identifying a problem and tolerating it is like not identifying it.
3. Identify problems' root causes
a) Decide "what to do" after assessing "what is."
"A good diagnosis takes 15 to 60 minutes, depending on its accuracy and complexity. [...] Like principles, root causes recur in different situations.
b) Separate proximate and root causes.
"You can only solve problems by removing their root causes, and to do that, you must distinguish symptoms from disease."
c) Knowing someone's (or your own) personality can help you predict their behavior.
4. Design plans that will get you around the problems
a) Retrace your steps.
Analyze your past to determine your future.
b) Consider your problem a machine's output.
Consider how to improve your machine. It's a game then.
c) There are many ways to reach your goals.
Find a solution.
d) Visualize who will do what in your plan like a movie script.
Consider your movie's actors and script's turning points, then act accordingly. The game continues.
e) Document your plan so others can judge your progress.
Accountability boosts success.
f) Know that a good plan doesn't take much time.
The execution is usually the hardest part, but most people either don't have a plan or keep changing it. Don't drive while building the car. Build it first, because it'll be bumpy.
5. Do what is necessary to push through the plans to get results
a) Great planners without execution fail.
Life is won with more than just planning. Similarly, practice without talent beats talent without practice.
b) Work ethic is undervalued.
Hyper-productivity is praised in corporate America, even if it leads nowhere. To get things done, use checklists, fewer emails, and more desk time.
c) Set clear metrics to ensure plan adherence.
I've written about the OKR strategy for organizations with multiple people here. If you're on your own, I recommend the Wheel of Life approach. Both systems start with goals and tasks to achieve them. Then start executing on a realistic timeline.
If you find solutions, weaknesses don't matter.
Everyone's weak. You, me, Gates, Dalio, even Musk. Nobody will be great at all 5 steps of the system because no one can think in all the ways required. Some are good at analyzing and diagnosing but bad at executing. Some are good planners but poor communicators. Others lack self-discipline.
Stay humble and ask for help when needed. Nobody has ever succeeded 100% on their own, without anyone else's help. That's the paradox of individual success: teamwork is the only way to get there.
Most people won't have the skills to execute even the best plan. You can get missing skills in two ways:
Self-taught (time-consuming)
Others' (requires humility) light
On knowing what to do with your life
“Some people have good mental maps and know what to do on their own. Maybe they learned them or were blessed with common sense. They have more answers than others. Others are more humble and open-minded. […] Open-mindedness and mental maps are most powerful.” — Ray Dalio
I've always known what I wanted to do, so I'm lucky. I'm almost 30 and have always had trouble executing. Good thing I never stopped experimenting, but I never committed to anything long-term. I jumped between projects. I decided 3 years ago to stick to one project for at least 6 months and haven't looked back.
Maybe you're good at staying focused and executing, but you don't know what to do. Maybe you have none of these because you haven't found your purpose. Always try new projects and talk to as many people as possible. It will give you inspiration and ideas and set you up for success.
There is almost always a way to achieve a crazy goal or idea.
Enjoy the journey, whichever path you take.

1eth1da
3 years ago
6 Rules to build a successful NFT Community in 2022

Too much NFT, Discord, and shitposting.
How do you choose?
How do you recruit more members to join your NFT project?
In 2021, a successful NFT project required:
Monkey/ape artwork
Twitter and Discord bot-filled
Roadmap overpromise
Goal was quick cash.
2022 and the years after will change that.
These are 6 Rules for a Strong NFT Community in 2022:
THINK LONG TERM
This relates to roadmap planning. Hype and dumb luck may drive NFT projects (ahem, goblins) but rarely will your project soar.
Instead, consider sustainability.
Plan your roadmap based on your team's abilities.
Do what you're already doing, but with NFTs, make it bigger and better.
You shouldn't copy a project's roadmap just because it was profitable.
This will lead to over-promising, team burnout, and an RUG NFT project.
OFFER VALUE
Building a great community starts with giving.
Why are musicians popular?
Because they offer entertainment for everyone, a random person becomes a fan, and more fans become a cult.
That's how you should approach your community.
TEAM UP
A great team helps.
An NFT project could have 3 or 2 people.
Credibility trumps team size.
Make sure your team can answer community questions, resolve issues, and constantly attend to them.
Don't overwork and burn out.
Your community will be able to recognize that you are trying too hard and give up on the project.
BUILD A GREAT PRODUCT
Bored Ape Yacht Club altered the NFT space.
Cryptopunks transformed NFTs.
Many others did, including Okay Bears.
What made them that way?
Because they answered a key question.
What is my NFT supposed to be?
Before planning art, this question must be answered.
NFTs can't be just jpegs.
What does it represent?
Is it a Metaverse-ready project?
What blockchain are you going to be using and why?
Set some ground rules for yourself. This helps your project's direction.
These questions will help you and your team set a direction for blockchain, NFT, and Web3 technology.
EDUCATE ON WEB3
The more the team learns about Web3 technology, the more they can offer their community.
Think tokens, metaverse, cross-chain interoperability and more.
BUILD A GREAT COMMUNITY
Several projects mistreat their communities.
They treat their community like "customers" and try to sell them NFT.
Providing Whitelists and giveaways aren't your only community-building options.
Think bigger.
Consider them family and friends, not wallets.
Consider them fans.
These are some tips to start your NFT project.