

DAOs are legal entities in Marshall Islands.
The Pacific island state recognizes decentralized autonomous organizations.
The Republic of the Marshall Islands has recognized decentralized autonomous organizations (DAOs) as legal entities, giving collectively owned and managed blockchain projects global recognition.
The Marshall Islands' amended the Non-Profit Entities Act 2021 that now recognizes DAOs, which are blockchain-based entities governed by self-organizing communities. Incorporating Admiralty LLC, the island country's first DAO, was made possible thanks to the amendement. MIDAO Directory Services Inc., a domestic organization established to assist DAOs in the Marshall Islands, assisted in the incorporation.
The new law currently allows any DAO to register and operate in the Marshall Islands.
“This is a unique moment to lead,” said Bobby Muller, former Marshall Islands chief secretary and co-founder of MIDAO. He believes DAOs will help create “more efficient and less hierarchical” organizations.
A global hub for DAOs, the Marshall Islands hopes to become a global hub for DAO registration, domicile, use cases, and mass adoption. He added:
"This includes low-cost incorporation, a supportive government with internationally recognized courts, and a technologically open environment."
According to the World Bank, the Marshall Islands is an independent island state in the Pacific Ocean near the Equator. To create a blockchain-based cryptocurrency that would be legal tender alongside the US dollar, the island state has been actively exploring use cases for digital assets since at least 2018.
In February 2018, the Marshall Islands approved the creation of a new cryptocurrency, Sovereign (SOV). As expected, the IMF has criticized the plan, citing concerns that a digital sovereign currency would jeopardize the state's financial stability. They have also criticized El Salvador, the first country to recognize Bitcoin (BTC) as legal tender.
Marshall Islands senator David Paul said the DAO legislation does not pose the same issues as a government-backed cryptocurrency. “A sovereign digital currency is financial and raises concerns about money laundering,” . This is more about giving DAOs legal recognition to make their case to regulators, investors, and consumers.
More on Web3 & Crypto

Sam Bourgi
3 years ago
NFT was used to serve a restraining order on an anonymous hacker.
The international law firm Holland & Knight used an NFT built and airdropped by its asset recovery team to serve a defendant in a hacking case.
The law firms Holland & Knight and Bluestone used a nonfungible token to serve a defendant in a hacking case with a temporary restraining order, marking the first documented legal process assisted by an NFT.
The so-called "service token" or "service NFT" was served to an unknown defendant in a hacking case involving LCX, a cryptocurrency exchange based in Liechtenstein that was hacked for over $8 million in January. The attack compromised the platform's hot wallets, resulting in the loss of Ether (ETH), USD Coin (USDC), and other cryptocurrencies, according to Cointelegraph at the time.
On June 7, LCX claimed that around 60% of the stolen cash had been frozen, with investigations ongoing in Liechtenstein, Ireland, Spain, and the United States. Based on a court judgment from the New York Supreme Court, Centre Consortium, a company created by USDC issuer Circle and crypto exchange Coinbase, has frozen around $1.3 million in USDC.
The monies were laundered through Tornado Cash, according to LCX, but were later tracked using "algorithmic forensic analysis." The organization was also able to identify wallets linked to the hacker as a result of the investigation.
In light of these findings, the law firms representing LCX, Holland & Knight and Bluestone, served the unnamed defendant with a temporary restraining order issued on-chain using an NFT. According to LCX, this system "was allowed by the New York Supreme Court and is an example of how innovation can bring legitimacy and transparency to a market that some say is ungovernable."

Percy Bolmér
3 years ago
Ethereum No Longer Consumes A Medium-Sized Country's Electricity To Run
The Merge cut Ethereum's energy use by 99.5%.

The Crypto community celebrated on September 15, 2022. This day, Ethereum Merged. The entire blockchain successfully merged with the Beacon chain, and it was so smooth you barely noticed.
Many have waited, dreaded, and longed for this day.
Some investors feared the network would break down, while others envisioned a seamless merging.
Speculators predict a successful Merge will lead investors to Ethereum. This could boost Ethereum's popularity.
What Has Changed Since The Merge
The merging transitions Ethereum mainnet from PoW to PoS.
PoW sends a mathematical riddle to computers worldwide (miners). First miner to solve puzzle updates blockchain and is rewarded.
The puzzles sent are power-intensive to solve, so mining requires a lot of electricity. It's sent to every miner competing to solve it, requiring duplicate computation.
PoS allows investors to stake their coins to validate a new transaction. Instead of validating a whole block, you validate a transaction and get the fees.
You can validate instead of mine. A validator stakes 32 Ethereum. After staking, the validator can validate future blocks.
Once a validator validates a block, it's sent to a randomly selected group of other validators. This group verifies that a validator is not malicious and doesn't validate fake blocks.
This way, only one computer needs to solve or validate the transaction, instead of all miners. The validated block must be approved by a small group of validators, causing duplicate computation.
PoS is more secure because validating fake blocks results in slashing. You lose your bet tokens. If a validator signs a bad block or double-signs conflicting blocks, their ETH is burned.
Theoretically, Ethereum has one block every 12 seconds, so a validator forging a block risks burning 1 Ethereum for 12 seconds of transactions. This makes mistakes expensive and risky.
What Impact Does This Have On Energy Use?
Cryptocurrency is a natural calamity, sucking electricity and eating away at the earth one transaction at a time.
Many don't know the environmental impact of cryptocurrencies, yet it's tremendous.
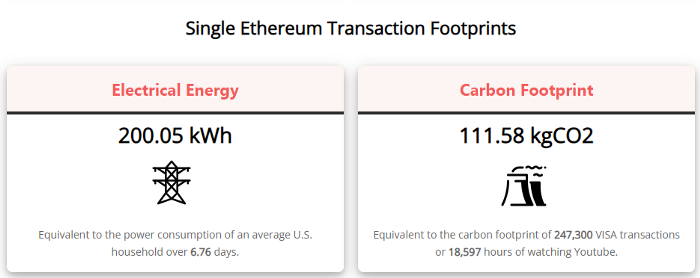
A single Ethereum transaction used to use 200 kWh and leave a large carbon imprint. This update reduces global energy use by 0.2%.
Ethereum will submit a challenge to one validator, and that validator will forward it to randomly selected other validators who accept it.
This reduces the needed computing power.
They expect a 99.5% reduction, therefore a single transaction should cost 1 kWh.
Carbon footprint is 0.58 kgCO2, or 1,235 VISA transactions.
This is a big Ethereum blockchain update.
I love cryptocurrency and Mother Earth.

Amelie Carver
3 years ago
Web3 Needs More Writers to Educate Us About It
WRITE FOR THE WEB3
Why web3’s messaging is lost and how crypto winter is growing growth seeds

People interested in crypto, blockchain, and web3 typically read Bitcoin and Ethereum's white papers. It's a good idea. Documents produced for developers and academia aren't always the ideal resource for beginners.
Given the surge of extremely technical material and the number of fly-by-nights, rug pulls, and other scams, it's little wonder mainstream audiences regard the blockchain sector as an expensive sideshow act.
What's the solution?
Web3 needs more than just builders.
After joining TikTok, I followed Amy Suto of SutoScience. Amy switched from TV scriptwriting to IT copywriting years ago. She concentrates on web3 now. Decentralized autonomous organizations (DAOs) are seeking skilled copywriters for web3.
Amy has found that web3's basics are easy to grasp; you don't need technical knowledge. There's a paradigm shift in knowing the basics; be persistent and patient.
Apple is positioning itself as a data privacy advocate, leveraging web3's zero-trust ethos on data ownership.
Finn Lobsien, who writes about web3 copywriting for the Mirror and Twitter, agrees: acronyms and abstractions won't do.
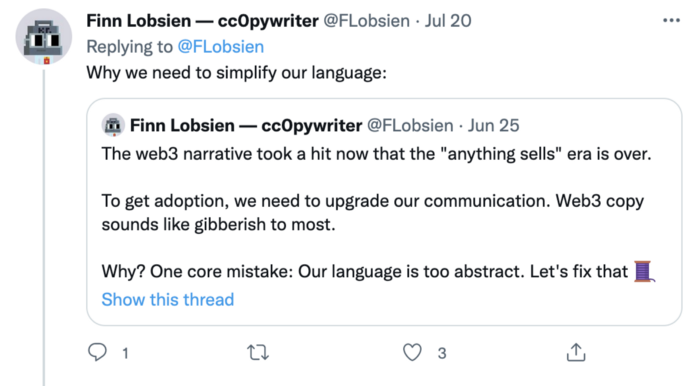
Web3 preached to the choir. Curious newcomers have only found whitepapers and scams when trying to learn why the community loves it. No wonder people resist education and buy-in.
Due to the gender gap in crypto (Crypto Bro is not just a stereotype), it attracts people singing to the choir or trying to cash in on the next big thing.
Last year, the industry was booming, so writing wasn't necessary. Now that the bear market has returned (for everyone, but especially web3), holding readers' attention is a valuable skill.
White papers and the Web3
Why does web3 rely so much on non-growth content?
Businesses must polish and improve their messaging moving into the 2022 recession. The 2021 tech boom provided such a sense of affluence and (unsustainable) growth that no one needed great marketing material. The market found them.
This was especially true for web3 and the first-time crypto believers. Obviously. If they knew which was good.
White papers help. White papers are highly technical texts that walk a reader through a product's details. How Does a White Paper Help Your Business and That White Paper Guy discuss them.
They're meant for knowledgeable readers. Investors and the technical (academic/developer) community read web3 white papers. White papers are used when a product is extremely technical or difficult to assist an informed reader to a conclusion. Web3 uses them most often for ICOs (initial coin offerings).

White papers for web3 education help newcomers learn about the web3 industry's components. It's like sending a first-grader to the Annotated Oxford English Dictionary to learn to read. It's a reference, not a learning tool, for words.
Newcomers can use platforms that teach the basics. These included Coinbase's Crypto Basics tutorials or Cryptochicks Academy, founded by the mother of Ethereum's inventor to get more women utilizing and working in crypto.
Discord and Web3 communities
Discord communities are web3's opposite. Discord communities involve personal communications and group involvement.
Online audience growth begins with community building. User personas prefer 1000 dedicated admirers over 1 million lukewarm followers, and the language is much more easygoing. Discord groups are renowned for phishing scams, compromised wallets, and incorrect information, especially since the crypto crisis.
White papers and Discord increase industry insularity. White papers are complicated, and Discord has a high risk threshold.
Web3 and writing ads
Copywriting is emotional, but white papers are logical. It uses the brain's quick-decision centers. It's meant to make the reader invest immediately.
Not bad. People think sales are sleazy, but they can spot the poor things.
Ethical copywriting helps you reach the correct audience. People who gain a following on Medium are likely to have copywriting training and a readership (or three) in mind when they publish. Tim Denning and Sinem Günel know how to identify a target audience and make them want to learn more.
In a fast-moving market, copywriting is less about long-form content like sales pages or blogs, but many organizations do. Instead, the copy is concise, individualized, and high-value. Tweets, email marketing, and IM apps (Discord, Telegram, Slack to a lesser extent) keep engagement high.
What does web3's messaging lack? As DAOs add stricter copyrighting, narrative and connecting tales seem to be missing.
Web3 is passionate about constructing the next internet. Now, they can connect their passion to a specific audience so newcomers understand why.
You might also like

Darius Foroux
2 years ago
My financial life was changed by a single, straightforward mental model.
Prioritize big-ticket purchases
I've made several spending blunders. I get sick thinking about how much money I spent.
My financial mental model was poor back then.
Stoicism and mindfulness keep me from attaching to those feelings. It still hurts.
Until four or five years ago, I bought a new winter jacket every year.
Ten years ago, I spent twice as much. Now that I have a fantastic, warm winter parka, I don't even consider acquiring another one. No more spending. I'm not looking for jackets either.
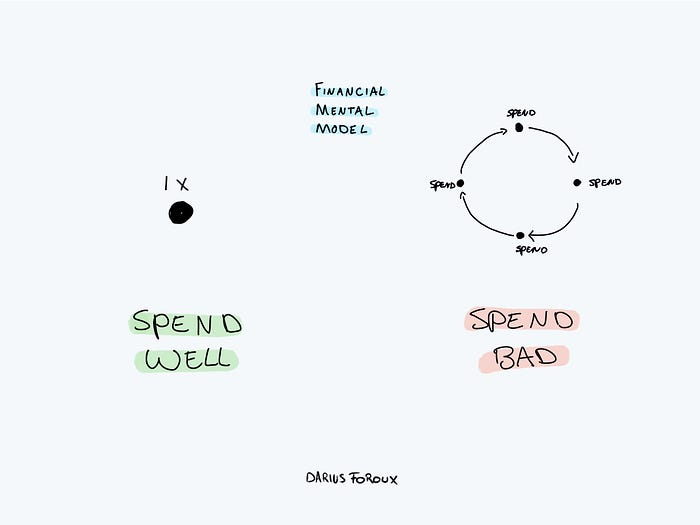
Saving time and money by spending well is my thinking paradigm.
The philosophy is expressed in most languages. Cheap is expensive in the Netherlands. This applies beyond shopping.
In this essay, I will offer three examples of how this mental paradigm transformed my financial life.
Publishing books
In 2015, I presented and positioned my first book poorly.
I called the book Huge Life Success and made a funny Canva cover in 30 minutes. This:

That looks nothing like my present books. No logo or style. The book felt amateurish.
The book started bothering me a few weeks after publication. The advice was good, but it didn't appear professional. I studied the book business extensively.
I created a style for all my designs. Branding. Win Your Inner Wars was reissued a year later.
Title, cover, and description changed. Rearranging the chapters improved readability.
Seven years later, the book sells hundreds of copies a month. That taught me a lot.
Rushing to finish a project is enticing. Send it and move forward.
Avoid rushing everything. Relax. Develop your projects. Perform well. Perform the job well.
My first novel was underfunded and underworked. A bad book arrived. I then invested time and money in writing the greatest book I could.
That book still sells.
Traveling
I hate travel. Airports, flights, trains, and lines irritate me.
But, I enjoy traveling to beautiful areas.
I do it strangely. I make up travel rules. I never go to airports in summer. I hate being near airports on holidays. Unworthy.
No vacation packages for me. Those airline packages with a flight, shuttle, and hotel. I've had enough.
I try to avoid crowds and popular spots. July Paris? Nuts and bolts, please. Christmas in NYC? No, please keep me sane.
I fly business class behind. I accept upgrades upon check-in. I prefer driving. I drove from the Netherlands to southern Spain.
Thankfully, no lines. What if travel costs more? Thus? I enjoy it from the start. I start traveling then.
I rarely travel since I'm so difficult. One great excursion beats several average ones.
Personal effectiveness
New apps, tools, and strategies intrigue most productivity professionals.
No.
I researched years ago. I spent years investigating productivity in university.
I bought books, courses, applications, and tools. It was expensive and time-consuming.
Im finished. Productivity no longer costs me time or money. OK. I worked on it once and now follow my strategy.
I avoid new programs and systems. My stuff works. Why change winners?
Spending wisely saves time and money.
Spending wisely means spending once. Many people ignore productivity. It's understudied. No classes.
Some assume reading a few articles or a book is enough. Productivity is personal. You need a personal system.
Time invested is one-time. You can trust your system for life once you find it.
Concentrate on the expensive choices.
Life's short. Saving money quickly is enticing.
Spend less on groceries today. True. That won't fix your finances.
Adopt a lifestyle that makes you affluent over time. Consider major choices.
Are they causing long-term poverty? Are you richer?
Leasing cars comes to mind. The automobile costs a fortune today. The premium could accomplish a million nice things.
Focusing on important decisions makes life easier. Consider your future. You want to improve next year.

Recep İnanç
3 years ago
Effective Technical Book Reading Techniques

Technical books aren't like novels. We need a new approach to technical texts. I've spent years looking for a decent reading method. I tried numerous ways before finding one that worked. This post explains how I read technical books efficiently.
What Do I Mean When I Say Effective?
Effectiveness depends on the book. Effective implies I know where to find answers after reading a reference book. Effective implies I learned the book's knowledge after reading it.
I use reference books as tools in my toolkit. I won't carry all my tools; I'll merely need them. Non-reference books teach me techniques. I never have to make an effort to use them since I always have them.
Reference books I like:
Design Patterns: Elements of Reusable Object-Oriented Software
Refactoring: Improving the Design of Existing Code
You can also check My Top Takeaways from Refactoring here.
Non-reference books I like:
The Approach
Technical books might be overwhelming to read in one sitting. Especially when you have no idea what is coming next as you read. When you don't know how deep the rabbit hole goes, you feel lost as you read. This is my years-long method for overcoming this difficulty.
Whether you follow the step-by-step guide or not, remember these:
Understand the terminology. Make sure you get the meaning of any terms you come across more than once. The likelihood that a term will be significant increases as you encounter it more frequently.
Know when to stop. I've always believed that in order to truly comprehend something, I must delve as deeply as possible into it. That, however, is not usually very effective. There are moments when you have to draw the line and start putting theory into practice (if applicable).
Look over your notes. When reading technical books or documents, taking notes is a crucial habit to develop. Additionally, you must regularly examine your notes if you want to get the most out of them. This will assist you in internalizing the lessons you acquired from the book. And you'll see that the urge to review reduces with time.
Let's talk about how I read a technical book step by step.
0. Read the Foreword/Preface
These sections are crucial in technical books. They answer Who should read it, What each chapter discusses, and sometimes How to Read? This is helpful before reading the book. Who could know the ideal way to read the book better than the author, right?
1. Scanning
I scan the chapter. Fast scanning is needed.
I review the headings.
I scan the pictures quickly.
I assess the chapter's length to determine whether I might divide it into more manageable sections.
2. Skimming
Skimming is faster than reading but slower than scanning.
I focus more on the captions and subtitles for the photographs.
I read each paragraph's opening and closing sentences.
I examined the code samples.
I attempt to grasp each section's basic points without getting bogged down in the specifics.
Throughout the entire reading period, I make an effort to make mental notes of what may require additional attention and what may not. Because I don't want to spend time taking physical notes, kindly notice that I am using the term "mental" here. It is much simpler to recall. You may think that this is more significant than typing or writing “Pay attention to X.”
I move on quickly. This is something I considered crucial because, when trying to skim, it is simple to start reading the entire thing.
3. Complete reading
Previous steps pay off.
I finished reading the chapter.
I concentrate on the passages that I mentally underlined when skimming.
I put the book away and make my own notes. It is typically more difficult than it seems for me. But it's important to speak in your own words. You must choose the right words to adequately summarize what you have read. How do those words make you feel? Additionally, you must be able to summarize your notes while you are taking them. Sometimes as I'm writing my notes, I realize I have no words to convey what I'm thinking or, even worse, I start to doubt what I'm writing down. This is a good indication that I haven't internalized that idea thoroughly enough.
I jot my inquiries down. Normally, I read on while compiling my questions in the hopes that I will learn the answers as I read. I'll explore those issues more if I wasn't able to find the answers to my inquiries while reading the book.
Bonus!
Best part: If you take lovely notes like I do, you can publish them as a blog post with a few tweaks.
Conclusion
This is my learning journey. I wanted to show you. This post may help someone with a similar learning style. You can alter the principles above for any technical material.

Sukhad Anand
3 years ago
How Do Discord's Trillions Of Messages Get Indexed?
They depend heavily on open source..

Discord users send billions of messages daily. Users wish to search these messages. How do we index these to search by message keywords?
Let’s find out.
Discord utilizes Elasticsearch. Elasticsearch is a free, open search engine for textual, numerical, geographical, structured, and unstructured data. Apache Lucene powers Elasticsearch.
How does elastic search store data? It stores it as numerous key-value pairs in JSON documents.
How does elastic search index? Elastic search's index is inverted. An inverted index lists every unique word in every page and where it appears.
4. Elasticsearch indexes documents and generates an inverted index to make data searchable in near real-time. The index API adds or updates JSON documents in a given index.
Let's examine how discord uses Elastic Search. Elasticsearch prefers bulk indexing. Discord couldn't index real-time messages. You can't search posted messages. You want outdated messages.
6. Let's check what bulk indexing requires.
1. A temporary queue for incoming communications.
2. Indexer workers that index messages into elastic search.
Discord's queue is Celery. The queue is open-source. Elastic search won't run on a single server. It's clustered. Where should a message go? Where?
8. A shard allocator decides where to put the message. Nevertheless. Shattered? A shard combines elastic search and index on. So, these two form a shard which is used as a unit by discord. The elastic search itself has some shards. But this is different, so don’t get confused.
Now, the final part is service discovery — to discover the elastic search clusters and the hosts within that cluster. This, they do with the help of etcd another open source tool.
A great thing to notice here is that discord relies heavily on open source systems and their base implementations which is very different from a lot of other products.