


More on Web3 & Crypto
David Z. Morris
3 years ago
FTX's crash was no accident, it was a crime

Sam Bankman Fried (SDBF) is a legendary con man. But the NYT might not tell you that...
Since SBF's empire was revealed to be a lie, mainstream news organizations and commentators have failed to give readers a straightforward assessment. The New York Times and Wall Street Journal have uncovered many key facts about the scandal, but they have also soft-peddled Bankman-Fried's intent and culpability.
It's clear that the FTX crypto exchange and Alameda Research committed fraud to steal money from users and investors. That’s why a recent New York Times interview was widely derided for seeming to frame FTX’s collapse as the result of mismanagement rather than malfeasance. A Wall Street Journal article lamented FTX's loss of charitable donations, bolstering Bankman's philanthropic pose. Matthew Yglesias, court chronicler of the neoliberal status quo, seemed to whitewash his own entanglements by crediting SBF's money with helping Democrats in 2020 – sidestepping the likelihood that the money was embezzled.
Many outlets have called what happened to FTX a "bank run" or a "run on deposits," but Bankman-Fried insists the company was overleveraged and disorganized. Both attempts to frame the fallout obscure the core issue: customer funds misused.
Because banks lend customer funds to generate returns, they can experience "bank runs." If everyone withdraws at once, they can experience a short-term cash crunch but there won't be a long-term problem.
Crypto exchanges like FTX aren't banks. They don't do bank-style lending, so a withdrawal surge shouldn't strain liquidity. FTX promised customers it wouldn't lend or use their crypto.
Alameda's balance sheet blurs SBF's crypto empire.
The funds were sent to Alameda Research, where they were apparently gambled away. This is massive theft. According to a bankruptcy document, up to 1 million customers could be affected.
In less than a month, reporting and the bankruptcy process have uncovered a laundry list of decisions and practices that would constitute financial fraud if FTX had been a U.S.-regulated entity, even without crypto-specific rules. These ploys may be litigated in U.S. courts if they enabled the theft of American property.
The list is very, very long.
The many crimes of Sam Bankman-Fried and FTX
At the heart of SBF's fraud are the deep and (literally) intimate ties between FTX and Alameda Research, a hedge fund he co-founded. An exchange makes money from transaction fees on user assets, but Alameda trades and invests its own funds.
Bankman-Fried called FTX and Alameda "wholly separate" and resigned as Alameda's CEO in 2019. The two operations were closely linked. Bankman-Fried and Alameda CEO Caroline Ellison were romantically linked.
These circumstances enabled SBF's sin. Within days of FTX's first signs of weakness, it was clear the exchange was funneling customer assets to Alameda for trading, lending, and investing. Reuters reported on Nov. 12 that FTX sent $10 billion to Alameda. As much as $2 billion was believed to have disappeared after being sent to Alameda. Now the losses look worse.
It's unclear why those funds were sent to Alameda or when Bankman-Fried betrayed his depositors. On-chain analysis shows most FTX to Alameda transfers occurred in late 2021, and bankruptcy filings show both lost $3.7 billion in 2021.
SBF's companies lost millions before the 2022 crypto bear market. They may have stolen funds before Terra and Three Arrows Capital, which killed many leveraged crypto players.
FTT loans and prints
CoinDesk's report on Alameda's FTT holdings ignited FTX and Alameda Research. FTX created this instrument, but only a small portion was traded publicly; FTX and Alameda held the rest. These holdings were illiquid, meaning they couldn't be sold at market price. Bankman-Fried valued its stock at the fictitious price.
FTT tokens were reportedly used as collateral for loans, including FTX loans to Alameda. Close ties between FTX and Alameda made the FTT token harder or more expensive to use as collateral, reducing the risk to customer funds.
This use of an internal asset as collateral for loans between clandestinely related entities is similar to Enron's 1990s accounting fraud. These executives served 12 years in prison.
Alameda's margin liquidation exemption
Alameda Research had a "secret exemption" from FTX's liquidation and margin trading rules, according to legal filings by FTX's new CEO.
FTX, like other crypto platforms and some equity or commodity services, offered "margin" or loans for trades. These loans are usually collateralized, meaning borrowers put up other funds or assets. If a margin trade loses enough money, the exchange will sell the user's collateral to pay off the initial loan.
Keeping asset markets solvent requires liquidating bad margin positions. Exempting Alameda would give it huge advantages while exposing other FTX users to hidden risks. Alameda could have kept losing positions open while closing out competitors. Alameda could lose more on FTX than it could pay back, leaving a hole in customer funds.
The exemption is criminal in multiple ways. FTX was fraudulently marketed overall. Instead of a level playing field, there were many customers.
Above them all, with shotgun poised, was Alameda Research.
Alameda front-running FTX listings
Argus says there's circumstantial evidence that Alameda Research had insider knowledge of FTX's token listing plans. Alameda was able to buy large amounts of tokens before the listing and sell them after the price bump.
If true, these claims would be the most brazenly illegal of Alameda and FTX's alleged shenanigans. Even if the tokens aren't formally classified as securities, insider trading laws may apply.
In a similar case this year, an OpenSea employee was charged with wire fraud for allegedly insider trading. This employee faces 20 years in prison for front-running monkey JPEGs.
Huge loans to executives
Alameda Research reportedly lent FTX executives $4.1 billion, including massive personal loans. Bankman-Fried received $1 billion in personal loans and $2.3 billion for an entity he controlled, Paper Bird. Nishad Singh, director of engineering, was given $543 million, and FTX Digital Markets co-CEO Ryan Salame received $55 million.
FTX has more smoking guns than a Texas shooting range, but this one is the smoking bazooka – a sign of criminal intent. It's unclear how most of the personal loans were used, but liquidators will have to recoup the money.
The loans to Paper Bird were even more worrisome because they created another related third party to shuffle assets. Forbes speculates that some Paper Bird funds went to buy Binance's FTX stake, and Paper Bird committed hundreds of millions to outside investments.
FTX Inner Circle: Who's Who
That included many FTX-backed VC funds. Time will tell if this financial incest was criminal fraud. It fits Bankman-pattern Fried's of using secret flows, leverage, and funny money to inflate asset prices.
FTT or loan 'bailouts'
Also. As the crypto bear market continued in 2022, Bankman-Fried proposed bailouts for bankrupt crypto lenders BlockFi and Voyager Digital. CoinDesk was among those deceived, welcoming SBF as a J.P. Morgan-style sector backstop.
In a now-infamous interview with CNBC's "Squawk Box," Bankman-Fried referred to these decisions as bets that may or may not pay off.
But maybe not. Bloomberg's Matt Levine speculated that FTX backed BlockFi with FTT money. This Monopoly bailout may have been intended to hide FTX and Alameda liabilities that would have been exposed if BlockFi went bankrupt sooner. This ploy has no name, but it echoes other corporate frauds.
Secret bank purchase
Alameda Research invested $11.5 million in the tiny Farmington State Bank, doubling its net worth. As a non-U.S. entity and an investment firm, Alameda should have cleared regulatory hurdles before acquiring a U.S. bank.
In the context of FTX, the bank's stake becomes "ominous." Alameda and FTX could have done more shenanigans with bank control. Compare this to the Bank for Credit and Commerce International's failed attempts to buy U.S. banks. BCCI was even nefarious than FTX and wanted to buy U.S. banks to expand its money-laundering empire.
The mainstream's mistakes
These are complex and nuanced forms of fraud that echo traditional finance models. This obscurity helped Bankman-Fried masquerade as an honest player and likely kept coverage soft after the collapse.
Bankman-Fried had a scruffy, nerdy image, like Mark Zuckerberg and Adam Neumann. In interviews, he spoke nonsense about an industry full of jargon and complicated tech. Strategic donations and insincere ideological statements helped him gain political and social influence.
SBF' s'Effective' Altruism Blew Up FTX
Bankman-Fried has continued to muddy the waters with disingenuous letters, statements, interviews, and tweets since his con collapsed. He's tried to portray himself as a well-intentioned but naive kid who made some mistakes. This is a softer, more pernicious version of what Trump learned from mob lawyer Roy Cohn. Bankman-Fried doesn't "deny, deny, deny" but "confuse, evade, distort."
It's mostly worked. Kevin O'Leary, who plays an investor on "Shark Tank," repeats Bankman-SBF's counterfactuals. O'Leary called Bankman-Fried a "savant" and "probably one of the most accomplished crypto traders in the world" in a Nov. 27 interview with Business Insider, despite recent data indicating immense trading losses even when times were good.
O'Leary's status as an FTX investor and former paid spokesperson explains his continued affection for Bankman-Fried despite contradictory evidence. He's not the only one promoting Bankman-Fried. The disgraced son of two Stanford law professors will defend himself at Wednesday's DealBook Summit.
SBF's fraud and theft rival those of Bernie Madoff and Jho Low. Whether intentionally or through malign ineptitude, the fraud echoes Worldcom and Enron.
The Perverse Impacts of Anti-Money-Laundering
The principals in all of those scandals wound up either sentenced to prison or on the run from the law. Sam Bankman-Fried clearly deserves to share their fate.
Read the full article here.

CyberPunkMetalHead
3 years ago
It's all about the ego with Terra 2.0.
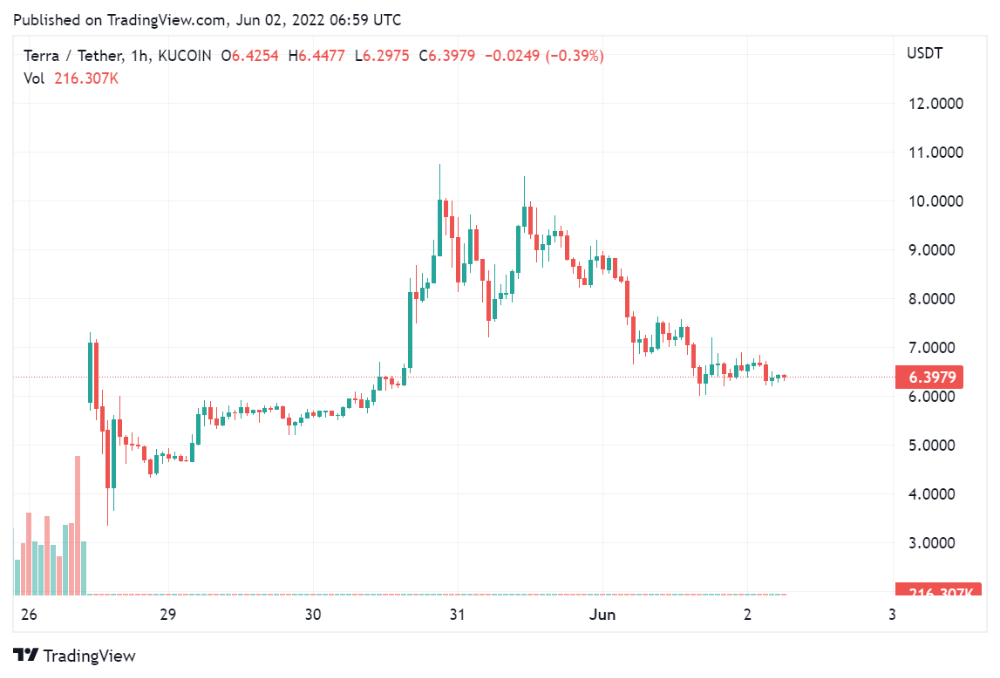
UST depegs and LUNA crashes 99.999% in a fraction of the time it takes the Moon to orbit the Earth.
Fat Man, a Terra whistle-blower, promises to expose Do Kwon's dirty secrets and shady deals.

The Terra community has voted to relaunch Terra LUNA on a new blockchain. The Terra 2.0 Pheonix-1 blockchain went live on May 28, 2022, and people were airdropped the new LUNA, now called LUNA, while the old LUNA became LUNA Classic.
Does LUNA deserve another chance? To answer this, or at least start a conversation about the Terra 2.0 chain's advantages and limitations, we must assess its fundamentals, ideology, and long-term vision.
Whatever the result, our analysis must be thorough and ruthless. A failure of this magnitude cannot happen again, so we must magnify every potential breaking point by 10.
Will UST and LUNA holders be compensated in full?
The obvious. First, and arguably most important, is to restore previous UST and LUNA holders' bags.
Terra 2.0 has 1,000,000,000,000 tokens to distribute.
25% of a community pool
Holders of pre-attack LUNA: 35%
10% of aUST holders prior to attack
Holders of LUNA after an attack: 10%
UST holders as of the attack: 20%
Every LUNA and UST holder has been compensated according to the above proposal.
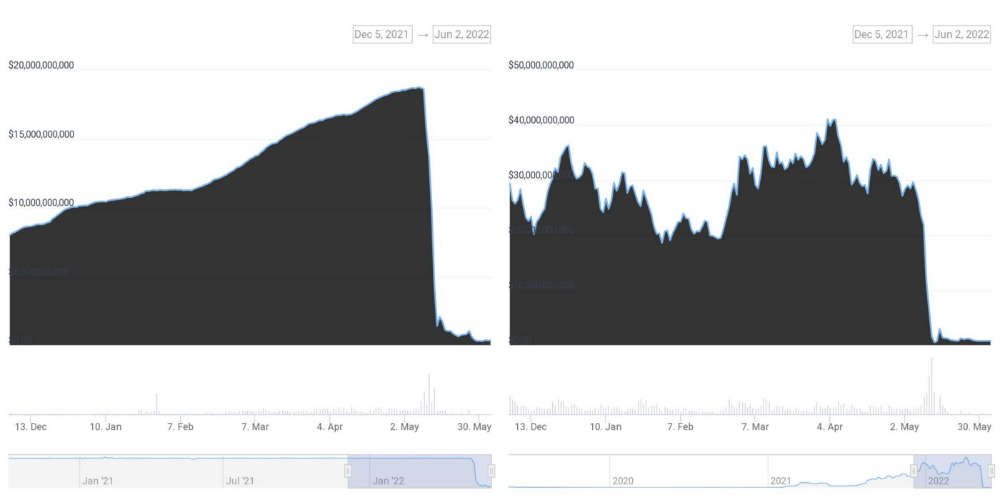
According to self-reported data, the new chain has 210.000.000 tokens and a $1.3bn marketcap. LUNC and UST alone lost $40bn. The new token must fill this gap. Since launch:
LUNA holders collectively own $1b worth of LUNA if we subtract the 25% community pool airdrop from the current market cap and assume airdropped LUNA was never sold.
At the current supply, the chain must grow 40 times to compensate holders. At the current supply, LUNA must reach $240.
LUNA needs a full-on Bull Market to make LUNC and UST holders whole.
Who knows if you'll be whole? From the time you bought to the amount and price, there are too many variables to determine if Terra can cover individual losses.
The above distribution doesn't consider individual cases. Terra didn't solve individual cases. It would have been huge.
What does LUNA offer in terms of value?
UST's marketcap peaked at $18bn, while LUNC's was $41bn. LUNC and UST drove the Terra chain's value.
After it was confirmed (again) that algorithmic stablecoins are bad, Terra 2.0 will no longer support them.
Algorithmic stablecoins contributed greatly to Terra's growth and value proposition. Terra 2.0 has no product without algorithmic stablecoins.
Terra 2.0 has an identity crisis because it has no actual product. It's like Volkswagen faking carbon emission results and then stopping car production.
A project that has already lost the trust of its users and nearly all of its value cannot survive without a clear and in-demand use case.
Do Kwon, how about him?
Oh, the Twitter-caller-poor? Who challenges crypto billionaires to break his LUNA chain? Who dissolved Terra Labs South Korea before depeg? Arrogant guy?
That's not a good image for LUNA, especially when making amends. I think he should step down and let a nicer person be Terra 2.0's frontman.
The verdict
Terra has a terrific community with an arrogant, unlikeable leader. The new LUNA chain must grow 40 times before it can start making up its losses, and even then, not everyone's losses will be covered.
I won't invest in Terra 2.0 or other algorithmic stablecoins in the near future. I won't be near any Do Kwon-related project within 100 miles. My opinion.
Can Terra 2.0 be saved? Comment below.

Onchain Wizard
3 years ago
Three Arrows Capital & Celsius Updates
I read 1k+ page 3AC liquidation documentation so you don't have to. Also sharing revised Celsius recovery plans.
3AC's liquidation documents:
Someone disclosed 3AC liquidation records in the BVI courts recently. I'll discuss the leak's timeline and other highlights.
Three Arrows Capital began trading traditional currencies in emerging markets in 2012. They switched to equities and crypto, then purely crypto in 2018.
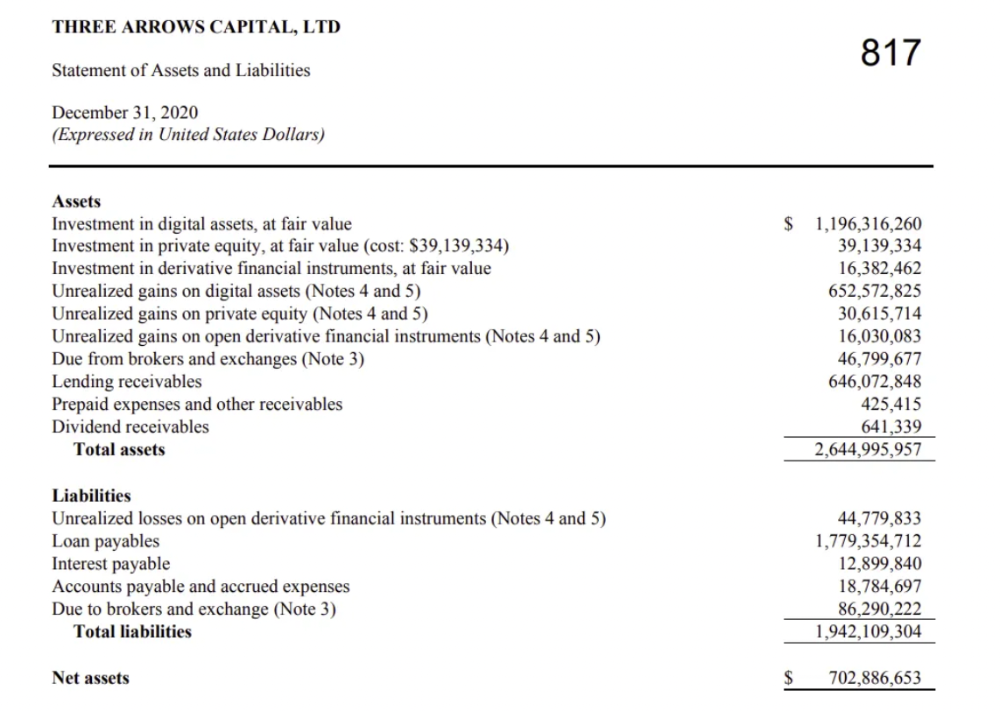
By 2020, the firm had $703mm in net assets and $1.8bn in loans (these guys really like debt).
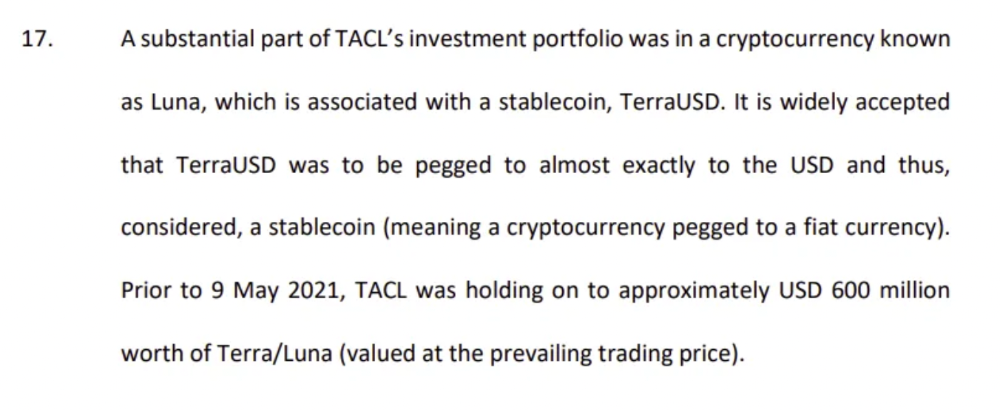
The firm's net assets under control reached $3bn in April 2022, according to the filings. 3AC had $600mm of LUNA/UST exposure before May 9th 2022, which put them over.
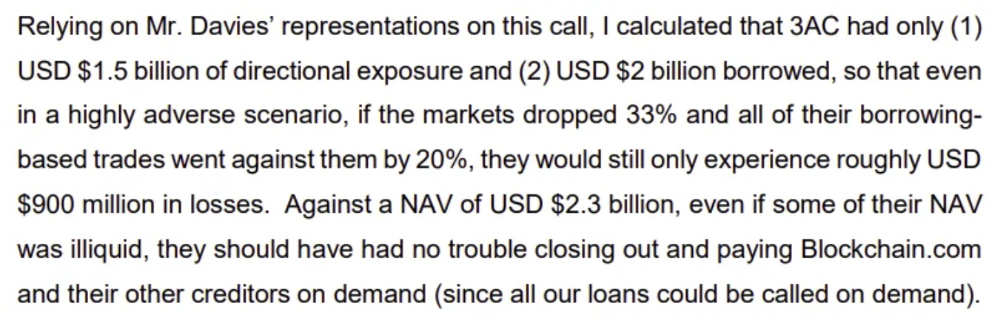
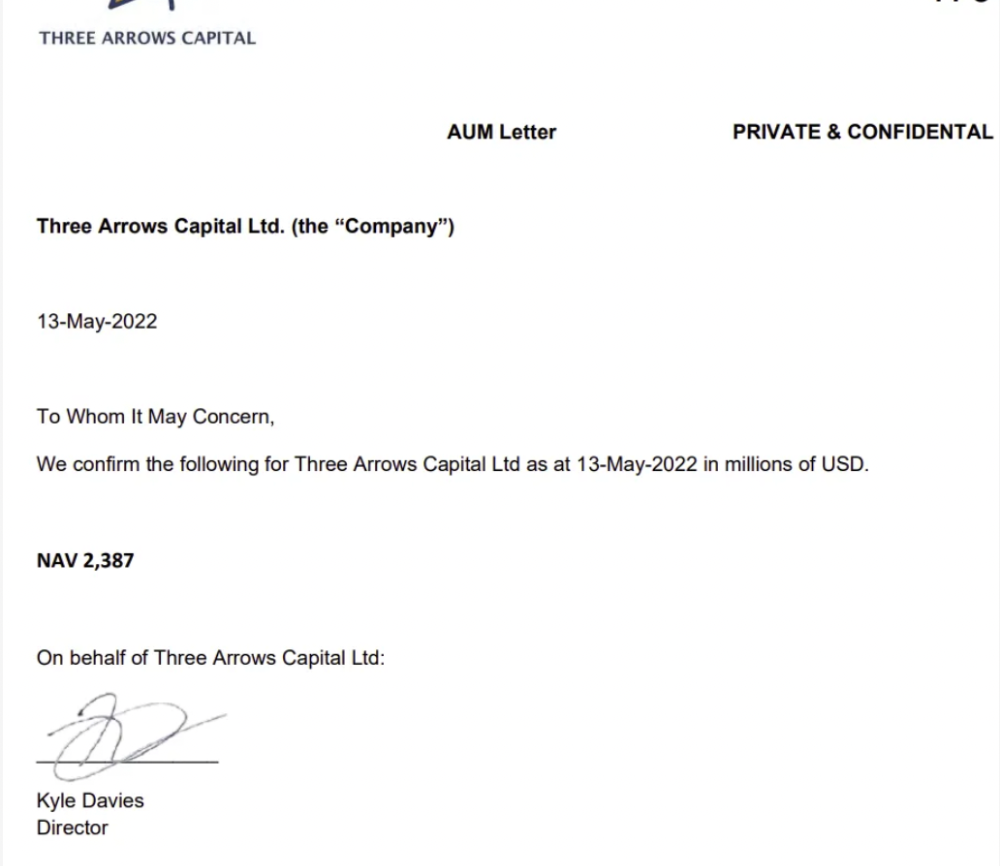
LUNA and UST go to zero quickly (I wrote about the mechanics of the blowup here). Kyle Davies, 3AC co-founder, told Blockchain.com on May 13 that they have $2.4bn in assets and $2.3bn NAV vs. $2bn in borrowings. As BTC and ETH plunged 33% and 50%, the company became insolvent by mid-2022.
3AC sent $32mm to Tai Ping Shen, a Cayman Islands business owned by Su Zhu and Davies' partner, Kelly Kaili Chen (who knows what is going on here).
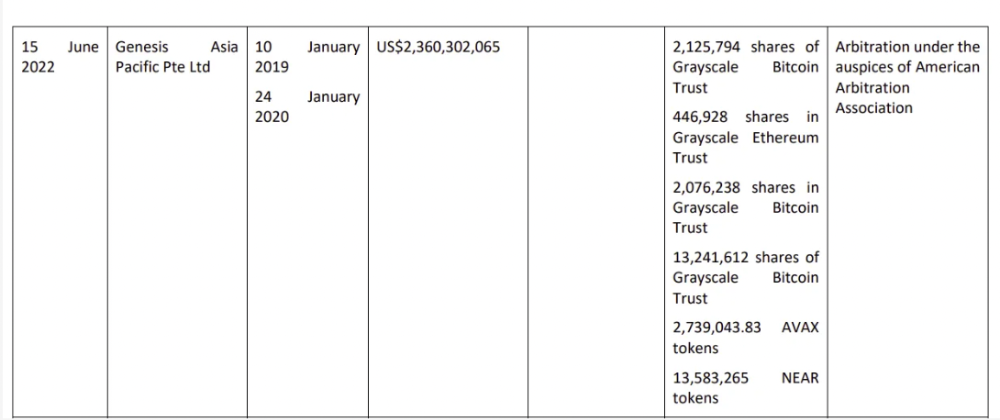
3AC had borrowed over $3.5bn in notional principle, with Genesis ($2.4bn) and Voyager ($650mm) having the most exposure.
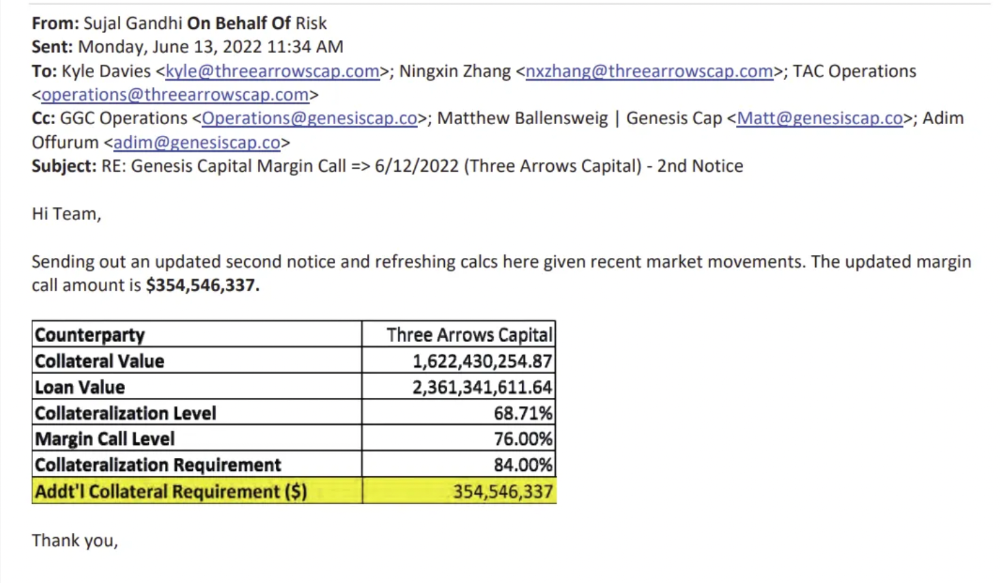
Genesis demanded $355mm in further collateral in June.
Deribit (another 3AC investment) called for $80 million in mid-June.
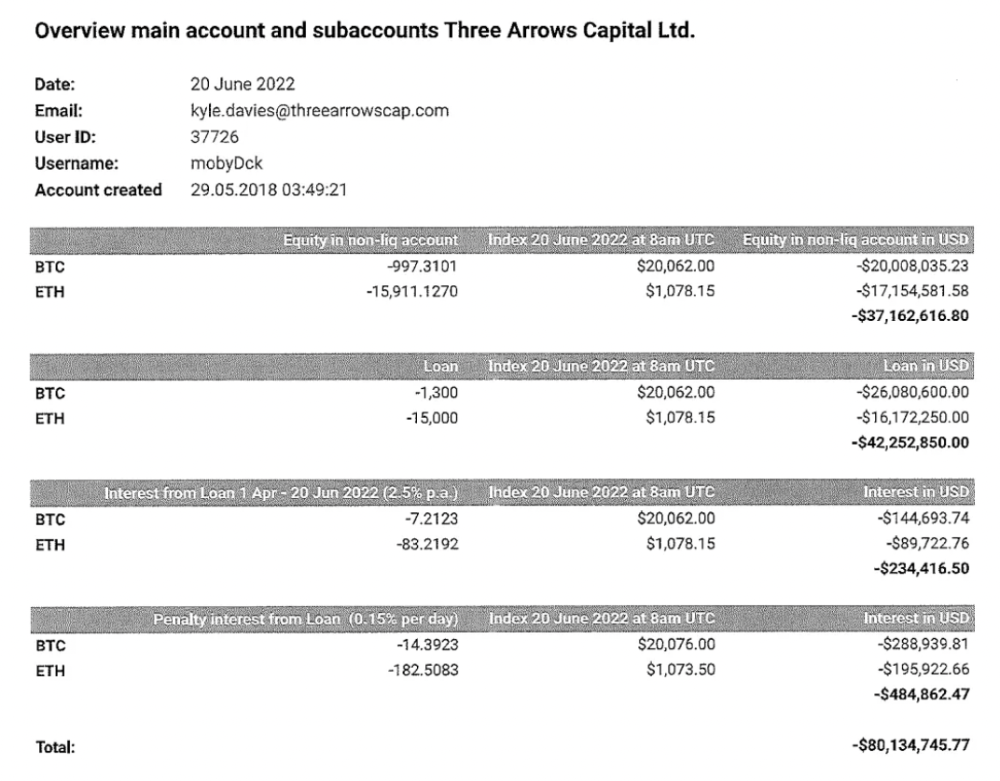
Even in mid-June, the corporation was trying to borrow more money to stay afloat. They approached Genesis for another $125mm loan (to pay another lender) and HODLnauts for BTC & ETH loans.
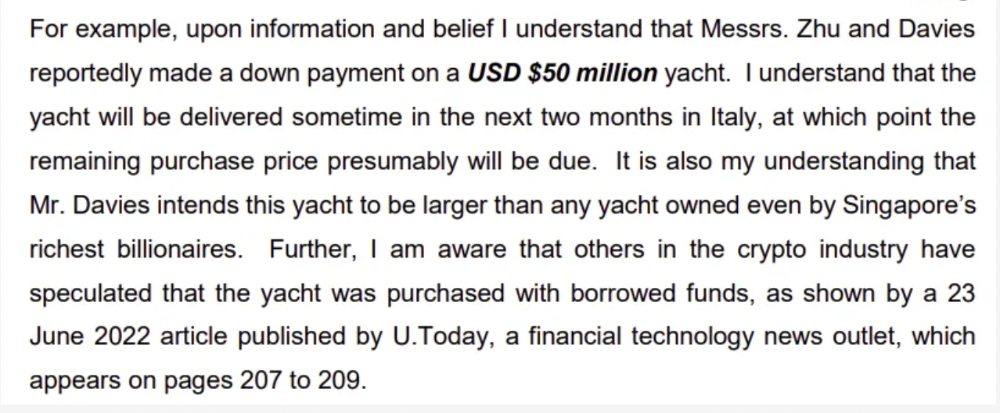
Pretty crazy. 3AC founders used borrowed money to buy a $50 million boat, according to the leak.
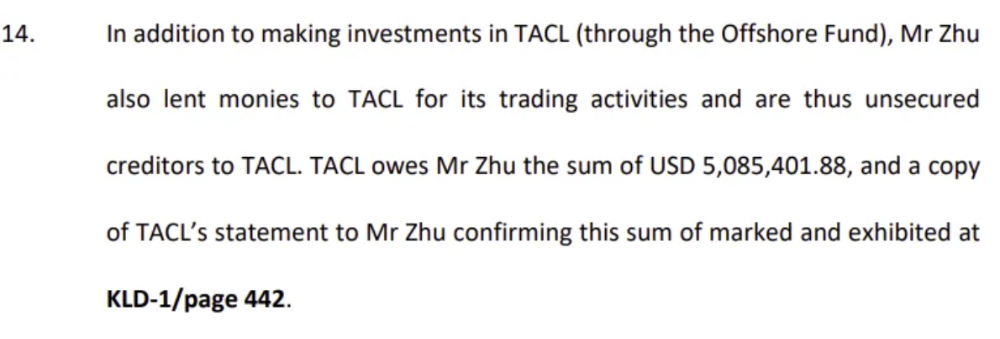
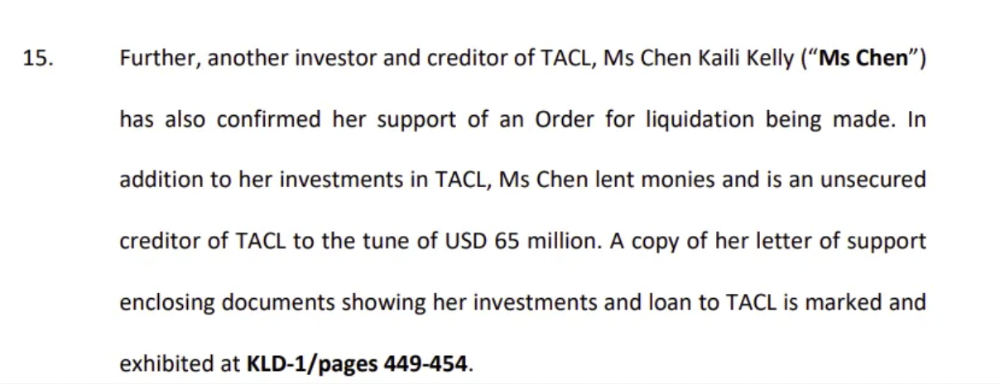
Su requesting for $5m + Chen Kaili Kelly asserting they loaned $65m unsecured to 3AC are identified as creditors.
Celsius:
This bankruptcy presentation shows the Celsius breakdown from March to July 14, 2022. From $22bn to $4bn, crypto assets plummeted from $14.6bn to $1.8bn (ouch). $16.5bn in user liabilities dropped to $4.72bn.
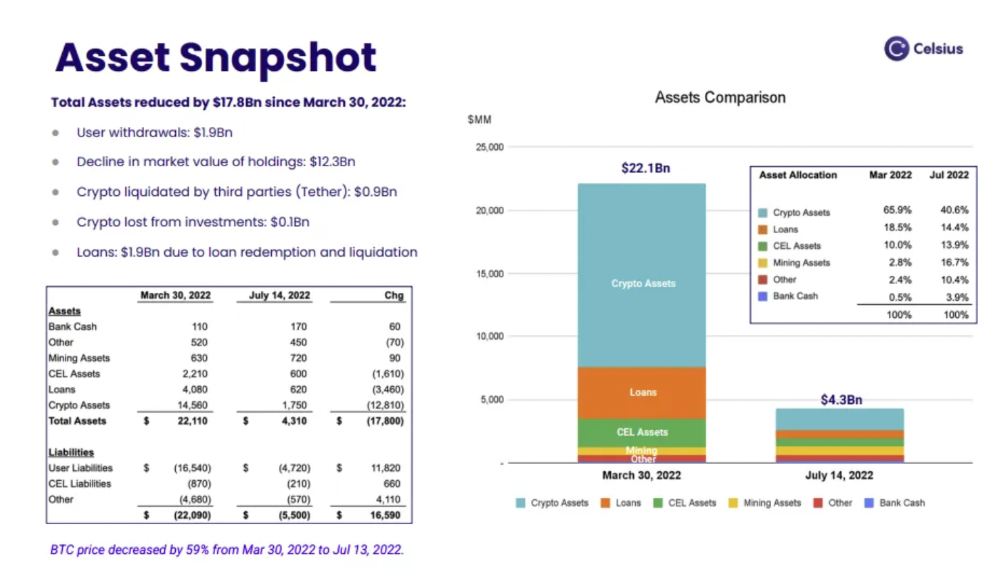
In my recent post, I examined if "forced selling" is over, with Celsius' crypto assets being a major overhang. In this presentation, it looks that Chapter 11 will provide clients the opportunity to accept cash at a discount or remain long crypto. Provided that a fresh source of money is unlikely to enter the Celsius situation, cash at a discount or crypto given to customers will likely remain a near-term market risk - cash at a discount will likely come from selling crypto assets, while customers who receive crypto could sell at any time. I'll share any Celsius updates I find.
Conclusion
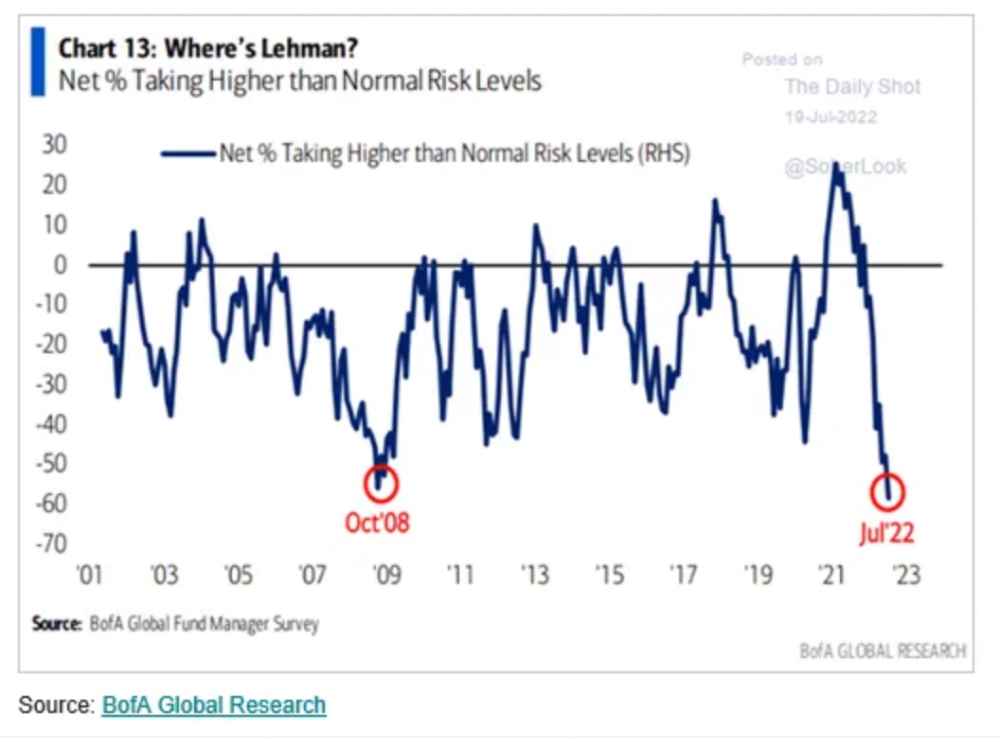
Only Celsius and the Mt Gox BTC unlock remain as forced selling catalysts. While everything went through a "relief" pump, with ETH up 75% from the bottom and numerous alts multiples higher, there are still macro dangers to equities + risk assets. There's a lot of wealth waiting to be deployed in crypto ($153bn in stables), but fund managers are risk apprehensive (lower than 2008 levels).
We're hopefully over crypto's "bottom," with peak anxiety and forced selling behind us, but we may chop around.
To see the full article, click here.
You might also like

Jano le Roux
3 years ago
Here's What I Learned After 30 Days Analyzing Apple's Microcopy
Move people with tiny words.
Apple fanboy here.
Macs are awesome.
Their iPhones rock.
$19 cloths are great.
$999 stands are amazing.
I love Apple's microcopy even more.
It's like the marketing goddess bit into the Apple logo and blessed the world with microcopy.
I took on a 30-day micro-stalking mission.
Every time I caught myself wasting time on YouTube, I had to visit Apple’s website to learn the secrets of the marketing goddess herself.
We've learned. Golden apples are calling.
Cut the friction
Benefit-first, not commitment-first.
Brands lose customers through friction.
Most brands don't think like customers.
Brands want sales.
Brands want newsletter signups.
Here's their microcopy:
“Buy it now.”
“Sign up for our newsletter.”
Both are difficult. They ask for big commitments.
People are simple creatures. Want pleasure without commitment.
Apple nails this.
So, instead of highlighting the commitment, they highlight the benefit of the commitment.
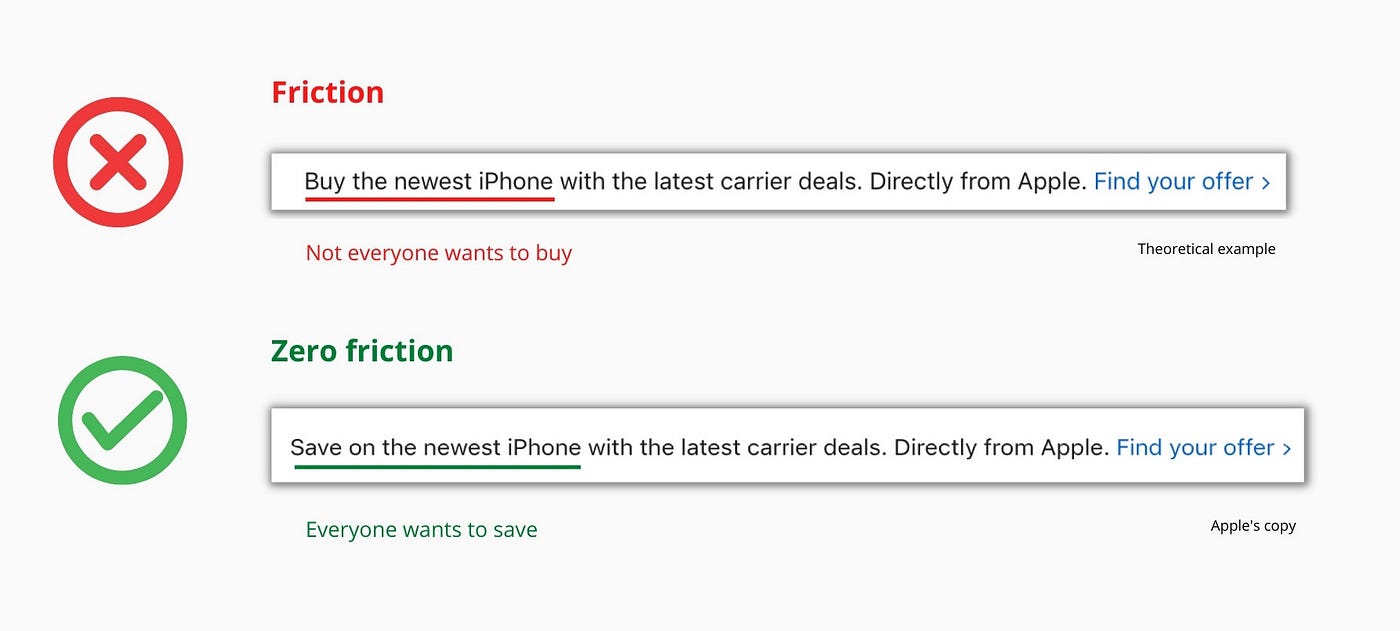
Saving on the latest iPhone sounds easier than buying it. Everyone saves, but not everyone buys.
A subtle change in framing reduces friction.
Apple eliminates customer objections to reduce friction.
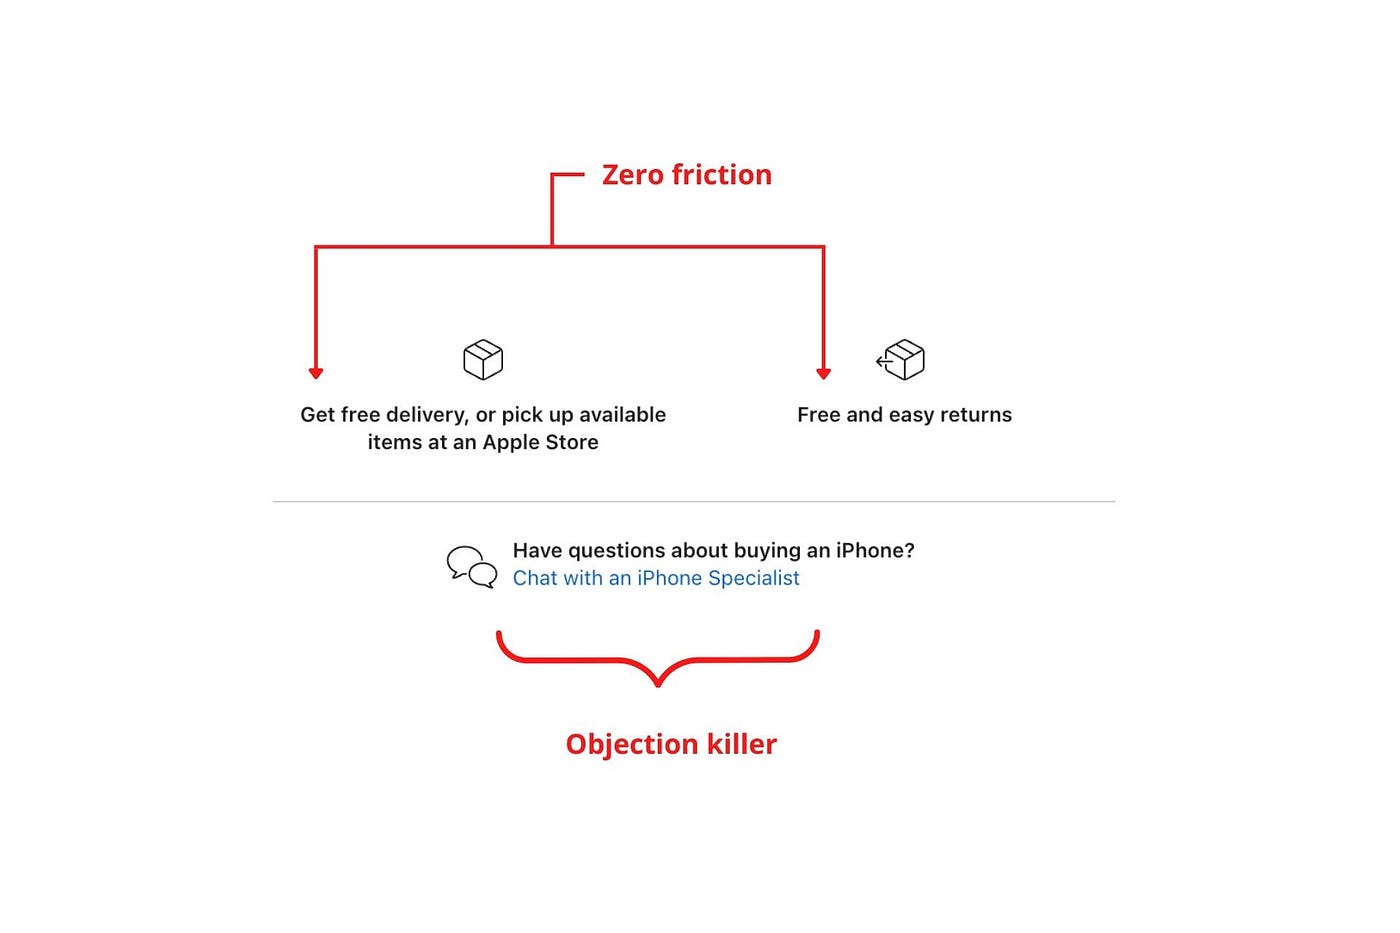
Less customer friction means simpler processes.
Apple's copy expertly reassures customers about shipping fees and not being home. Apple assures customers that returning faulty products is easy.
Apple knows that talking to a real person is the best way to reduce friction and improve their copy.
Always rhyme
Learn about fine rhyme.
Poets make things beautiful with rhyme.
Copywriters use rhyme to stand out.
Apple’s copywriters have mastered the art of corporate rhyme.
Two techniques are used.
1. Perfect rhyme
Here, rhymes are identical.

2. Imperfect rhyme
Here, rhyming sounds vary.

Apple prioritizes meaning over rhyme.
Apple never forces rhymes that don't fit.
It fits so well that the copy seems accidental.
Add alliteration
Alliteration always entertains.
Alliteration repeats initial sounds in nearby words.
Apple's copy uses alliteration like no other brand I've seen to create a rhyming effect or make the text more fun to read.
For example, in the sentence "Sam saw seven swans swimming," the initial "s" sound is repeated five times. This creates a pleasing rhythm.
Microcopy overuse is like pouring ketchup on a Michelin-star meal.
Alliteration creates a memorable phrase in copywriting. It's subtler than rhyme, and most people wouldn't notice; it simply resonates.
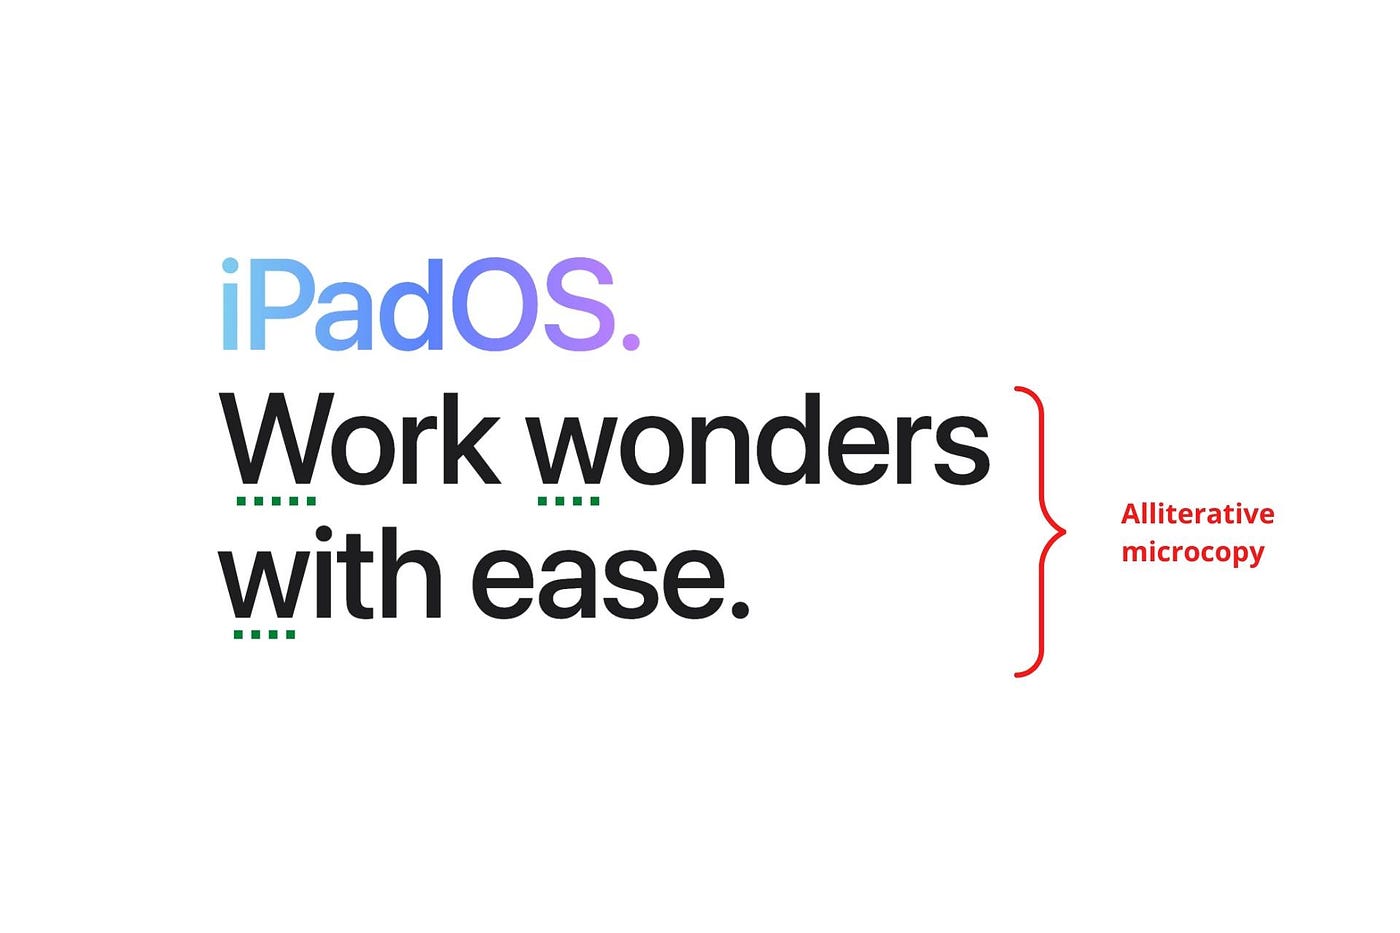
I love how Apple uses alliteration and contrast between "wonders" and "ease".
Assonance, or repeating vowels, isn't Apple's thing.
You ≠ Hero, Customer = Hero
Your brand shouldn't be the hero.
Because they'll be using your product or service, your customer should be the hero of your copywriting. With your help, they should feel like they can achieve their goals.
I love how Apple emphasizes what you can do with the machine in this microcopy.

It's divine how they position their tools as sidekicks to help below.

This one takes the cake:

Dialogue-style writing
Conversational copy engages.
Excellent copy Like sharing gum with a friend.
This helps build audience trust.
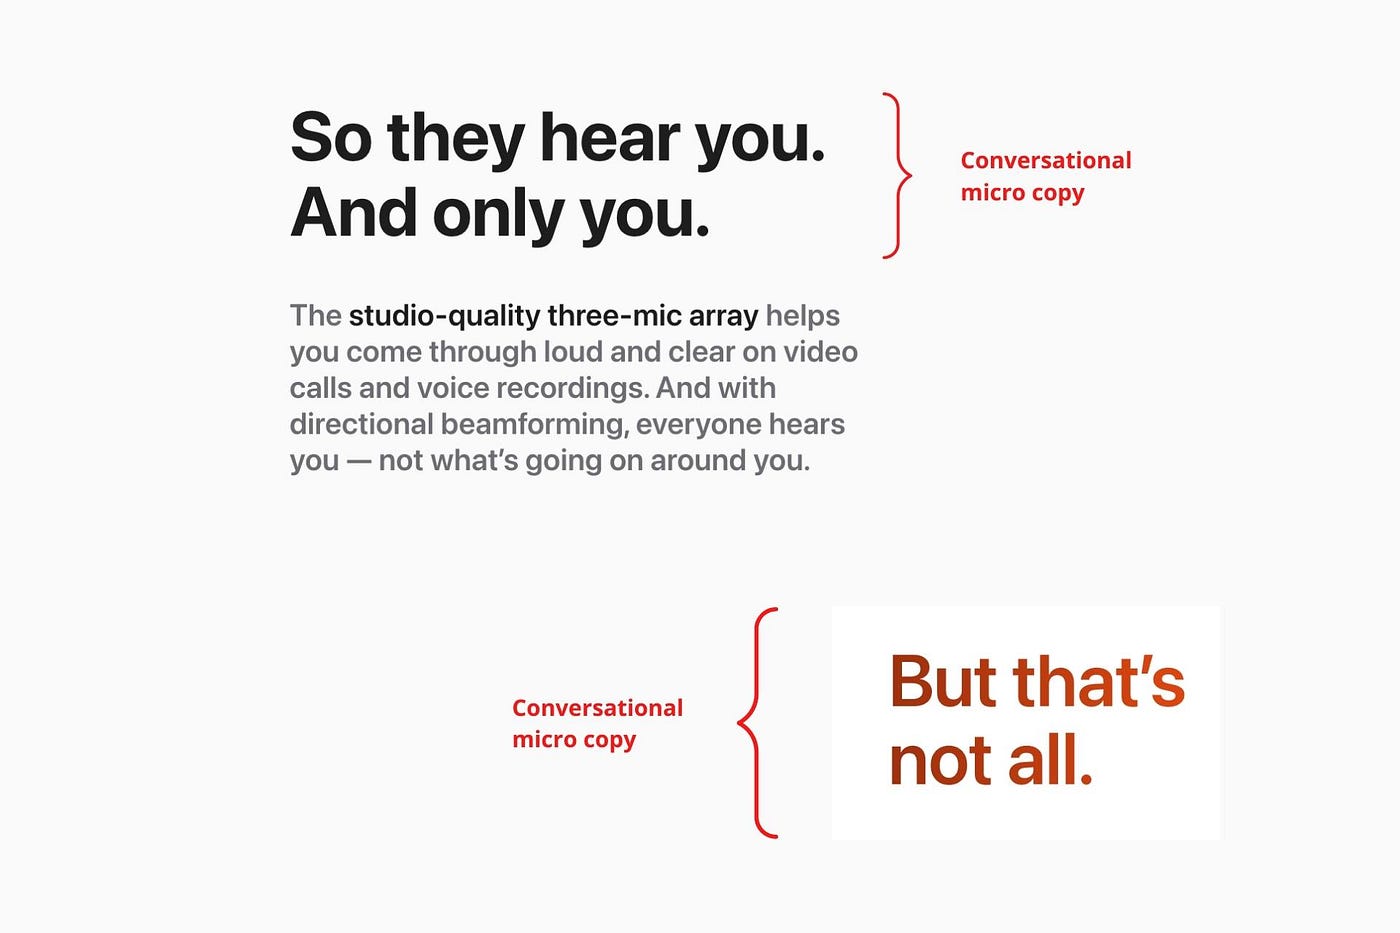
Apple does this by using natural connecting words like "so" and phrases like "But that's not all."
Snowclone-proof
The mother of all microcopy techniques.
A snowclone uses an existing phrase or sentence to create a new one. The new phrase or sentence uses the same structure but different words.
It’s usually a well know saying like:
To be or not to be.
This becomes a formula:
To _ or not to _.
Copywriters fill in the blanks with cause-related words. Example:
To click or not to click.

Apple turns "survival of the fittest" into "arrival of the fittest."
It's unexpected and surprises the reader.
So this was fun.
But my fun has just begun.
Microcopy is 21st-century poetry.
I came as an Apple fanboy.
I leave as an Apple fanatic.
Now I’m off to find an apple tree.
Cause you know how it goes.
(Apples, trees, etc.)
This post is a summary. Original post available here.

Victoria Kurichenko
3 years ago
My Blog Is in Google's Top 10—Here's How to Compete
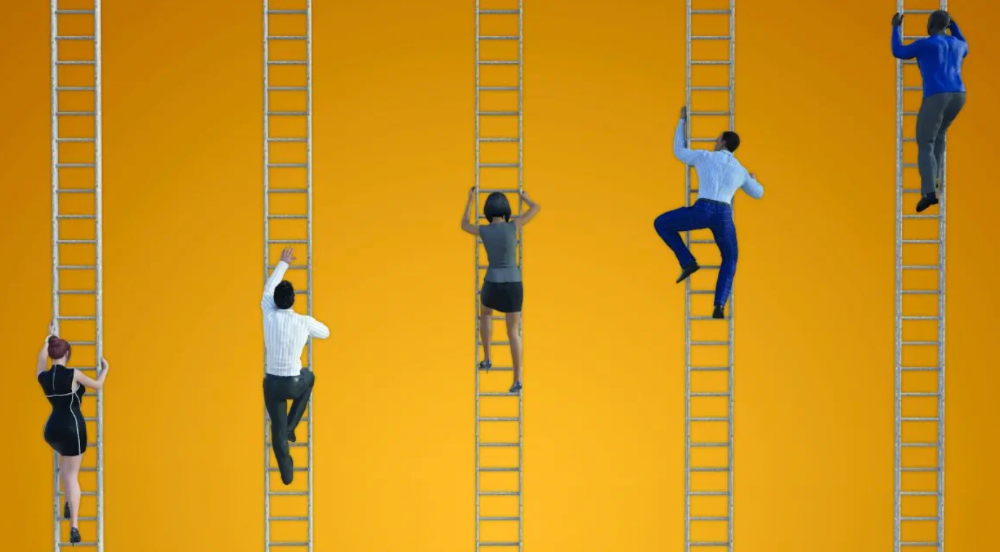
"Competition" is beautiful and hateful.
Some people bury their dreams because they are afraid of competition. Others challenge themselves, shaping our world.
Competition is normal.
It spurs innovation and progress.
I wish more people agreed.
As a marketer, content writer, and solopreneur, my readers often ask:
"I want to create a niche website, but I have no ideas. Everything's done"
"Is a website worthwhile?"
I can't count how many times I said, "Yes, it makes sense, and you can succeed in a competitive market."
I encourage and share examples, but it's not enough to overcome competition anxiety.
I launched an SEO writing website for content creators a year ago, knowing it wouldn't beat Ahrefs, Semrush, Backlinko, etc.
Not needed.
Many of my website's pages rank highly on Google.
Everyone can eat the pie.
In a competitive niche, I took a different approach.
Look farther
When chatting with bloggers that want a website, I discovered something fascinating.
They want to launch a website but have no ideas. As a next step, they start listing the interests they believe they should work on, like wellness, lifestyle, investments, etc. I could keep going.
Too many generalists who claim to know everything confuse many.
Generalists aren't trusted.
We want someone to fix our problems immediately.
I don't think broad-spectrum experts are undervalued. People have many demands that go beyond generalists' work. Narrow-niche experts can help.
I've done SEO for three years. I learned from experts and courses. I couldn't find a comprehensive SEO writing resource.
I read tons of articles before realizing that wasn't it. I took courses that covered SEO basics eventually.
I had a demand for learning SEO writing, but there was no solution on the market. My website fills this micro-niche.
Have you ever had trouble online?
Professional courses too general, boring, etc.?
You've bought off-topic books, right?
You're not alone.
Niche ideas!
Big players often disregard new opportunities. Too small. Individual content creators can succeed here.
In a competitive market:
Never choose wide subjects
Think about issues you can relate to and have direct experience with.
Be a consumer to discover both the positive and negative aspects of a good or service.
Merchandise your annoyances.
Consider ways to transform your frustrations into opportunities.
The right niche is half-success. Here is what else I did to hit the Google front page with my website.
An innovative method for choosing subjects
Why publish on social media and websites?
Want likes, shares, followers, or fame?
Some people do it for fun. No judgment.
I bet you want more.
You want to make decent money from blogging.
Writing about random topics, even if they are related to your niche, won’t help you attract an audience from organic search. I'm a marketer and writer.
I worked at companies with dead blogs because they posted for themselves, not readers. They did not follow SEO writing rules; that’s why most of their content flopped.
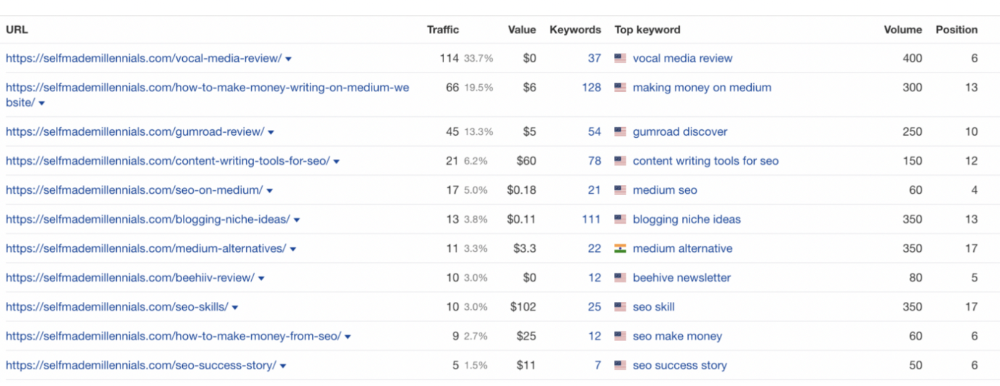
I learned these hard lessons and grew my website from 0 to 3,000+ visitors per month while working on it a few hours a week only. Evidence:
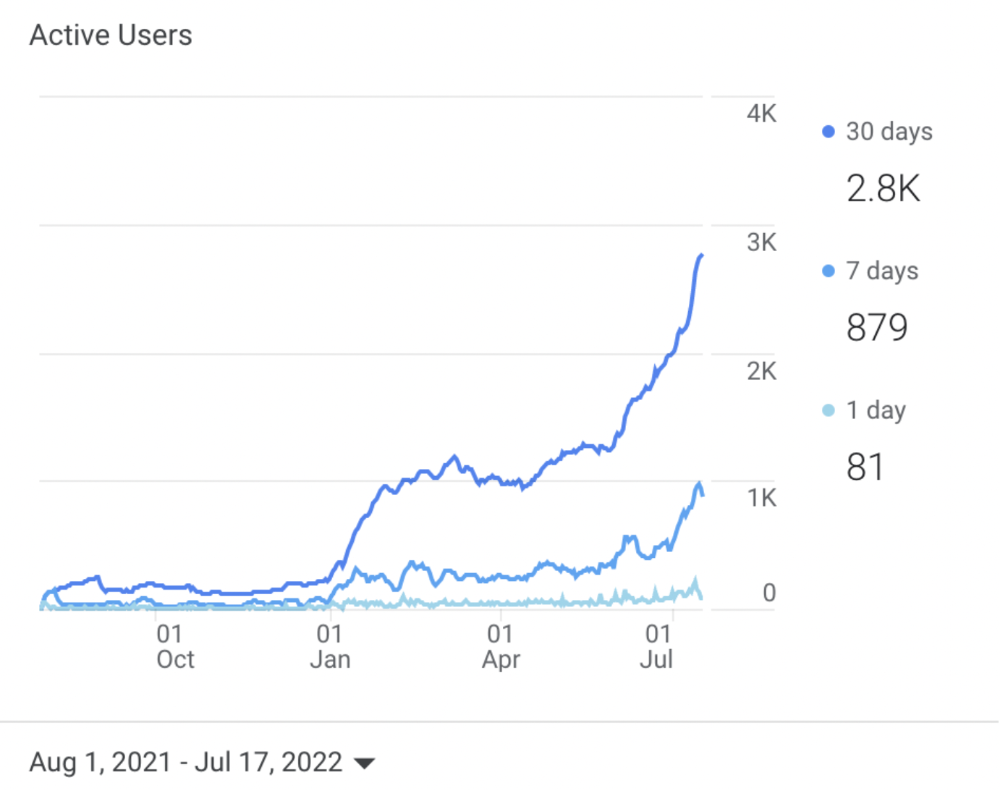
I choose website topics using these criteria:
- Business potential. The information should benefit my audience and generate revenue. There would be no use in having it otherwise.
My topics should help me:
Attract organic search traffic with my "fluff-free" content -> Subscribers > SEO ebook sales.
Simple and effective.
- traffic on search engines. The number of monthly searches reveals how popular my topic is all across the world. If I find that no one is interested in my suggested topic, I don't write a blog article.
- Competition. Every search term is up against rivals. Some are more popular (thus competitive) since more websites target them in organic search. A new website won't score highly for keywords that are too competitive. On the other side, keywords with moderate to light competition can help you rank higher on Google more quickly.
- Search purpose. The "why" underlying users' search requests is revealed. I analyze search intent to understand what users need when they plug various queries in the search bar and what content can perfectly meet their needs.
My specialty website produces money, ranks well, and attracts the target audience because I handpick high-traffic themes.
Following these guidelines, even a new website can stand out.
I wrote a 50-page SEO writing guide where I detailed topic selection and share my front-page Google strategy.
My guide can help you run a successful niche website.
In summary
You're not late to the niche-website party.
The Internet offers many untapped opportunities.
We need new solutions and are willing to listen.
There are unexplored niches in any topic.
Don't fight giants. They have their piece of the pie. They might overlook new opportunities while trying to keep that piece of the pie. You should act now.

Patryk Nawrocki
3 years ago
7 things a new UX/UI designer should know

If I could tell my younger self a few rules, they would boost my career.
1. Treat design like medicine; don't get attached.

If it doesn't help, you won't be angry, but you'll try to improve it. Designers blame others if they don't like the design, but the rule is the same: we solve users' problems. You're not your design, and neither are they. Be humble with your work because your assumptions will often be wrong and users will behave differently.
2. Consider your design flawed.
Disagree with yourself, then defend your ideas. Most designers forget to dig deeper into a pattern, screen, button, or copywriting. If someone asked, "Have you considered alternatives? How does this design stack up? Here's a functional UX checklist to help you make design decisions.
3. Codeable solutions.
If your design requires more developer time, consider whether it's worth spending more money to code something with a small UX impact. Overthinking problems and designing abstract patterns is easy. Sometimes you see something on dribbble or bechance and try to recreate it, but it's not worth it. Here's my article on it.
4. Communication changes careers

Designers often talk with users, clients, companies, developers, and other designers. How you talk and present yourself can land you a job. Like driving or swimming, practice it. Success requires being outgoing and friendly. If I hadn't said "hello" to a few people, I wouldn't be where I am now.
5. Ignorance of the law is not an excuse.
Copyright, taxation How often have you used an icon without checking its license? If you use someone else's work in your project, the owner can cause you a lot of problems — paying a lot of money isn't worth it. Spend a few hours reading about copyrights, client agreements, and taxes.
6. Always test your design

If nobody has seen or used my design, it's not finished. Ask friends about prototypes. Testing reveals how wrong your assumptions were. Steve Krug, one of the authorities on this topic will tell you more about how to do testing.
7. Run workshops
A UX designer's job involves talking to people and figuring out what they need, which is difficult because they usually don't know. Organizing teamwork sessions is a powerful skill, but you must also be a good listener. Your job is to help a quiet, introverted developer express his solution and control the group. AJ Smart has more on workshops here.