


An approximate introduction to how zk-SNARKs are possible (part 2)
If tasked with the problem of coming up with a zk-SNARK protocol, many people would make their way to this point and then get stuck and give up. How can a verifier possibly check every single piece of the computation, without looking at each piece of the computation individually? But it turns out that there is a clever solution.
Polynomials
Polynomials are a special class of algebraic expressions of the form:
- x+5
- x^4
- x^3+3x^2+3x+1
- 628x^{271}+318x^{270}+530x^{269}+…+69x+381
i.e. they are a sum of any (finite!) number of terms of the form cx^k
There are many things that are fascinating about polynomials. But here we are going to zoom in on a particular one: polynomials are a single mathematical object that can contain an unbounded amount of information (think of them as a list of integers and this is obvious). The fourth example above contained 816 digits of tau, and one can easily imagine a polynomial that contains far more.
Furthermore, a single equation between polynomials can represent an unbounded number of equations between numbers. For example, consider the equation A(x)+ B(x) = C(x). If this equation is true, then it's also true that:
- A(0)+B(0)=C(0)
- A(1)+B(1)=C(1)
- A(2)+B(2)=C(2)
- A(3)+B(3)=C(3)
And so on for every possible coordinate. You can even construct polynomials to deliberately represent sets of numbers so you can check many equations all at once. For example, suppose that you wanted to check:
- 12+1=13
- 10+8=18
- 15+8=23
- 15+13=28
You can use a procedure called Lagrange interpolation to construct polynomials A(x) that give (12,10,15,15) as outputs at some specific set of coordinates (eg. (0,1,2,3)), B(x) the outputs (1,8,8,13) on thos same coordinates, and so forth. In fact, here are the polynomials:
- A(x)=-2x^3+\frac{19}{2}x^2-\frac{19}{2}x+12
- B(x)=2x^3-\frac{19}{2}x^2+\frac{29}{2}x+1
- C(x)=5x+13
Checking the equation A(x)+B(x)=C(x) with these polynomials checks all four above equations at the same time.
Comparing a polynomial to itself
You can even check relationships between a large number of adjacent evaluations of the same polynomial using a simple polynomial equation. This is slightly more advanced. Suppose that you want to check that, for a given polynomial F, F(x+2)=F(x)+F(x+1) with the integer range {0,1…89} (so if you also check F(0)=F(1)=1, then F(100) would be the 100th Fibonacci number)
As polynomials, F(x+2)-F(x+1)-F(x) would not be exactly zero, as it could give arbitrary answers outside the range x={0,1…98}. But we can do something clever. In general, there is a rule that if a polynomial P is zero across some set S=\{x_1,x_2…x_n\} then it can be expressed as P(x)=Z(x)*H(x), where Z(x)=(x-x_1)*(x-x_2)*…*(x-x_n) and H(x) is also a polynomial. In other words, any polynomial that equals zero across some set is a (polynomial) multiple of the simplest (lowest-degree) polynomial that equals zero across that same set.
Why is this the case? It is a nice corollary of polynomial long division: the factor theorem. We know that, when dividing P(x) by Z(x), we will get a quotient Q(x) and a remainder R(x) is strictly less than that of Z(x). Since we know that P is zero on all of S, it means that R has to be zero on all of S as well. So we can simply compute R(x) via polynomial interpolation, since it's a polynomial of degree at most n-1 and we know n values (the zeros at S). Interpolating a polynomial with all zeroes gives the zero polynomial, thus R(x)=0 and H(x)=Q(x).
Going back to our example, if we have a polynomial F that encodes Fibonacci numbers (so F(x+2)=F(x)+F(x+1) across x=\{0,1…98\}), then I can convince you that F actually satisfies this condition by proving that the polynomial P(x)=F(x+2)-F(x+1)-F(x) is zero over that range, by giving you the quotient:
H(x)=\frac{F(x+2)-F(x+1)-F(x)}{Z(x)}
Where Z(x) = (x-0)*(x-1)*…*(x-98).
You can calculate Z(x) yourself (ideally you would have it precomputed), check the equation, and if the check passes then F(x) satisfies the condition!
Now, step back and notice what we did here. We converted a 100-step-long computation into a single equation with polynomials. Of course, proving the N'th Fibonacci number is not an especially useful task, especially since Fibonacci numbers have a closed form. But you can use exactly the same basic technique, just with some extra polynomials and some more complicated equations, to encode arbitrary computations with an arbitrarily large number of steps.
see part 3
(Edited)

Hackernoon
4 years ago
👏 Awesome post! When is part 3 coming?

Trent Lapinski
4 years ago
Very complex topic, great explanation
More on Web3 & Crypto

Jayden Levitt
3 years ago
The country of El Salvador's Bitcoin-obsessed president lost $61.6 million.
It’s only a loss if you sell, right?
Nayib Bukele proclaimed himself “the world’s coolest dictator”.
His jokes aren't clear.
El Salvador's 43rd president self-proclaimed “CEO of El Salvador” couldn't be less presidential.
His thin jeans, aviator sunglasses, and baseball caps like a cartel lord.
He's popular, though.
Bukele won 53% of the vote by fighting violent crime and opposition party corruption.
El Salvador's 6.4 million inhabitants are riding the cryptocurrency volatility wave.
They were powerless.
Their autocratic leader, a former Yamaha Motors salesperson and Bitcoin believer, wants to help 70% unbanked locals.
He intended to give the citizens a way to save money and cut the country's $200 million remittance cost.
Transfer and deposit costs.
This makes logical sense when the president’s theatrics don’t blind you.
El Salvador's Bukele revealed plans to make bitcoin legal tender.
Remittances total $5.9 billion (23%) of the country's expenses.
Anything that reduces costs could boost the economy.
The country’s unbanked population is staggering. Here’s the data by % of people who either have a bank account (Blue) or a mobile money account (Black).
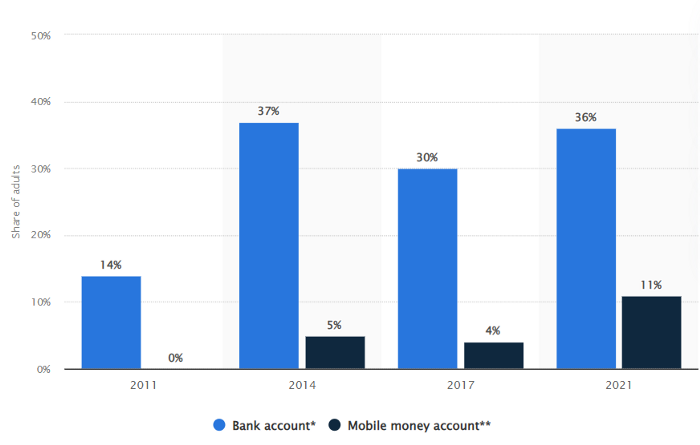
According to Bukele, 46% of the population has downloaded the Chivo Bitcoin Wallet.
In 2021, 36% of El Salvadorans had bank accounts.
Large rural countries like Kenya seem to have resolved their unbanked dilemma.
An economy surfaced where village locals would sell, trade and store network minutes and data as a store of value.
Kenyan phone networks realized unbanked people needed a safe way to accumulate wealth and have an emergency fund.
96% of Kenyans utilize M-PESA, which doesn't require a bank account.
The software involves human agents who hang out with cash and a phone.
These people are like ATMs.
You offer them cash to deposit money in your mobile money account or withdraw cash.
In a country with a faulty banking system, cash availability and a safe place to deposit it are important.
William Jack and Tavneet Suri found that M-PESA brought 194,000 Kenyan households out of poverty by making transactions cheaper and creating a safe store of value.
Mobile money, a service that allows monetary value to be stored on a mobile phone and sent to other users via text messages, has been adopted by most Kenyan households. We estimate that access to the Kenyan mobile money system M-PESA increased per capita consumption levels and lifted 194,000 households, or 2% of Kenyan households, out of poverty.
The impacts, which are more pronounced for female-headed households, appear to be driven by changes in financial behaviour — in particular, increased financial resilience and saving. Mobile money has therefore increased the efficiency of the allocation of consumption over time while allowing a more efficient allocation of labour, resulting in a meaningful reduction of poverty in Kenya.
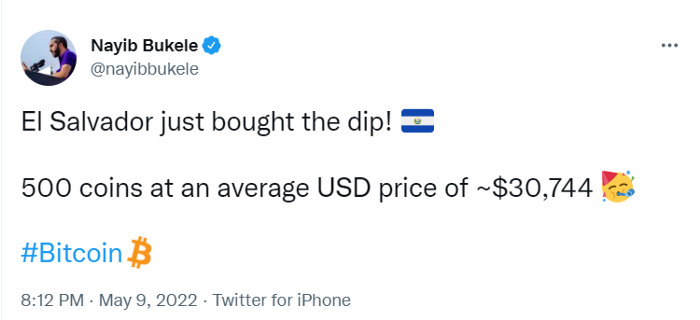
Currently, El Salvador has 2,301 Bitcoin.
At publication, it's worth $44 million. That remains 41% of Bukele's original $105.6 million.
Unknown if the country has sold Bitcoin, but Bukeles keeps purchasing the dip.
It's still falling.
This might be a fantastic move for the impoverished country over the next five years, if they can live economically till Bitcoin's price recovers.
The evidence demonstrates that a store of value pulls individuals out of poverty, but others say Bitcoin is premature.
You may regard it as an aggressive endeavor to front run the next wave of adoption, offering El Salvador a financial upside.

Henrique Centieiro
4 years ago
DAO 101: Everything you need to know
Maybe you'll work for a DAO next! Over $1 Billion in NFTs in the Flamingo DAO Another DAO tried to buy the NFL team Denver Broncos. The UkraineDAO raised over $7 Million for Ukraine. The PleasrDAO paid $4m for a Wu-Tang Clan album that belonged to the “pharma bro.”
DAOs move billions and employ thousands. So learn what a DAO is, how it works, and how to create one!
DAO? So, what? Why is it better?
A Decentralized Autonomous Organization (DAO). Some people like to also refer to it as Digital Autonomous Organization, but I prefer the former.
They are virtual organizations. In the real world, you have organizations or companies right? These firms have shareholders and a board. Usually, anyone with authority makes decisions. It could be the CEO, the Board, or the HIPPO. If you own stock in that company, you may also be able to influence decisions. It's now possible to do something similar but much better and more equitable in the cryptocurrency world.
This article informs you:
DAOs- What are the most common DAOs, their advantages and disadvantages over traditional companies? What are they if any?
Is a DAO legally recognized?
How secure is a DAO?
I’m ready whenever you are!
A DAO is a type of company that is operated by smart contracts on the blockchain. Smart contracts are computer code that self-executes our commands. Those contracts can be any. Most second-generation blockchains support smart contracts. Examples are Ethereum, Solana, Polygon, Binance Smart Chain, EOS, etc. I think I've gone off topic. Back on track. Now let's go!
Unlike traditional corporations, DAOs are governed by smart contracts. Unlike traditional company governance, DAO governance is fully transparent and auditable. That's one of the things that sets it apart. The clarity!
A DAO, like a traditional company, has one major difference. In other words, it is decentralized. DAOs are more ‘democratic' than traditional companies because anyone can vote on decisions. Anyone! In a DAO, we (you and I) make the decisions, not the top-shots. We are the CEO and investors. A DAO gives its community members power. We get to decide.
As long as you are a stakeholder, i.e. own a portion of the DAO tokens, you can participate in the DAO. Tokens are open to all. It's just a matter of exchanging it. Ownership of DAO tokens entitles you to exclusive benefits such as governance, voting, and so on. You can vote for a move, a plan, or the DAO's next investment. You can even pitch for funding. Any ‘big' decision in a DAO requires a vote from all stakeholders. In this case, ‘token-holders'! In other words, they function like stock.
What are the 5 DAO types?
Different DAOs exist. We will categorize decentralized autonomous organizations based on their mode of operation, structure, and even technology. Here are a few. You've probably heard of them:
1. DeFi DAO
These DAOs offer DeFi (decentralized financial) services via smart contract protocols. They use tokens to vote protocol and financial changes. Uniswap, Aave, Maker DAO, and Olympus DAO are some examples. Most DAOs manage billions.
Maker DAO was one of the first protocols ever created. It is a decentralized organization on the Ethereum blockchain that allows cryptocurrency lending and borrowing without a middleman.
Maker DAO issues DAI, a stable coin. DAI is a top-rated USD-pegged stable coin.
Maker DAO has an MKR token. These token holders are in charge of adjusting the Dai stable coin policy. Simply put, MKR tokens represent DAO “shares”.
2. Investment DAO
Investors pool their funds and make investment decisions. Investing in new businesses or art is one example. Investment DAOs help DeFi operations pool capital. The Meta Cartel DAO is a community of people who want to invest in new projects built on the Ethereum blockchain. Instead of investing one by one, they want to pool their resources and share ideas on how to make better financial decisions.
Other investment DAOs include the LAO and Friends with Benefits.
3. DAO Grant/Launchpad
In a grant DAO, community members contribute funds to a grant pool and vote on how to allocate and distribute them. These DAOs fund new DeFi projects. Those in need only need to apply. The Moloch DAO is a great Grant DAO. The tokens are used to allocate capital. Also see Gitcoin and Seedify.
4. DAO Collector
I debated whether to put it under ‘Investment DAO' or leave it alone. It's a subset of investment DAOs. This group buys non-fungible tokens, artwork, and collectibles. The market for NFTs has recently exploded, and it's time to investigate. The Pleasr DAO is a collector DAO. One copy of Wu-Tang Clan's "Once Upon a Time in Shaolin" cost the Pleasr DAO $4 million. Pleasr DAO is known for buying Doge meme NFT. Collector DAOs include the Flamingo, Mutant Cats DAO, and Constitution DAOs. Don't underestimate their websites' "childish" style. They have millions.
5. Social DAO
These are social networking and interaction platforms. For example, Decentraland DAO and Friends With Benefits DAO.
What are the DAO Benefits?
Here are some of the benefits of a decentralized autonomous organization:
- They are trustless. You don’t need to trust a CEO or management team
- It can’t be shut down unless a majority of the token holders agree. The government can't shut - It down because it isn't centralized.
- It's fully democratic
- It is open-source and fully transparent.
What about DAO drawbacks?
We've been saying DAOs are the bomb? But are they really the shit? What could go wrong with DAO?
DAOs may contain bugs. If they are hacked, the results can be catastrophic.
No trade secrets exist. Because the smart contract is transparent and coded on the blockchain, it can be copied. It may be used by another organization without credit. Maybe DAOs should use Secret, Oasis, or Horizen blockchain networks.
Are DAOs legally recognized??
In most counties, DAO regulation is inexistent. It's unclear. Most DAOs don’t have a legal personality. The Howey Test and the Securities Act of 1933 determine whether DAO tokens are securities. Although most countries follow the US, this is only considered for the US. Wyoming became the first state to recognize DAOs as legal entities in July 2021 after passing a DAO bill. DAOs registered in Wyoming are thus legally recognized as business entities in the US and thus receive the same legal protections as a Limited Liability Company.
In terms of cyber-security, how secure is a DAO?
Blockchains are secure. However, smart contracts may have security flaws or bugs. This can be avoided by third-party smart contract reviews, testing, and auditing
Finally, Decentralized Autonomous Organizations are timeless. Let us examine the current situation: Ukraine's invasion. A DAO was formed to help Ukrainian troops fighting the Russians. It was named Ukraine DAO. Pleasr DAO, NFT studio Trippy Labs, and Russian art collective Pussy Riot organized this fundraiser. Coindesk reports that over $3 million has been raised in Ethereum-based tokens. AidForUkraine, a DAO aimed at supporting Ukraine's defense efforts, has launched. Accepting Solana token donations. They are fully transparent, uncensorable, and can’t be shut down or sanctioned.
DAOs are undeniably the future of blockchain. Everyone is paying attention. Personally, I believe traditional companies will soon have to choose between adapting or being left behind.
Long version of this post: https://medium.datadriveninvestor.com/dao-101-all-you-need-to-know-about-daos-275060016663

Stephen Moore
3 years ago
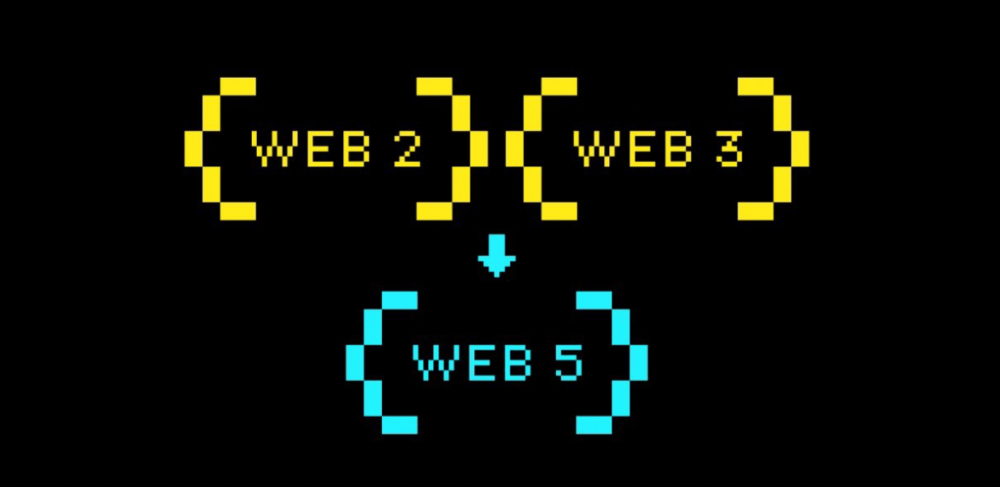
Web 2 + Web 3 = Web 5.
Monkey jpegs and shitcoins have tarnished Web3's reputation. Let’s move on.
Web3 was called "the internet's future."
Well, 'crypto bros' shouted about it loudly.
As quickly as it arrived to be the next internet, it appears to be dead. It's had scandals, turbulence, and crashes galore:
Web 3.0's cryptocurrencies have crashed. Bitcoin's all-time high was $66,935. This month, Ethereum fell from $2130 to $1117. Six months ago, the cryptocurrency market peaked at $3 trillion. Worst is likely ahead.
Gas fees make even the simplest Web3 blockchain transactions unsustainable.
Terra, Luna, and other dollar pegs collapsed, hurting crypto markets. Celsius, a crypto lender backed by VCs and Canada's second-largest pension fund, and Binance, a crypto marketplace, have withheld money and coins. They're near collapse.
NFT sales are falling rapidly and losing public interest.
Web3 has few real-world uses, like most crypto/blockchain technologies. Web3's image has been tarnished by monkey profile pictures and shitcoins while failing to become decentralized (the whole concept is controlled by VCs).
The damage seems irreparable, leaving Web3 in the gutter.
Step forward our new saviour — Web5
Fear not though, as hero awaits to drag us out of the Web3 hellscape. Jack Dorsey revealed his plan to save the internet quickly.
Dorsey has long criticized Web3, believing that VC capital and silicon valley insiders have created a centralized platform. In a tweet that upset believers and VCs (he was promptly blocked by Marc Andreessen), Dorsey argued, "You don't own "Web3." VCs and LPs do. Their incentives prevent it. It's a centralized organization with a new name.
Dorsey announced Web5 on June 10 in a very Elon-like manner. Block's TBD unit will work on the project (formerly Square).
Web5's pitch is that users will control their own data and identity. Bitcoin-based. Sound familiar? The presentation pack's official definition emphasizes decentralization. Web5 is a decentralized web platform that enables developers to write decentralized web apps using decentralized identifiers, verifiable credentials, and decentralized web nodes, returning ownership and control over identity and data to individuals.
Web5 would be permission-less, open, and token-less. What that means for Earth is anyone's guess. Identity. Ownership. Blockchains. Bitcoin. Different.
Web4 appears to have been skipped, forever destined to wish it could have shown the world what it could have been. (It was probably crap.) As this iteration combines Web2 and Web3, simple math and common sense add up to 5. Or something.
Dorsey and his team have had this idea simmering for a while. Daniel Buchner, a member of Block's Decentralized Identity team, said, "We're finishing up Web5's technical components."
Web5 could be the project that decentralizes the internet. It must be useful to users and convince everyone to drop the countless Web3 projects, products, services, coins, blockchains, and websites being developed as I write this.
Web5 may be too late for Dorsey and the incoming flood of creators.
Web6 is planned!
The next months and years will be hectic and less stable than the transition from Web 1.0 to Web 2.0.
Web1 was around 1991-2004.
Web2 ran from 2004 to 2021. (though the Web3 term was first used in 2014, it only really gained traction years later.)
Web3 lasted a year.
Web4 is dead.
Silicon Valley billionaires are turning it into a startup-style race, each disrupting the next iteration until they crack it. Or destroy it completely.
Web5 won't last either.
You might also like

Bart Krawczyk
3 years ago
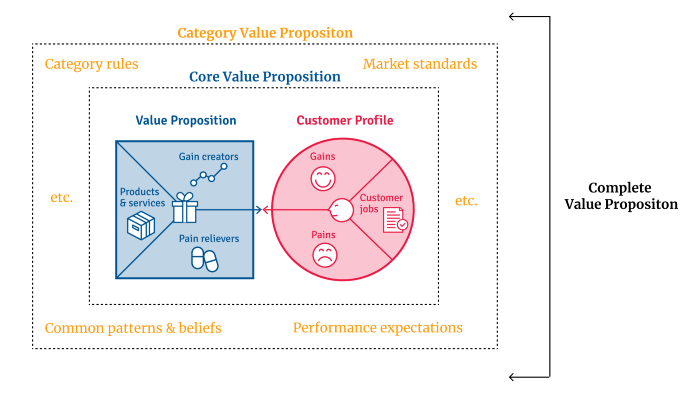
Understanding several Value Proposition kinds will help you create better goods.
Fixing problems isn't enough.
Numerous articles and how-to guides on value propositions focus on fixing consumer concerns.
Contrary to popular opinion, addressing customer pain rarely suffices. Win your market category too.
Core Value Statement
Value proposition usually means a product's main value.
Its how your product solves client problems. The product's core.
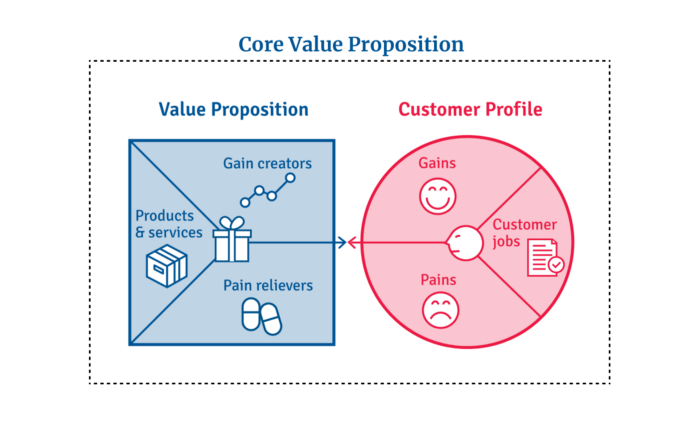
Answering these questions creates a relevant core value proposition:
What tasks is your customer trying to complete? (Jobs for clients)
How much discomfort do they feel while they perform this? (pains)
What would they like to see improved or changed? (gains)
After that, you create products and services that alleviate those pains and give value to clients.
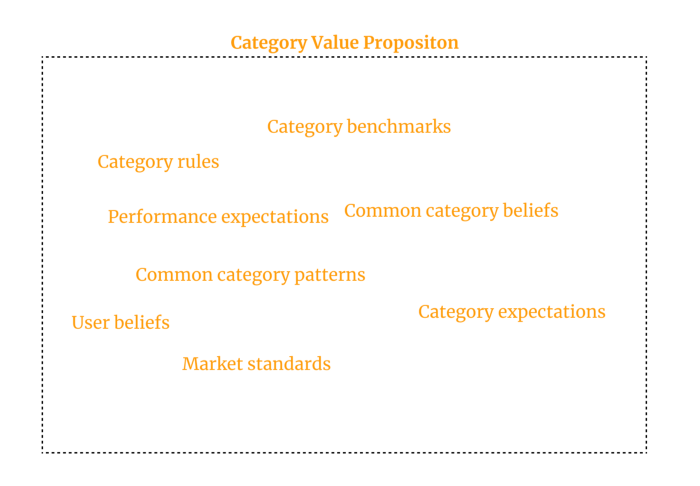
Value Proposition by Category
Your product belongs to a market category and must follow its regulations, regardless of its value proposition.
Creating a new market category is challenging. Fitting into customers' product perceptions is usually better than trying to change them.
New product users simplify market categories. Products are labeled.
Your product will likely be associated with a collection of products people already use.
Example: IT experts will use your communication and management app.
If your target clients think it's an advanced mail software, they'll compare it to others and expect things like:
comprehensive calendar
spam detectors
adequate storage space
list of contacts
etc.
If your target users view your product as a task management app, things change. You can survive without a contact list, but not status management.
Find out what your customers compare your product to and if it fits your value offer. If so, adapt your product plan to dominate this market. If not, try different value propositions and messaging to put the product in the right context.
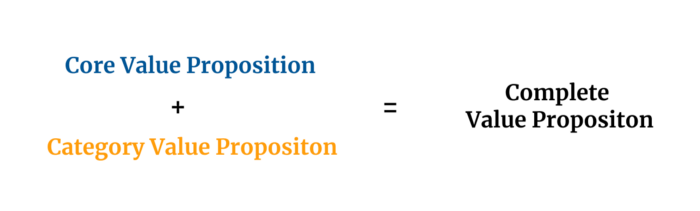
Finished Value Proposition
A comprehensive value proposition is when your solution addresses user problems and wins its market category.
Addressing simply the primary value proposition may produce a valuable and original product, but it may struggle to cross the chasm into the mainstream market. Meeting expectations is easier than changing views.
Without a unique value proposition, you will drown in the red sea of competition.
To conclude:
Find out who your target consumer is and what their demands and problems are.
To meet these needs, develop and test a primary value proposition.
Speak with your most devoted customers. Recognize the alternatives they use to compare you against and the market segment they place you in.
Recognize the requirements and expectations of the market category.
To meet or surpass category standards, modify your goods.
Great products solve client problems and win their category.

Will Lockett
3 years ago
The Unlocking Of The Ultimate Clean Energy
The company seeking 24/7 ultra-powerful solar electricity.
We're rushing to adopt low-carbon energy to prevent a self-made doomsday. We're using solar, wind, and wave energy. These low-carbon sources aren't perfect. They consume large areas of land, causing habitat loss. They don't produce power reliably, necessitating large grid-level batteries, an environmental nightmare. We can and must do better than fossil fuels. Longi, one of the world's top solar panel producers, is creating a low-carbon energy source. Solar-powered spacecraft. But how does it work? Why is it so environmentally harmonious? And how can Longi unlock it?
Space-based solar makes sense. Satellites above Medium Earth Orbit (MEO) enjoy 24/7 daylight. Outer space has no atmosphere or ozone layer to block the Sun's high-energy UV radiation. Solar panels can create more energy in space than on Earth due to these two factors. Solar panels in orbit can create 40 times more power than those on Earth, according to estimates.
How can we utilize this immense power? Launch a geostationary satellite with solar panels, then beam power to Earth. Such a technology could be our most eco-friendly energy source. (Better than fusion power!) How?
Solar panels create more energy in space, as I've said. Solar panel manufacture and grid batteries emit the most carbon. This indicates that a space-solar farm's carbon footprint (which doesn't need a battery because it's a constant power source) might be over 40 times smaller than a terrestrial one. Combine that with carbon-neutral launch vehicles like Starship, and you have a low-carbon power source. Solar power has one of the lowest emissions per kWh at 6g/kWh, so space-based solar could approach net-zero emissions.
Space solar is versatile because it doesn't require enormous infrastructure. A space-solar farm could power New York and Dallas with the same efficiency, without cables. The satellite will transmit power to a nearby terminal. This allows an energy system to evolve and adapt as the society it powers changes. Building and maintaining infrastructure can be carbon-intensive, thus less infrastructure means less emissions.
Space-based solar doesn't destroy habitats, either. Solar and wind power can be engineered to reduce habitat loss, but they still harm ecosystems, which must be restored. Space solar requires almost no land, therefore it's easier on Mother Nature.
Space solar power could be the ultimate energy source. So why haven’t we done it yet?
Well, for two reasons: the cost of launch and the efficiency of wireless energy transmission.
Advances in rocket construction and reusable rocket technology have lowered orbital launch costs. In the early 2000s, the Space Shuttle cost $60,000 per kg launched into LEO, but a SpaceX Falcon 9 costs only $3,205. 95% drop! Even at these low prices, launching a space-based solar farm is commercially questionable.
Energy transmission efficiency is half of its commercial viability. Space-based solar farms must be in geostationary orbit to get 24/7 daylight, 22,300 miles above Earth's surface. It's a long way to wirelessly transmit energy. Most laser and microwave systems are below 20% efficient.
Space-based solar power is uneconomical due to low efficiency and high deployment costs.
Longi wants to create this ultimate power. But how?
They'll send solar panels into space to develop space-based solar power that can be beamed to Earth. This mission will help them design solar panels tough enough for space while remaining efficient.
Longi is a Chinese company, and China's space program and universities are developing space-based solar power and seeking commercial partners. Xidian University has built a 98%-efficient microwave-based wireless energy transmission system for space-based solar power. The Long March 5B is China's super-cheap (but not carbon-offset) launch vehicle.
Longi fills the gap. They have the commercial know-how and ability to build solar satellites and terrestrial terminals at scale. Universities and the Chinese government have transmission technology and low-cost launch vehicles to launch this technology.
It may take a decade to develop and refine this energy solution. This could spark a clean energy revolution. Once operational, Longi and the Chinese government could offer the world a flexible, environmentally friendly, rapidly deployable energy source.
Should the world adopt this technology and let China control its energy? I'm not very political, so you decide. This seems to be the beginning of tapping into this planet-saving energy source. Forget fusion reactors. Carbon-neutral energy is coming soon.
Will Lockett
3 years ago
Thanks to a recent development, solar energy may prove to be the best energy source.
Perovskite solar cells will revolutionize everything.
Humanity is in a climatic Armageddon. Our widespread ecological crimes of the previous century are catching up with us, and planet-scale karma threatens everyone. We must adjust to new technologies and lifestyles to avoid this fate. Even solar power, a renewable energy source, has climate problems. A recent discovery could boost solar power's eco-friendliness and affordability. Perovskite solar cells are amazing.
Perovskite is a silicon-like semiconductor. Semiconductors are used to make computer chips, LEDs, camera sensors, and solar cells. Silicon makes sturdy and long-lasting solar cells, thus it's used in most modern solar panels.
Perovskite solar cells are far better. First, they're easy to make at room temperature, unlike silicon cells, which require long, intricate baking processes. This makes perovskite cells cheaper to make and reduces their carbon footprint. Perovskite cells are efficient. Most silicon panel solar farms are 18% efficient, meaning 18% of solar radiation energy is transformed into electricity. Perovskite cells are 25% efficient, making them 38% more efficient than silicon.
However, perovskite cells are nowhere near as durable. A normal silicon panel will lose efficiency after 20 years. The first perovskite cells were ineffective since they lasted barely minutes.
Recent research from Princeton shows that perovskite cells can endure 30 years. The cells kept their efficiency, therefore no sacrifices were made.
No electrical or chemical engineer here, thus I can't explain how they did it. But strangely, the team said longevity isn't the big deal. In the next years, perovskite panels will become longer-lasting. How do you test a panel if you only have a month or two? This breakthrough technique needs a uniform method to estimate perovskite life expectancy fast. The study's key milestone was establishing a standard procedure.
Lab-based advanced aging tests are their solution. Perovskite cells decay faster at higher temperatures, so scientists can extrapolate from that. The test heated the panel to 110 degrees and waited for its output to reduce by 20%. Their panel lasted 2,100 hours (87.5 days) before a 20% decline.
They did some math to extrapolate this data and figure out how long the panel would have lasted in different climates, and were shocked to find it would last 30 years in Princeton. This made perovskite panels as durable as silicon panels. This panel could theoretically be sold today.
This technology will soon allow these brilliant panels to be released into the wild. This technology could be commercially viable in ten, maybe five years.
Solar power will be the best once it does. Solar power is cheap and low-carbon. Perovskite is the cheapest renewable energy source if we switch to it. Solar panel manufacturing's carbon footprint will also drop.
Perovskites' impact goes beyond cost and carbon. Silicon panels require harmful mining and contain toxic elements (cadmium). Perovskite panels don't require intense mining or horrible materials, making their production and expiration more eco-friendly.
Solar power destroys habitat. Massive solar farms could reduce biodiversity and disrupt local ecology by destroying vital habitats. Perovskite cells are more efficient, so they can shrink a solar farm while maintaining energy output. This reduces land requirements, making perovskite solar power cheaper, and could reduce solar's environmental impact.
Perovskite solar power is scalable and environmentally friendly. Princeton scientists will speed up the development and rollout of this energy.
Why bother with fusion, fast reactors, SMRs, or traditional nuclear power? We're close to developing a nearly perfect environmentally friendly power source, and we have the tools and systems to do so quickly. It's also affordable, so we can adopt it quickly and let the developing world use it to grow. Even I struggle to justify spending billions on fusion when a great, cheap technology outperforms it. Perovskite's eco-credentials and cost advantages could save the world and power humanity's future.