


LCX is the latest CEX to have suffered a private key exploit.
The attack began around 10:30 PM +UTC on January 8th.
Peckshield spotted it first, then an official announcement came shortly after.
We’ve said it before; if established companies holding millions of dollars of users’ funds can’t manage their own hot wallet security, what purpose do they serve?
The Unique Selling Proposition (USP) of centralised finance grows smaller by the day.
The official incident report states that 7.94M USD were stolen in total, and that deposits and withdrawals to the platform have been paused.
LCX hot wallet: 0x4631018f63d5e31680fb53c11c9e1b11f1503e6f
Hacker’s wallet: 0x165402279f2c081c54b00f0e08812f3fd4560a05
Stolen funds:
- 162.68 ETH (502,671 USD)
- 3,437,783.23 USDC (3,437,783 USD)
- 761,236.94 EURe (864,840 USD)
- 101,249.71 SAND Token (485,995 USD)
- 1,847.65 LINK (48,557 USD)
- 17,251,192.30 LCX Token (2,466,558 USD)
- 669.00 QNT (115,609 USD)
- 4,819.74 ENJ (10,890 USD)
- 4.76 MKR (9,885 USD)
**~$1M worth of $LCX remains in the address, along with 611k EURe which has been frozen by Monerium.
The rest, a total of 1891 ETH (~$6M) was sent to Tornado Cash.**
Why can’t they keep private keys private?
Is it really that difficult for a traditional corporate structure to maintain good practice?
CeFi hacks leave us with little to say - we can only go on what the team chooses to tell us.
Next time, they can write this article themselves.
See below for a template.
More on Web3 & Crypto

forkast
3 years ago
Three Arrows Capital collapse sends crypto tremors
Three Arrows Capital's Google search volume rose over 5,000%.
Three Arrows Capital, a Singapore-based cryptocurrency hedge fund, filed for Chapter 15 bankruptcy last Friday to protect its U.S. assets from creditors.
Three Arrows filed for bankruptcy on July 1 in New York.
Three Arrows was ordered liquidated by a British Virgin Islands court last week after defaulting on a $670 million loan from Voyager Digital. Three days later, the Singaporean government reprimanded Three Arrows for spreading misleading information and exceeding asset limits.
Three Arrows' troubles began with Terra's collapse in May, after it bought US$200 million worth of Terra's LUNA tokens in February, co-founder Kyle Davies told the Wall Street Journal. Three Arrows has failed to meet multiple margin calls since then, including from BlockFi and Genesis.
Three Arrows Capital, founded by Kyle Davies and Su Zhu in 2012, manages $10 billion in crypto assets.
Bitcoin's price fell from US$20,600 to below US$19,200 after Three Arrows' bankruptcy petition. According to CoinMarketCap, BTC is now above US$20,000.
What does it mean?
Every action causes an equal and opposite reaction, per Newton's third law. Newtonian physics won't comfort Three Arrows investors, but future investors will thank them for their overconfidence.
Regulators are taking notice of crypto's meteoric rise and subsequent fall. Historically, authorities labeled the industry "high risk" to warn traditional investors against entering it. That attitude is changing. Regulators are moving quickly to regulate crypto to protect investors and prevent broader asset market busts.
The EU has reached a landmark deal that will regulate crypto asset sales and crypto markets across the 27-member bloc. The U.S. is close behind with a similar ruling, and smaller markets are also looking to improve safeguards.
For many, regulation is the only way to ensure the crypto industry survives the current winter.

ANDREW SINGER
4 years ago
Crypto seen as the ‘future of money’ in inflation-mired countries
Crypto as the ‘future of money' in inflation-stricken nations
Citizens of devalued currencies “need” crypto. “Nice to have” in the developed world.
According to Gemini's 2022 Global State of Crypto report, cryptocurrencies “evolved from what many considered a niche investment into an established asset class” last year.
More than half of crypto owners in Brazil (51%), Hong Kong (51%), and India (54%), according to the report, bought cryptocurrency for the first time in 2021.
The study found that inflation and currency devaluation are powerful drivers of crypto adoption, especially in emerging market (EM) countries:
“Respondents in countries that have seen a 50% or greater devaluation of their currency against the USD over the last decade were more than 5 times as likely to plan to purchase crypto in the coming year.”
Between 2011 and 2021, the real lost 218 percent of its value against the dollar, and 45 percent of Brazilians surveyed by Gemini said they planned to buy crypto in 2019.
The rand (South Africa's currency) has fallen 103 percent in value over the last decade, second only to the Brazilian real, and 32 percent of South Africans expect to own crypto in the coming year. Mexico and India, the third and fourth highest devaluation countries, followed suit.
Compared to the US dollar, Hong Kong and the UK currencies have not devalued in the last decade. Meanwhile, only 5% and 8% of those surveyed in those countries expressed interest in buying crypto.
What can be concluded? Noah Perlman, COO of Gemini, sees various crypto use cases depending on one's location.
‘Need to have' investment in countries where the local currency has devalued against the dollar, whereas in the developed world it is still seen as a ‘nice to have'.
Crypto as money substitute
As an adjunct professor at New York University School of Law, Winston Ma distinguishes between an asset used as an inflation hedge and one used as a currency replacement.
Unlike gold, he believes Bitcoin (BTC) is not a “inflation hedge”. They acted more like growth stocks in 2022. “Bitcoin correlated more closely with the S&P 500 index — and Ether with the NASDAQ — than gold,” he told Cointelegraph. But in the developing world, things are different:
“Inflation may be a primary driver of cryptocurrency adoption in emerging markets like Brazil, India, and Mexico.”
According to Justin d'Anethan, institutional sales director at the Amber Group, a Singapore-based digital asset firm, early adoption was driven by countries where currency stability and/or access to proper banking services were issues. Simply put, he said, developing countries want alternatives to easily debased fiat currencies.
“The larger flows may still come from institutions and developed countries, but the actual users may come from places like Lebanon, Turkey, Venezuela, and Indonesia.”
“Inflation is one of the factors that has and continues to drive adoption of Bitcoin and other crypto assets globally,” said Sean Stein Smith, assistant professor of economics and business at Lehman College.
But it's only one factor, and different regions have different factors, says Stein Smith. As a “instantaneously accessible, traceable, and cost-effective transaction option,” investors and entrepreneurs increasingly recognize the benefits of crypto assets. Other places promote crypto adoption due to “potential capital gains and returns”.
According to the report, “legal uncertainty around cryptocurrency,” tax questions, and a general education deficit could hinder adoption in Asia Pacific and Latin America. In Africa, 56% of respondents said more educational resources were needed to explain cryptocurrencies.
Not only inflation, but empowering our youth to live better than their parents without fear of failure or allegiance to legacy financial markets or products, said Monica Singer, ConsenSys South Africa lead. Also, “the issue of cash and remittances is huge in Africa, as is the issue of social grants.”
Money's future?
The survey found that Brazil and Indonesia had the most cryptocurrency ownership. In each country, 41% of those polled said they owned crypto. Only 20% of Americans surveyed said they owned cryptocurrency.
These markets are more likely to see cryptocurrencies as the future of money. The survey found:
“The majority of respondents in Latin America (59%) and Africa (58%) say crypto is the future of money.”
Brazil (66%), Nigeria (63%), Indonesia (61%), and South Africa (57%). Europe and Australia had the fewest believers, with Denmark at 12%, Norway at 15%, and Australia at 17%.
Will the Ukraine conflict impact adoption?
The poll was taken before the war. Will the devastating conflict slow global crypto adoption growth?
With over $100 million in crypto donations directly requested by the Ukrainian government since the war began, Stein Smith says the war has certainly brought crypto into the mainstream conversation.
“This real-world demonstration of decentralized money's power could spur wider adoption, policy debate, and increased use of crypto as a medium of exchange.”
But the war may not affect all developing nations. “The Ukraine war has no impact on African demand for crypto,” Others loom larger. “Yes, inflation, but also a lack of trust in government in many African countries, and a young demographic very familiar with mobile phones and the internet.”
A major success story like Mpesa in Kenya has influenced the continent and may help accelerate crypto adoption. Creating a plan when everyone you trust fails you is directly related to the African spirit, she said.
On the other hand, Ma views the Ukraine conflict as a sort of crisis check for cryptocurrencies. For those in emerging markets, the Ukraine-Russia war has served as a “stress test” for the cryptocurrency payment rail, he told Cointelegraph.
“These emerging markets may see the greatest future gains in crypto adoption.”
Inflation and currency devaluation are persistent global concerns. In such places, Bitcoin and other cryptocurrencies are now seen as the “future of money.” Not in the developed world, but that could change with better regulation and education. Inflation and its impact on cash holdings are waking up even Western nations.
Read original post here.

The Verge
4 years ago
Bored Ape Yacht Club creator raises $450 million at a $4 billion valuation.
Yuga Labs, owner of three of the biggest NFT brands on the market, announced today a $450 million funding round. The money will be used to create a media empire based on NFTs, starting with games and a metaverse project.
The team's Otherside metaverse project is an MMORPG meant to connect the larger NFT universe. They want to create “an interoperable world” that is “gamified” and “completely decentralized,” says Wylie Aronow, aka Gordon Goner, co-founder of Bored Ape Yacht Club. “We think the real Ready Player One experience will be player run.”
Just a few weeks ago, Yuga Labs announced the acquisition of CryptoPunks and Meebits from Larva Labs. The deal brought together three of the most valuable NFT collections, giving Yuga Labs more IP to work with when developing games and metaverses. Last week, ApeCoin was launched as a cryptocurrency that will be governed independently and used in Yuga Labs properties.
Otherside will be developed by “a few different game studios,” says Yuga Labs CEO Nicole Muniz. The company plans to create development tools that allow NFTs from other projects to work inside their world. “We're welcoming everyone into a walled garden.”
However, Yuga Labs believes that other companies are approaching metaverse projects incorrectly, allowing the startup to stand out. People won't bond spending time in a virtual space with nothing going on, says Yuga Labs co-founder Greg Solano, aka Gargamel. Instead, he says, people bond when forced to work together.
In order to avoid getting smacked, Solano advises making friends. “We don't think a Zoom chat and walking around saying ‘hi' creates a deep social experience.” Yuga Labs refused to provide a release date for Otherside. Later this year, a play-to-win game is planned.
The funding round was led by Andreessen Horowitz, a major investor in the Web3 space. It previously backed OpenSea and Coinbase. Animoca Brands, Coinbase, and MoonPay are among those who have invested. Andreessen Horowitz general partner Chris Lyons will join Yuga Labs' board. The Financial Times broke the story last month.
"META IS A DOMINANT DIGITAL EXPERIENCE PROVIDER IN A DYSTOPIAN FUTURE."
This emerging [Web3] ecosystem is important to me, as it is to companies like Meta,” Chris Dixon, head of Andreessen Horowitz's crypto arm, tells The Verge. “In a dystopian future, Meta is the dominant digital experience provider, and it controls all the money and power.” (Andreessen Horowitz co-founder Marc Andreessen sits on Meta's board and invested early in Facebook.)
Yuga Labs has been profitable so far. According to a leaked pitch deck, the company made $137 million last year, primarily from its NFT brands, with a 95% profit margin. (Yuga Labs declined to comment on deck figures.)
But the company has built little so far. According to OpenSea data, it has only released one game for a limited time. That means Yuga Labs gets hundreds of millions of dollars to build a gaming company from scratch, based on a hugely lucrative art project.
Investors fund Yuga Labs based on its success. That's what they did, says Dixon, “they created a culture phenomenon”. But ultimately, the company is betting on the same thing that so many others are: that a metaverse project will be the next big thing. Now they must construct it.
You might also like

Jack Burns
3 years ago
Here's what to expect from NASA Artemis 1 and why it's significant.
NASA's Artemis 1 mission will help return people to the Moon after a half-century break. The mission is a shakedown cruise for NASA's Space Launch System and Orion Crew Capsule.
The spaceship will visit the Moon, deploy satellites, and enter orbit. NASA wants to practice operating the spacecraft, test the conditions people will face on the Moon, and ensure a safe return to Earth.
We asked Jack Burns, a space scientist at the University of Colorado Boulder and former member of NASA's Presidential Transition Team, to describe the mission, explain what the Artemis program promises for space exploration, and reflect on how the space program has changed in the half-century since humans last set foot on the moon.
What distinguishes Artemis 1 from other rockets?
Artemis 1 is the Space Launch System's first launch. NASA calls this a "heavy-lift" vehicle. It will be more powerful than Apollo's Saturn V, which transported people to the Moon in the 1960s and 1970s.
It's a new sort of rocket system with two strap-on solid rocket boosters from the space shuttle. It's a mix of the shuttle and Saturn V.
The Orion Crew Capsule will be tested extensively. It'll spend a month in the high-radiation Moon environment. It will also test the heat shield, which protects the capsule and its occupants at 25,000 mph. The heat shield must work well because this is the fastest capsule descent since Apollo.
This mission will also carry miniature Moon-orbiting satellites. These will undertake vital precursor science, including as examining further into permanently shadowed craters where scientists suspect there is water and measuring the radiation environment to see long-term human consequences.
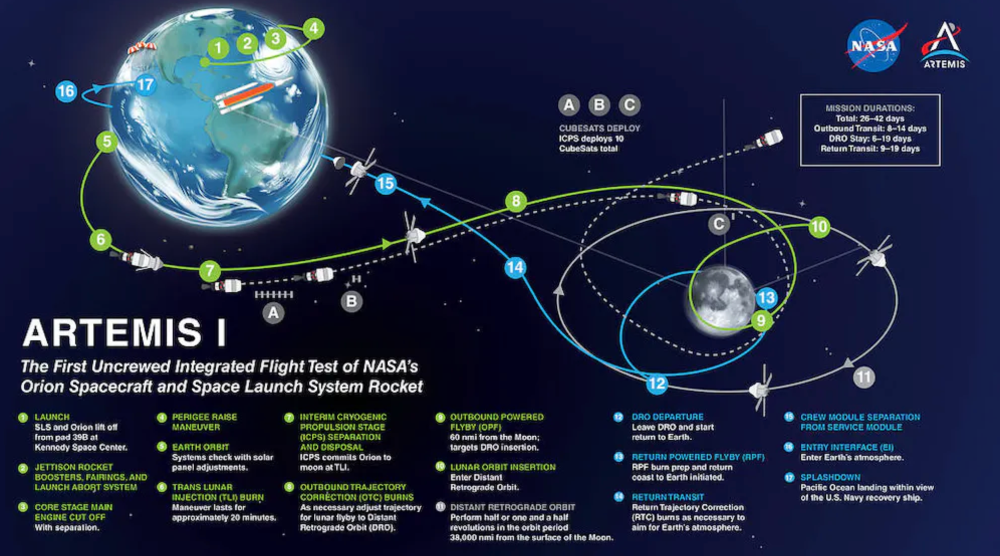
Artemis 1 will launch, fly to the Moon, place satellites, orbit it, return to Earth, and splash down in the ocean. NASA.
What's Artemis's goal? What launches are next?
The mission is a first step toward Artemis 3, which will lead to the first human Moon missions since 1972. Artemis 1 is unmanned.
Artemis 2 will have astronauts a few years later. Like Apollo 8, it will be an orbital mission that circles the Moon and returns. The astronauts will orbit the Moon longer and test everything with a crew.
Eventually, Artemis 3 will meet with the SpaceX Starship on the Moon's surface and transfer people. Orion will stay in orbit while the lunar Starship lands astronauts. They'll go to the Moon's south pole to investigate the water ice there.
Artemis is reminiscent of Apollo. What's changed in 50 years?
Kennedy wanted to beat the Soviets to the Moon with Apollo. The administration didn't care much about space flight or the Moon, but the goal would place America first in space and technology.
You live and die by the sword if you do that. When the U.S. reached the Moon, it was over. Russia lost. We planted flags and did science experiments. Richard Nixon canceled the program after Apollo 11 because the political goals were attained.
Large rocket with two boosters between two gates
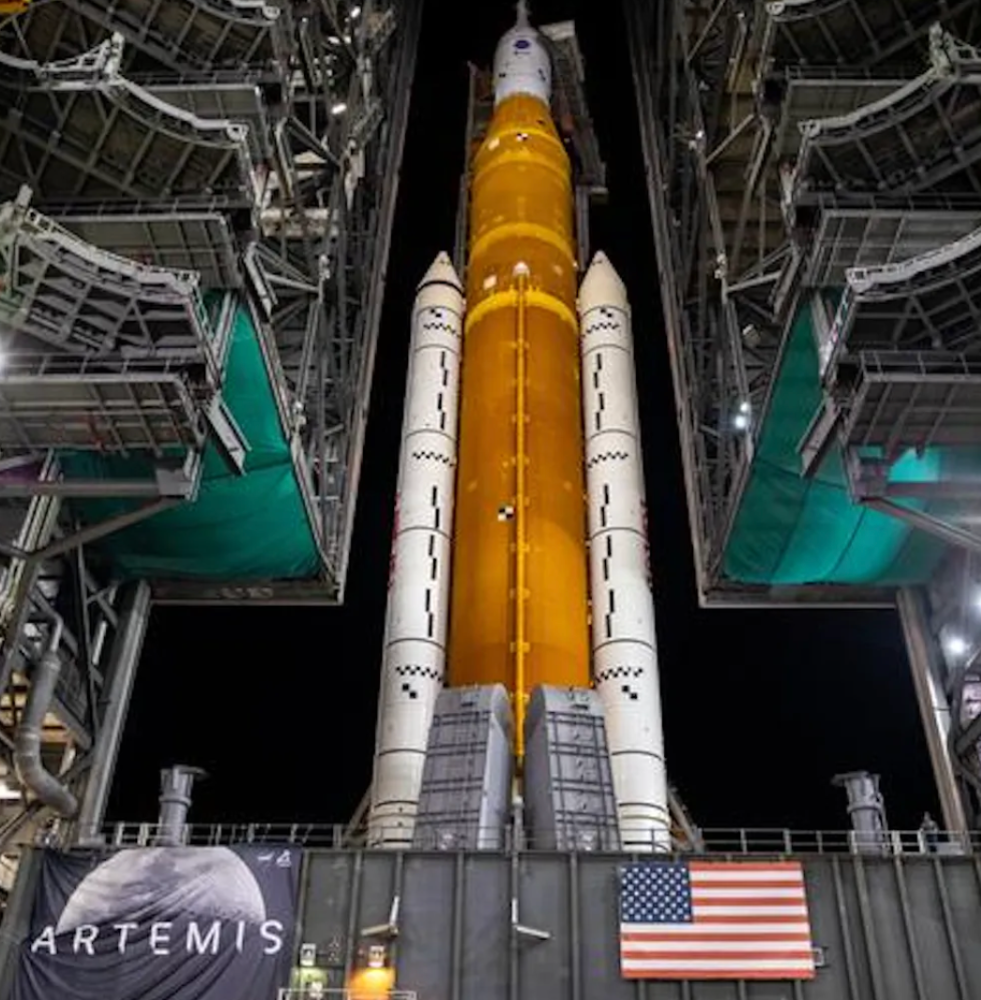
NASA's new Space Launch System is brought to a launchpad. NASA
50 years later... It's quite different. We're not trying to beat the Russians, Chinese, or anyone else, but to begin sustainable space exploration.
Artemis has many goals. It includes harnessing in-situ resources like water ice and lunar soil to make food, fuel, and building materials.
SpaceX is part of this first journey to the Moon's surface, therefore the initiative is also helping to develop a lunar and space economy. NASA doesn't own the Starship but is buying seats for astronauts. SpaceX will employ Starship to transport cargo, private astronauts, and foreign astronauts.
Fifty years of technology advancement has made getting to the Moon cheaper and more practical, and computer technology allows for more advanced tests. 50 years of technological progress have changed everything. Anyone with enough money can send a spacecraft to the Moon, but not humans.
Commercial Lunar Payload Services engages commercial companies to develop uncrewed Moon landers. We're sending a radio telescope to the Moon in January. Even 10 years ago, that was impossible.
Since humans last visited the Moon 50 years ago, technology has improved greatly.
What other changes does Artemis have in store?
The government says Artemis 3 will have at least one woman and likely a person of color.
I'm looking forward to seeing more diversity so young kids can say, "Hey, there's an astronaut that looks like me. I can do this. I can be part of the space program.”

Ethan Siegel
3 years ago
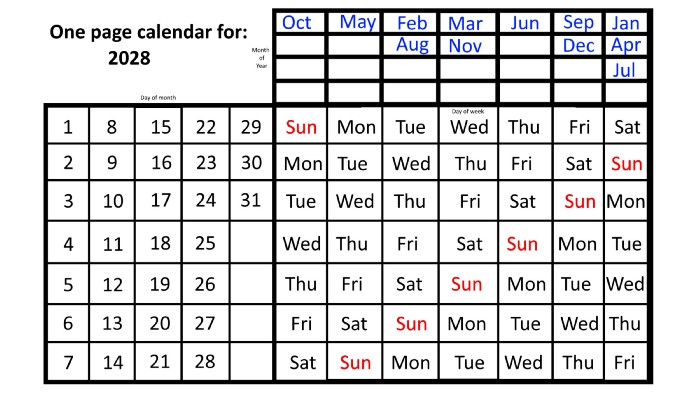
How you view the year will change after using this one-page calendar.
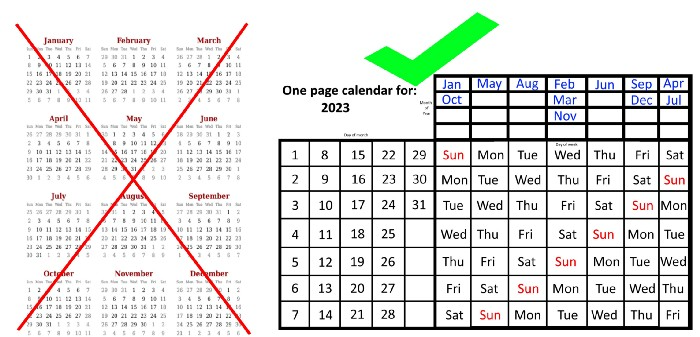
No other calendar is simpler, smaller, and reusable year after year. It works and is used here.
Most of us discard and replace our calendars annually. Each month, we move our calendar ahead another page, thus if we need to know which day of the week corresponds to a given day/month combination, we have to calculate it or flip forward/backward to the corresponding month. Questions like:
What day does this year's American Thanksgiving fall on?
Which months contain a Friday the thirteenth?
When is July 4th? What day of the week?
Alternatively, what day of the week is Christmas?
They're hard to figure out until you switch to the right month or look up all the months.
However, mathematically, the answers to these questions or any question that requires matching the day of the week with the day/month combination in a year are predictable, basic, and easy to work out. If you use this one-page calendar instead of a 12-month calendar, it lasts the whole year and is easy to alter for future years. Let me explain.
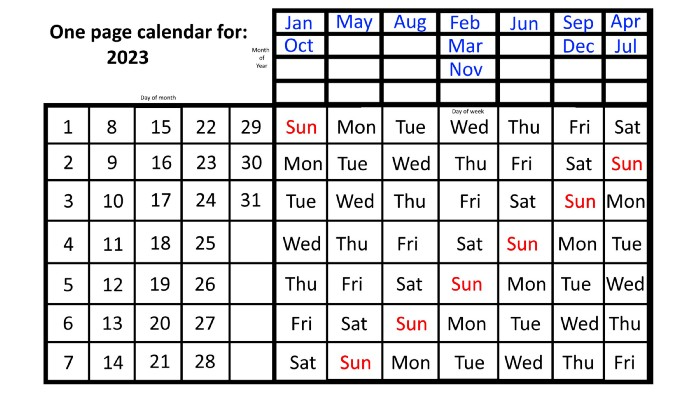
The 2023 one-page calendar is above. The days of the month are on the lower left, which works for all months if you know that:
There are 31 days in January, March, May, July, August, October, and December.
All of the months of April, June, September, and November have 30 days.
And depending on the year, February has either 28 days (in non-leap years) or 29 days (in leap years).
If you know this, this calendar makes it easy to match the day/month of the year to the weekday.
Here are some instances. American Thanksgiving is always on the fourth Thursday of November. You'll always know the month and day of the week, but the date—the day in November—changes each year.
On any other calendar, you'd have to flip to November to see when the fourth Thursday is. This one-page calendar only requires:
pick the month of November in the top-right corner to begin.
drag your finger down until Thursday appears,
then turn left and follow the monthly calendar until you reach the fourth Thursday.
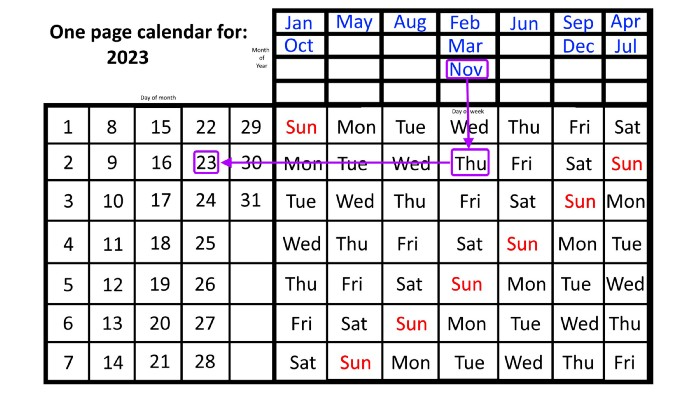
It's obvious: 2023 is the 23rd American Thanksgiving. For every month and day-of-the-week combination, start at the month, drag your finger down to the desired day, and then move to the left to see which dates match.
What if you knew the day of the week and the date of the month, but not the month(s)?
A different method using the same one-page calendar gives the answer. Which months have Friday the 13th this year? Just:
begin on the 13th of the month, the day you know you desire,
then swipe right with your finger till Friday appears.
and then work your way up until you can determine which months the specific Friday the 13th falls under.
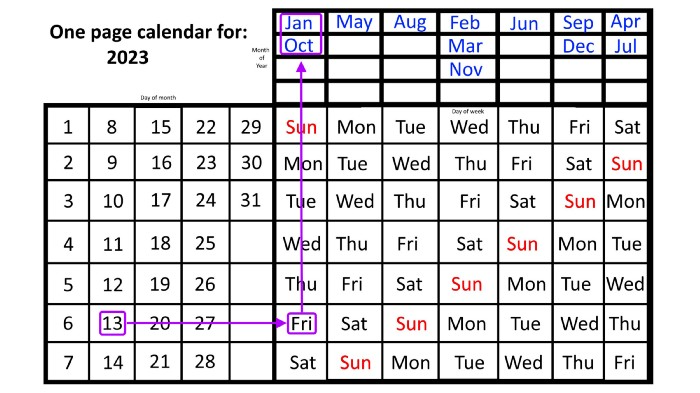
One Friday the 13th occurred in January 2023, and another will occur in October.
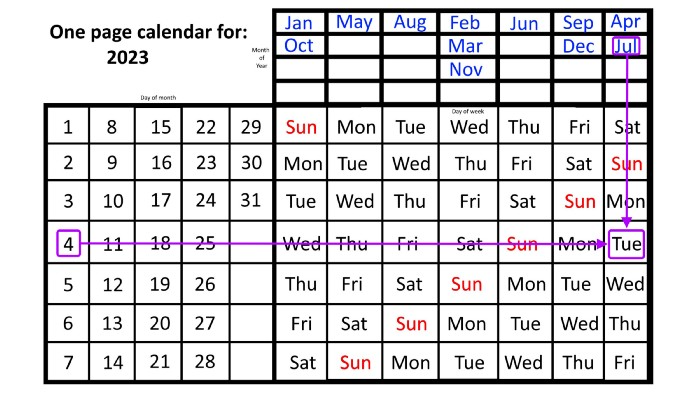
The most typical reason to consult a calendar is when you know the month/day combination but not the day of the week.
Compared to single-month calendars, the one-page calendar excels here. Take July 4th, for instance. Find the weekday here:
beginning on the left on the fourth of the month, as you are aware,
also begin with July, the month of the year you are most familiar with, at the upper right,
you should move your two fingers in the opposite directions till they meet: on a Tuesday in 2023.
That's how you find your selected day/month combination's weekday.
Another example: Christmas. Christmas Day is always December 25th, however unless your conventional calendar is open to December of your particular year, a question like "what day of the week is Christmas?" difficult to answer.
Unlike the one-page calendar!
Remember the left-hand day of the month. Top-right, you see the month. Put two fingers, one from each hand, on the date (25th) and the month (December). Slide the day hand to the right and the month hand downwards until they touch.
They meet on Monday—December 25, 2023.
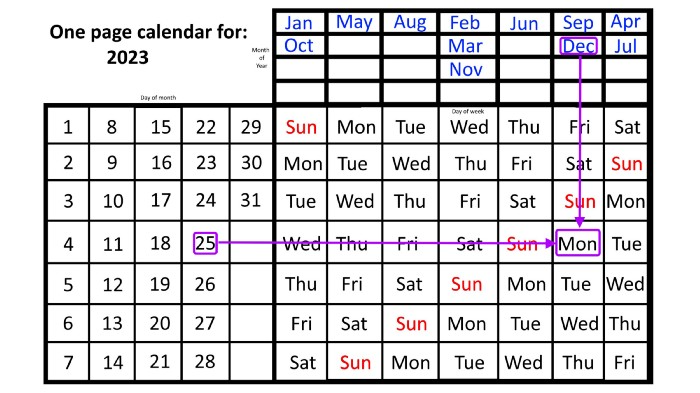
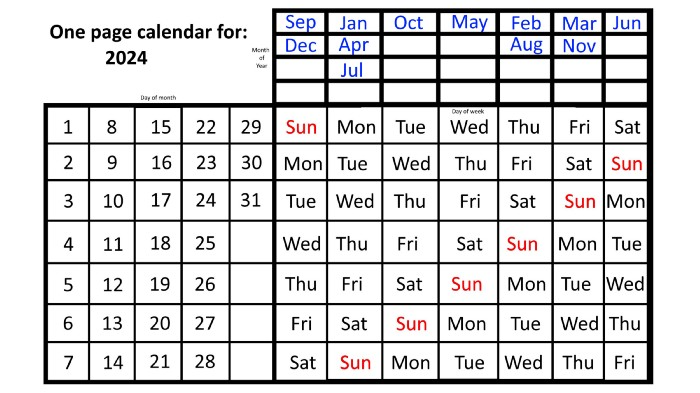
For 2023, that's fine, but what happens in 2024? Even worse, what if we want to know the day-of-the-week/day/month combo many years from now?
I think the one-page calendar shines here.
Except for the blue months in the upper-right corner of the one-page calendar, everything is the same year after year. The months also change in a consistent fashion.
Each non-leap year has 365 days—one more than a full 52 weeks (which is 364). Since January 1, 2023 began on a Sunday and 2023 has 365 days, we immediately know that December 31, 2023 will conclude on a Sunday (which you can confirm using the one-page calendar) and that January 1, 2024 will begin on a Monday. Then, reorder the months for 2024, taking in mind that February will have 29 days in a leap year.
Please note the differences between 2023 and 2024 month placement. In 2023:
October and January began on the same day of the week.
On the following Monday of the week, May began.
August started on the next day,
then the next weekday marked the start of February, March, and November, respectively.
Unlike June, which starts the following weekday,
While September and December start on the following day of the week,
Lastly, April and July start one extra day later.
Since 2024 is a leap year, February has 29 days, disrupting the rhythm. Month placements change to:
The first day of the week in January, April, and July is the same.
October will begin the following day.
Possibly starting the next weekday,
February and August start on the next weekday,
beginning on the following day of the week between March and November,
beginning the following weekday in June,
and commencing one more day of the week after that, September and December.
Due to the 366-day leap year, 2025 will start two days later than 2024 on January 1st.
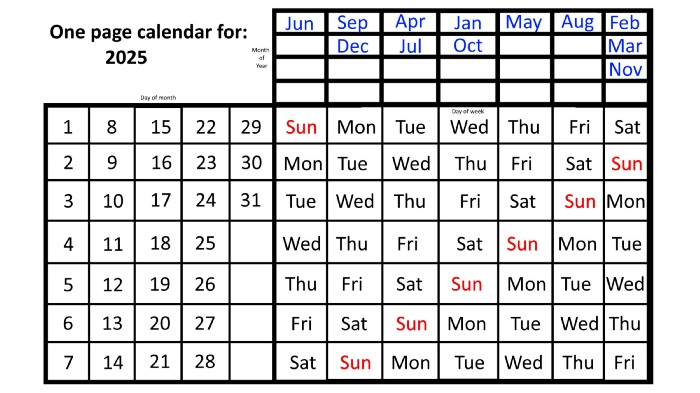
Now, looking at the 2025 calendar, you can see that the 2023 pattern of which months start on which days is repeated! The sole variation is a shift of three days-of-the-week ahead because 2023 had one more day (365) than 52 full weeks (364), and 2024 had two more days (366). Again,
On Wednesday this time, January and October begin on the same day of the week.
Although May begins on Thursday,
August begins this Friday.
March, November, and February all begin on a Saturday.
Beginning on a Sunday in June
Beginning on Monday are September and December,
and on Tuesday, April and July begin.
In 2026 and 2027, the year will commence on a Thursday and a Friday, respectively.
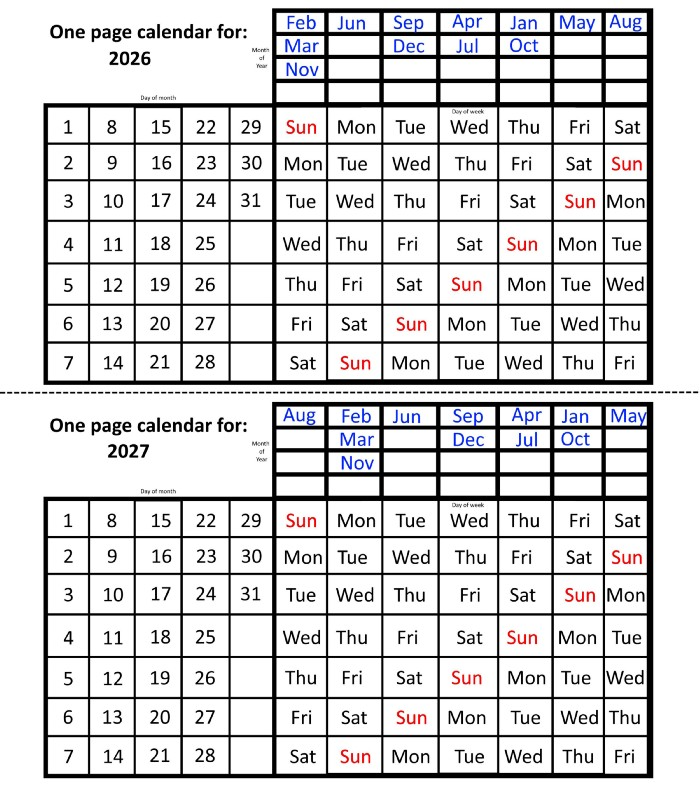
We must return to our leap year monthly arrangement in 2028. Yes, January 1, 2028 begins on a Saturday, but February, which begins on a Tuesday three days before January, will have 29 days. Thus:
Start dates for January, April, and July are all Saturdays.
Given that October began on Sunday,
Although May starts on a Monday,
beginning on a Tuesday in February and August,
Beginning on a Wednesday in March and November,
Beginning on Thursday, June
and Friday marks the start of September and December.
This is great because there are only 14 calendar configurations: one for each of the seven non-leap years where January 1st begins on each of the seven days of the week, and one for each of the seven leap years where it begins on each day of the week.
The 2023 calendar will function in 2034, 2045, 2051, 2062, 2073, 2079, 2090, 2102, 2113, and 2119. Except when passing over a non-leap year that ends in 00, like 2100, the repeat time always extends to 12 years or shortens to an extra 6 years.
The pattern is repeated in 2025's calendar in 2031, 2042, 2053, 2059, 2070, 2081, 2087, 2098, 2110, and 2121.
The extra 6-year repeat at the end of the century on the calendar for 2026 will occur in the years 2037, 2043, 2054, 2065, 2071, 2082, 2093, 2099, 2105, and 2122.
The 2027s calendar repeats in 2038, 2049, 2055, 2066, 2077, 2083, 2094, 2100, 2106, and 2117, almost exactly matching the 2026s pattern.
For leap years, the recurrence pattern is every 28 years when not passing a non-leap year ending in 00, or 12 or 40 years when we do. 2024's calendar repeats in 2052, 2080, 2120, 2148, 2176, and 2216; 2028's in 2056, 2084, 2124, 2152, 2180, and 2220.
Knowing January 1st and whether it's a leap year lets you construct a one-page calendar for any year. Try it—you might find it easier than any other alternative!

Kaitlin Fritz
3 years ago
The Entrepreneurial Chicken and Egg
University entrepreneurship is like a Willy Wonka Factory of ideas. Classes, roommates, discussions, and the cafeteria all inspire new ideas. I've seen people establish a business without knowing its roots.
Chicken or egg? On my mind: I've asked university founders around the world whether the problem or solution came first.
The Problem
One African team I met started with the “instant noodles” problem in their academic ecosystem. Many of us have had money issues in college, which may have led to poor nutritional choices.
Many university students in a war-torn country ate quick noodles or pasta for dinner.

Noodles required heat, water, and preparation in the boarding house. Unreliable power from one hot plate per blue moon. What's healthier, easier, and tastier than sodium-filled instant pots?
BOOM. They were fixing that. East African kids need affordable, nutritious food.
This is a real difficulty the founders faced every day with hundreds of comrades.
This sparked their serendipitous entrepreneurial journey and became their business's cornerstone.
The Solution
I asked a UK team about their company idea. They said the solution fascinated them.
The crew was fiddling with social media algorithms. Why are some people more popular? They were studying platforms and social networks, which offered a way for them.

Solving a problem? Yes. Long nights of university research lead them to it. Is this like world hunger? Social media influencers confront this difficulty regularly.
It made me ponder something. Is there a correct response?
In my heart, yes, but in my head…maybe?
I believe you should lead with empathy and embrace the problem, not the solution. Big or small, businesses should solve problems. This should be your focus. This is especially true when building a social company with an audience in mind.
Philosophically, invention and innovation are occasionally accidental. Also not penalized. Think about bugs and the creation of Velcro, or the inception of Teflon. They tackle difficulties we overlook. The route to the problem may look different, but there is a path there.
There's no golden ticket to the Chicken-Egg debate, but I'll keep looking this summer.