


More on Technology

Gajus Kuizinas
3 years ago
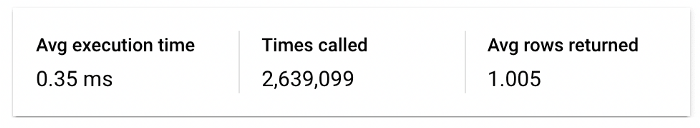
How a few lines of code were able to eliminate a few million queries from the database
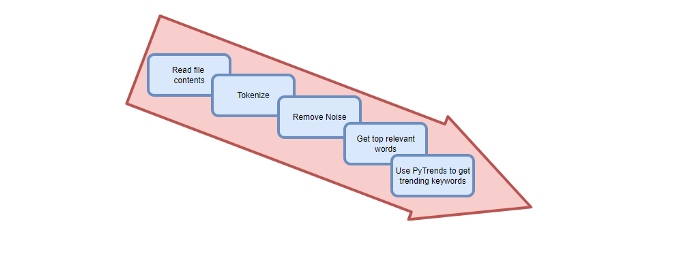
I was entering tens of millions of records per hour when I first published Slonik PostgreSQL client for Node.js. The data being entered was usually flat, making it straightforward to use INSERT INTO ... SELECT * FROM unnset() pattern. I advocated the unnest approach for inserting rows in groups (that was part I).

However, today I’ve found a better way: jsonb_to_recordset.
jsonb_to_recordsetexpands the top-level JSON array of objects to a set of rows having the composite type defined by an AS clause.
jsonb_to_recordset allows us to query and insert records from arbitrary JSON, like unnest. Since we're giving JSON to PostgreSQL instead of unnest, the final format is more expressive and powerful.
SELECT *
FROM json_to_recordset('[{"name":"John","tags":["foo","bar"]},{"name":"Jane","tags":["baz"]}]')
AS t1(name text, tags text[]);
 name |   tags
------+-----------
 John | {foo,bar}
 Jane | {baz}
(2 rows)
Let’s demonstrate how you would use it to insert data.
Inserting data using json_to_recordset
Say you need to insert a list of people with attributes into the database.
const persons = [
  {
    name: 'John',
    tags: ['foo', 'bar']
  },
  {
    name: 'Jane',
    tags: ['baz']
  }
];
You may be tempted to traverse through the array and insert each record separately, e.g.
for (const person of persons) {
  await pool.query(sql`
    INSERT INTO person (name, tags)
    VALUES (
      ${person.name},
      ${sql.array(person.tags, 'text[]')}
    )
  `);
}
It's easier to read and grasp when working with a few records. If you're like me and troubleshoot a 2M+ insert query per day, batching inserts may be beneficial.
What prompted the search for better alternatives.
Inserting using unnest pattern might look like this:
await pool.query(sql`
  INSERT INTO public.person (name, tags)
  SELECT t1.name, t1.tags::text[]
  FROM unnest(
    ${sql.array(['John', 'Jane'], 'text')},
    ${sql.array(['{foo,bar}', '{baz}'], 'text')}
  ) AS t1.(name, tags);
`);
You must convert arrays into PostgreSQL array strings and provide them as text arguments, which is unsightly. Iterating the array to create slices for each column is likewise unattractive.
However, with jsonb_to_recordset, we can:
await pool.query(sql`
  INSERT INTO person (name, tags)
  SELECT *
  FROM jsonb_to_recordset(${sql.jsonb(persons)}) AS t(name text, tags text[])
`);
In contrast to the unnest approach, using jsonb_to_recordset we can easily insert complex nested data structures, and we can pass the original JSON document to the query without needing to manipulate it.
In terms of performance they are also exactly the same. As such, my current recommendation is to prefer jsonb_to_recordset whenever inserting lots of rows or nested data structures.

Sukhad Anand
3 years ago
How Do Discord's Trillions Of Messages Get Indexed?
They depend heavily on open source..
Discord users send billions of messages daily. Users wish to search these messages. How do we index these to search by message keywords?
Let’s find out.
Discord utilizes Elasticsearch. Elasticsearch is a free, open search engine for textual, numerical, geographical, structured, and unstructured data. Apache Lucene powers Elasticsearch.
How does elastic search store data? It stores it as numerous key-value pairs in JSON documents.
How does elastic search index? Elastic search's index is inverted. An inverted index lists every unique word in every page and where it appears.
4. Elasticsearch indexes documents and generates an inverted index to make data searchable in near real-time. The index API adds or updates JSON documents in a given index.
Let's examine how discord uses Elastic Search. Elasticsearch prefers bulk indexing. Discord couldn't index real-time messages. You can't search posted messages. You want outdated messages.
6. Let's check what bulk indexing requires.
1. A temporary queue for incoming communications.
2. Indexer workers that index messages into elastic search.
Discord's queue is Celery. The queue is open-source. Elastic search won't run on a single server. It's clustered. Where should a message go? Where?
8. A shard allocator decides where to put the message. Nevertheless. Shattered? A shard combines elastic search and index on. So, these two form a shard which is used as a unit by discord. The elastic search itself has some shards. But this is different, so don’t get confused.
Now, the final part is service discovery — to discover the elastic search clusters and the hosts within that cluster. This, they do with the help of etcd another open source tool.
A great thing to notice here is that discord relies heavily on open source systems and their base implementations which is very different from a lot of other products.

Duane Michael
3 years ago
Don't Fall Behind: 7 Subjects You Must Understand to Keep Up with Technology
As technology develops, you should stay up to date

You don't want to fall behind, do you? This post covers 7 tech-related things you should know.
You'll learn how to operate your computer (and other electronic devices) like an expert and how to leverage the Internet and social media to create your brand and business. Read on to stay relevant in today's tech-driven environment.
You must learn how to code.
Future-language is coding. It's how we and computers talk. Learn coding to keep ahead.
Try Codecademy or Code School. There are also numerous free courses like Coursera or Udacity, but they take a long time and aren't necessarily self-paced, so it can be challenging to find the time.
Artificial intelligence (AI) will transform all jobs.
Our skillsets must adapt with technology. AI is a must-know topic. AI will revolutionize every employment due to advances in machine learning.
Here are seven AI subjects you must know.
What is artificial intelligence?
How does artificial intelligence work?
What are some examples of AI applications?
How can I use artificial intelligence in my day-to-day life?
What jobs have a high chance of being replaced by artificial intelligence and how can I prepare for this?
Can machines replace humans? What would happen if they did?
How can we manage the social impact of artificial intelligence and automation on human society and individual people?
Blockchain Is Changing the Future
Few of us know how Bitcoin and blockchain technology function or what impact they will have on our lives. Blockchain offers safe, transparent, tamper-proof transactions.
It may alter everything from business to voting. Seven must-know blockchain topics:
Describe blockchain.
How does the blockchain function?
What advantages does blockchain offer?
What possible uses for blockchain are there?
What are the dangers of blockchain technology?
What are my options for using blockchain technology?
What does blockchain technology's future hold?
Cryptocurrencies are here to stay
Cryptocurrencies employ cryptography to safeguard transactions and manage unit creation. Decentralized cryptocurrencies aren't controlled by governments or financial institutions.

Bitcoin, the first cryptocurrency, was launched in 2009. Cryptocurrencies can be bought and sold on decentralized exchanges.
Bitcoin is here to stay.
Bitcoin isn't a fad, despite what some say. Since 2009, Bitcoin's popularity has grown. Bitcoin is worth learning about now. Since 2009, Bitcoin has developed steadily.
With other cryptocurrencies emerging, many people are wondering if Bitcoin still has a bright future. Curiosity is natural. Millions of individuals hope their Bitcoin investments will pay off since they're popular now.
Thankfully, they will. Bitcoin is still running strong a decade after its birth. Here's why.
The Internet of Things (IoT) is no longer just a trendy term.
IoT consists of internet-connected physical items. These items can share data. IoT is young but developing fast.
20 billion IoT-connected devices are expected by 2023. So much data! All IT teams must keep up with quickly expanding technologies. Four must-know IoT topics:
Recognize the fundamentals: Priorities first! Before diving into more technical lingo, you should have a fundamental understanding of what an IoT system is. Before exploring how something works, it's crucial to understand what you're working with.
Recognize Security: Security does not stand still, even as technology advances at a dizzying pace. As IT professionals, it is our duty to be aware of the ways in which our systems are susceptible to intrusion and to ensure that the necessary precautions are taken to protect them.
Be able to discuss cloud computing: The cloud has seen various modifications over the past several years once again. The use of cloud computing is also continually changing. Knowing what kind of cloud computing your firm or clients utilize will enable you to make the appropriate recommendations.
Bring Your Own Device (BYOD)/Mobile Device Management (MDM) is a topic worth discussing (MDM). The ability of BYOD and MDM rules to lower expenses while boosting productivity among employees who use these services responsibly is a major factor in their continued growth in popularity.
IoT Security is key
As more gadgets connect, they must be secure. IoT security includes securing devices and encrypting data. Seven IoT security must-knows:
fundamental security ideas
Authorization and identification
Cryptography
electronic certificates
electronic signatures
Private key encryption
Public key encryption
Final Thoughts
With so much going on in the globe, it can be hard to stay up with technology. We've produced a list of seven tech must-knows.
You might also like

Stephen Moore
3 years ago
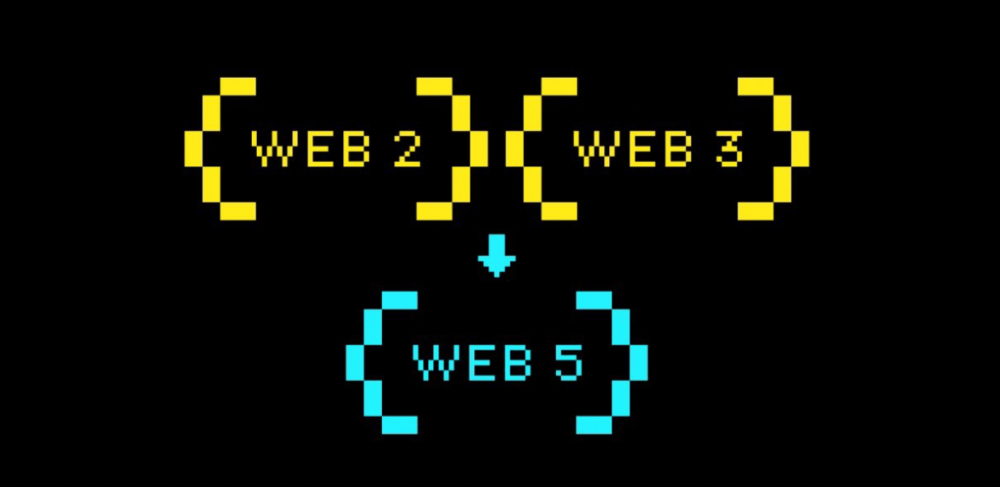
Web 2 + Web 3 = Web 5.
Monkey jpegs and shitcoins have tarnished Web3's reputation. Let’s move on.
Web3 was called "the internet's future."
Well, 'crypto bros' shouted about it loudly.
As quickly as it arrived to be the next internet, it appears to be dead. It's had scandals, turbulence, and crashes galore:
Web 3.0's cryptocurrencies have crashed. Bitcoin's all-time high was $66,935. This month, Ethereum fell from $2130 to $1117. Six months ago, the cryptocurrency market peaked at $3 trillion. Worst is likely ahead.
Gas fees make even the simplest Web3 blockchain transactions unsustainable.
Terra, Luna, and other dollar pegs collapsed, hurting crypto markets. Celsius, a crypto lender backed by VCs and Canada's second-largest pension fund, and Binance, a crypto marketplace, have withheld money and coins. They're near collapse.
NFT sales are falling rapidly and losing public interest.
Web3 has few real-world uses, like most crypto/blockchain technologies. Web3's image has been tarnished by monkey profile pictures and shitcoins while failing to become decentralized (the whole concept is controlled by VCs).
The damage seems irreparable, leaving Web3 in the gutter.
Step forward our new saviour — Web5
Fear not though, as hero awaits to drag us out of the Web3 hellscape. Jack Dorsey revealed his plan to save the internet quickly.
Dorsey has long criticized Web3, believing that VC capital and silicon valley insiders have created a centralized platform. In a tweet that upset believers and VCs (he was promptly blocked by Marc Andreessen), Dorsey argued, "You don't own "Web3." VCs and LPs do. Their incentives prevent it. It's a centralized organization with a new name.
Dorsey announced Web5 on June 10 in a very Elon-like manner. Block's TBD unit will work on the project (formerly Square).
Web5's pitch is that users will control their own data and identity. Bitcoin-based. Sound familiar? The presentation pack's official definition emphasizes decentralization. Web5 is a decentralized web platform that enables developers to write decentralized web apps using decentralized identifiers, verifiable credentials, and decentralized web nodes, returning ownership and control over identity and data to individuals.
Web5 would be permission-less, open, and token-less. What that means for Earth is anyone's guess. Identity. Ownership. Blockchains. Bitcoin. Different.
Web4 appears to have been skipped, forever destined to wish it could have shown the world what it could have been. (It was probably crap.) As this iteration combines Web2 and Web3, simple math and common sense add up to 5. Or something.
Dorsey and his team have had this idea simmering for a while. Daniel Buchner, a member of Block's Decentralized Identity team, said, "We're finishing up Web5's technical components."
Web5 could be the project that decentralizes the internet. It must be useful to users and convince everyone to drop the countless Web3 projects, products, services, coins, blockchains, and websites being developed as I write this.
Web5 may be too late for Dorsey and the incoming flood of creators.
Web6 is planned!
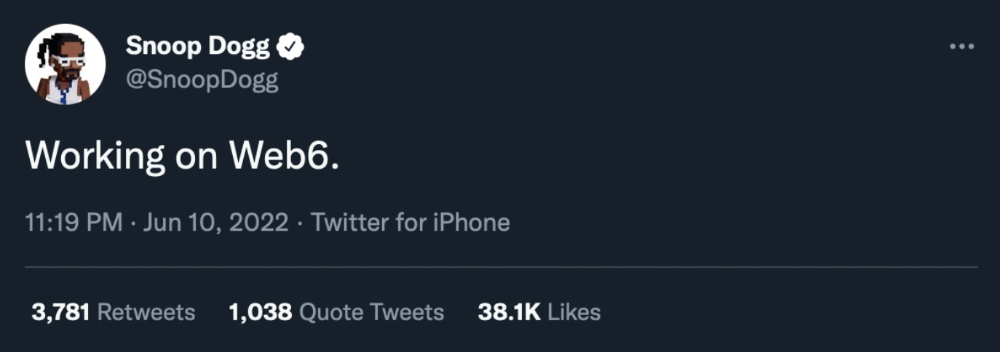
The next months and years will be hectic and less stable than the transition from Web 1.0 to Web 2.0.
Web1 was around 1991-2004.
Web2 ran from 2004 to 2021. (though the Web3 term was first used in 2014, it only really gained traction years later.)
Web3 lasted a year.
Web4 is dead.
Silicon Valley billionaires are turning it into a startup-style race, each disrupting the next iteration until they crack it. Or destroy it completely.
Web5 won't last either.

Architectural Digest
3 years ago
Take a look at The One, a Los Angeles estate with a whopping 105,000 square feet of living area.
The interiors of the 105,000-square-foot property, which sits on a five-acre parcel in the wealthy Los Angeles suburb of Bel Air and is suitably titled The One, have been a well guarded secret. We got an intimate look inside this world-record-breaking property, as well as the creative and aesthetic geniuses behind it.
The estate appears to float above the city, surrounded on three sides by a moat and a 400-foot-long running track. Completed over eight years—and requiring 600 workers to build—the home was designed by architect Paul McClean and interior designer Kathryn Rotondi, who were enlisted by owner and developer Nile Niami to help it live up to its standard.
"This endeavor seemed both exhilarating and daunting," McClean says. However, the home's remarkable location and McClean's long-standing relationship with Niami persuaded him to "build something unique and extraordinary" rather than just take on the job.
And McClean has more than delivered.
The home's main entrance leads to a variety of meeting places with magnificent 360-degree views of the Pacific Ocean, downtown Los Angeles, and the San Gabriel Mountains, thanks to its 26-foot-high ceilings. There is water at the entrance area, as well as a sculpture and a bridge. "We often employ water in our design approach because it provides a sensory change that helps you acclimatize to your environment," McClean explains.
Niami wanted a neutral palette that would enable the environment and vistas to shine, so she used black, white, and gray throughout the house.
McClean has combined the home's inside with outside "to create that quintessential L.A. lifestyle but on a larger scale," he says, drawing influence from the local environment and history of Los Angeles modernism. "We separated the entertaining spaces from the living portions to make the house feel more livable. The former are on the lowest level, which serves as a plinth for the rest of the house and minimizes its apparent mass."
The home's statistics, in addition to its eye-catching style, are equally impressive. There are 42 bathrooms, 21 bedrooms, a 5,500-square-foot master suite, a 30-car garage gallery with two car-display turntables, a four-lane bowling alley, a spa level, a 30-seat movie theater, a "philanthropy wing (with a capacity of 200) for charity galas, a 10,000-square-foot sky deck, and five swimming pools.
Rotondi, the creator of KFR Design, collaborated with Niami on the interior design to create different spaces that flow into one another despite the house's grandeur. "I was especially driven to 'wow factor' components in the hospitality business," Rotondi says, citing top luxury hotel brands such as Aman, Bulgari, and Baccarat as sources of inspiration. Meanwhile, the home's color scheme, soft textures, and lighting are a nod to Niami and McClean's favorite Tom Ford boutique on Rodeo Drive.
The house boasts an extraordinary collection of art, including a butterfly work by Stephen Wilson on the lower level and a Niclas Castello bespoke panel in black and silver in the office, thanks to a cooperation between Creative Art Partners and Art Angels. There is also a sizable collection of bespoke furniture pieces from byShowroom.
A house of this size will never be erected again in Los Angeles, thanks to recently enacted city rules, so The One will truly be one of a kind. "For all of us, this project has been such a long and instructive trip," McClean says. "It was exciting to develop and approached with excitement, but I don't think any of us knew how much effort and time it would take to finish the project."

Hudson Rennie
3 years ago
Meet the $5 million monthly controversy-selling King of Toxic Masculinity.
Trigger warning — Andrew Tate is running a genius marketing campaign

Andrew Tate is a 2022 internet celebrity.
Kickboxing world champion became rich playboy with controversial views on gender roles.
Andrew's get-rich-quick scheme isn't new. His social media popularity is impressive.
He’s currently running one of the most genius marketing campaigns in history.
He pulls society's pendulum away from diversity and inclusion and toward diversion and exclusion. He's unstoppable.
Here’s everything you need to know about Andrew Tate. And how he’s playing chess while the world plays checkers.
Cobra Tate is the name he goes by.
American-born, English-raised entrepreneur Andrew Tate lives in Romania.
Romania? Says Andrew,
“I prefer a country in which corruption is available to everyone.”
Andrew was a professional kickboxer with the ring moniker Cobra before starting Hustlers University.
Before that, he liked chess and worshipped his father.
Emory Andrew Tate III is named after his grandmaster chess player father.
Emory was the first black-American chess champion. He was military, martial arts-trained, and multilingual. A superhuman.
He lived in his car to make ends meet.
Andrew and Tristan relocated to England with their mother when their parents split.
It was there that Andrew began his climb toward becoming one of the internet’s greatest villains.
Andrew fell in love with kickboxing.
Andrew spent his 20s as a professional kickboxer and reality TV star, featuring on Big Brother UK and The Ultimate Traveller.
These 3 incidents, along with a chip on his shoulder, foreshadowed Andrews' social media breakthrough.
Chess
Combat sports
Reality television
A dangerous trio.
Andrew started making money online after quitting kickboxing in 2017 due to an eye issue.
Andrew didn't suddenly become popular.
Andrew's web work started going viral in 2022.
Due to his contentious views on patriarchy and gender norms, he's labeled the King of Toxic Masculinity. His most contentious views (trigger warning):
“Women are intrinsically lazy.”
“Female promiscuity is disgusting.”
“Women shouldn’t drive cars or fly planes.”
“A lot of the world’s problems would be solved if women had their body count tattooed on their foreheads.”
Andrew's two main beliefs are:
“These are my personal opinions based on my experiences.”
2. “I believe men are better at some things and women are better at some things. We are not equal.”
Andrew intentionally offends.
Andrew's thoughts began circulating online in 2022.
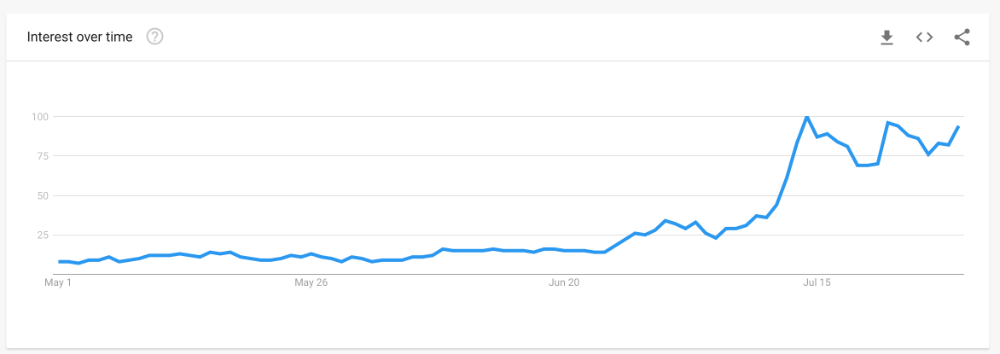
In July 2022, he was one of the most Googled humans, surpassing:
Joe Biden
Donald Trump
Kim Kardashian
Andrews' rise is a mystery since no one can censure or suppress him. This is largely because Andrew nor his team post his clips.
But more on that later.
Andrew's path to wealth.
Andrew Tate is a self-made millionaire. His morality is uncertain.
Andrew and Tristan needed money soon after retiring from kickboxing.
“I owed some money to some dangerous people. I had $70K and needed $100K to stay alive.”
Andrews lost $20K on roulette at a local casino.
Andrew had one week to make $50,000, so he started planning. Andrew locked himself in a chamber like Thomas Edison to solve an energy dilemma.
He listed his assets.
Physical strength (but couldn’t fight)
a BMW (worth around $20K)
Intelligence (but no outlet)
A lightbulb.
He had an epiphany after viewing a webcam ad. He sought aid from women, ironically. His 5 international girlfriends are assets.
Then, a lightbulb.
Andrew and Tristan messaged and flew 7 women to a posh restaurant. Selling desperation masked as opportunity, Andrew pitched his master plan:
A webcam business — with a 50/50 revenue split.
5 women left.
2 stayed.
Andrew Tate, a broke kickboxer, became Top G, Cobra Tate.
The business model was simple — yet sad.
Andrew's girlfriends moved in with him and spoke online for 15+ hours a day. Andrew handled ads and equipment as the women posed.
Andrew eventually took over their keyboards, believing he knew what men wanted more than women.
Andrew detailed on the Full Send Podcast how he emotionally manipulated men for millions. They sold houses, automobiles, and life savings to fuel their companionship addiction.
When asked if he felt bad, Andrew said,
“F*ck no.“
Andrew and Tristan wiped off debts, hired workers, and diversified.
Tristan supervised OnlyFans models.
Andrew bought Romanian casinos and MMA league RXF (Real Xtreme Fighting).
Pandemic struck suddenly.
Andrew couldn't run his 2 businesses without a plan. Another easy moneymaker.
He banked on Hustlers University.
The actual cause of Andrew's ubiquity.
On a Your Mom’s House episode Andrew's 4 main revenue sources:
Hustler’s University
2. Owning casinos in Romania
3. Owning 10% of the Romanian MMA league “RXF”
4. “The War Room” — a society of rich and powerful men
When the pandemic hit, 3/4 became inoperable.
So he expanded Hustlers University.
But what is Hustler’s University?
Andrew says Hustlers University teaches 18 wealth-building tactics online. Examples:
Real estate
Copywriting
Amazon FBA
Dropshipping
Flipping Cryptos
How to swiftly become wealthy.
Lessons are imprecise, rudimentary, and macro-focused, say reviews. Invest wisely, etc. Everything is free online.
You pay for community. One unique income stream.
The only money-making mechanism that keeps the course from being a scam.
The truth is, many of Andrew’s students are actually making money. Maybe not from the free YouTube knowledge Andrew and his professors teach in the course, but through Hustler’s University’s affiliate program.
Affiliates earn 10% commission for each new student = $5.
Students can earn $10 for each new referral in the first two months.
Andrew earns $50 per membership per month.
This affiliate program isn’t anything special — in fact, it’s on the lower end of affiliate payouts. Normally, it wouldn’t be very lucrative.
But it has one secret weapon— Andrew and his viral opinions.
Andrew is viral. Andrew went on a media tour in January 2022 after appearing on Your Mom's House.
And many, many more…
He chatted with Twitch streamers. Hustlers University wanted more controversy (and clips).
Here’s the strategy behind Hustler’s University that has (allegedly) earned students upwards of $10K per month:
Make a social media profile with Andrew Tates' name and photo.
Post any of the online videos of Andrews that have gone viral.
Include a referral link in your bio.
Effectively simple.
Andrew's controversy attracts additional students. More student clips circulate as more join. Andrew's students earn more and promote the product as he goes viral.
A brilliant plan that's functioning.
At the beginning of his media tour, Hustler’s University had 5,000 students. 6 months in, and he now has over 100,000.
One income stream generates $5 million every month.
Andrew's approach is not new.
But it is different.
In the early 2010s, Tai Lopez dominated the internet.
His viral video showed his house.
“Here in my garage. Just bought this new Lamborghini.”
Tais' marketing focused on intellect, not strength, power, and wealth to attract women.
How reading quicker leads to financial freedom in 67 steps.
Years later, it was revealed that Tai Lopez rented the mansion and Lamborghini as a marketing ploy to build social proof. Meanwhile, he was living in his friend’s trailer.
Faked success is an old tactic.
Andrew is doing something similar. But with one major distinction.
Andrew outsources his virality — making him nearly impossible to cancel.
In 2022, authorities searched Andrews' estate over human trafficking suspicions. Investigation continues despite withdrawn charges.
Andrew's divisive nature would normally get him fired. Andrew's enterprises and celebrity don't rely on social media.
He doesn't promote or pay for ads. Instead, he encourages his students and anyone wishing to get rich quick to advertise his work.
Because everything goes through his affiliate program. Old saying:
“All publicity is good publicity.”
Final thoughts: it’s ok to feel triggered.
Tate is divisive.
His emotionally charged words are human nature. Andrews created the controversy.
It's non-personal.
His opinions are those of one person. Not world nor generational opinion.
Briefly:
It's easy to understand why Andrews' face is ubiquitous. Money.
The world wide web is a chessboard. Misdirection is part of it.
It’s not personal, it’s business.
Controversy sells
Sometimes understanding the ‘why’, can help you deal with the ‘what.’